Ends Dec 1, PT
SciFig

Free Root Locus Plot Generator

A root locus plot traces the closed-loop poles of a feedback system as its gain changes.

Describe what you need in the box above.

Start with up to 150 free credits|No credit card required

Get up to 250 free credits on day one when you join through an invite.

3 figure engines · 500+ templatesEvery label editable · 60+ color schemesEditable PPTX · Layered SVG · 8K PNG / JPG

Root locus plot

Follow the closed-loop poles as gain K varies, then inspect their coordinates at a selected gain.

Continuous-time, real-coefficient SISO systems of order 1–4, with a lower-order numerator and unity negative feedback: D(s) + K N(s) = 0, K ≥ 0. The plot covers the selected gain range, without automatic stability certification.

Enter coefficients in descending powers of s, separated by commas. For s² + 2s, enter 1, 2, 0. Each coefficient must be finite and between −1,000,000 and 1,000,000.

Choose an example or enter a system, then calculate the plot.

Free Root Locus Plot Generator— templates & examples

Updated

From loop gain to closed-loop poles

Free Root Locus Plot Generator

See how feedback gain moves the poles, then take the figure and its numerical values into your report.

Create a root locus plot online: enter the numerator and denominator coefficients of your continuous-time transfer function, choose a nonnegative gain range, and select Calculate. SciFig draws the root locus, marks the open-loop poles and zeros, and lists the closed-loop poles at your selected K. No code or written prompt is needed for this calculator. It solves D(s) + K N(s) = 0 for unity negative feedback, with real-coefficient, strictly proper systems of order 1–4. The plotted trajectory covers your chosen finite gain range; SVG and PNG figures, sampled CSV data and reusable JSON settings are available.

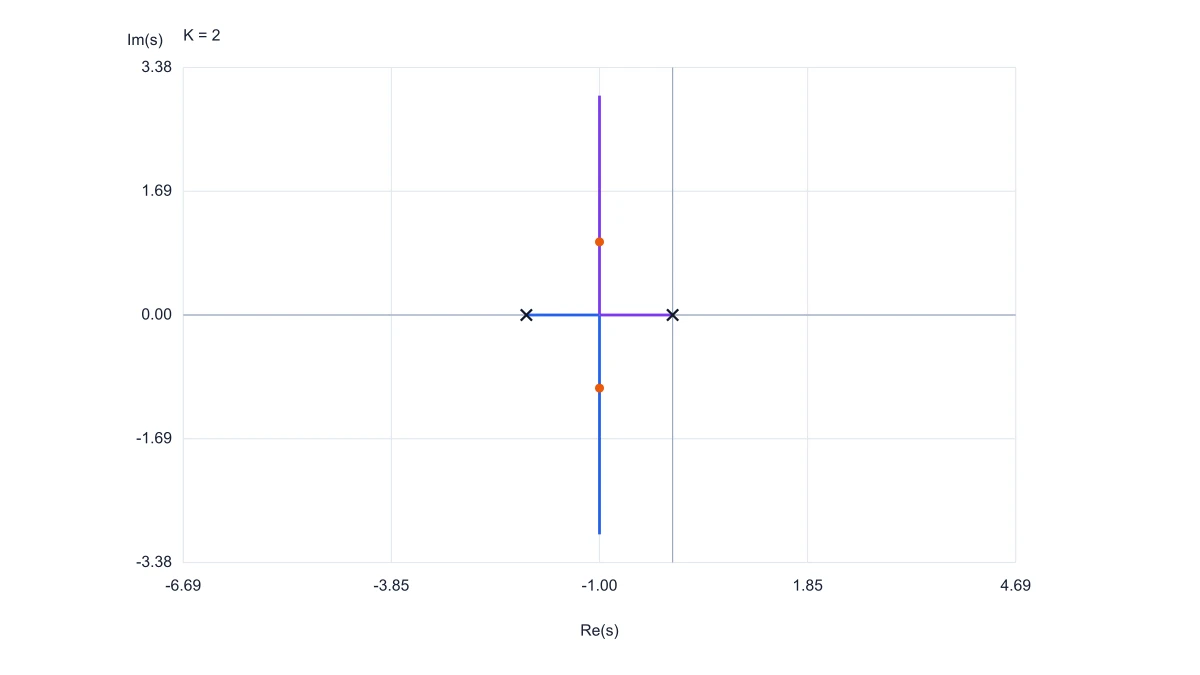
Root locus for 1/(s² + 2s), with open-loop pole crosses and the closed-loop roots highlighted at K = 2
  • Enter coefficients in descending powers of s
  • Inspect the closed-loop poles at a selected gain
  • Keep open-loop poles and zeros visible
  • Export the figure, sampled roots and settings

Explore Your Root Locus Plot

Connect the transfer function, the gain range and the pole coordinates without moving between a calculation script and a drawing program.

Follow the closed-loop poles as gain changes

A gain value changes the characteristic polynomial and therefore the positions of the closed-loop poles. The root locus plot generator computes these roots across your selected interval and draws their paths in the complex plane. Choose a gain of interest to mark its roots on the graph and read the corresponding coordinates alongside it.

  • Solve D(s) + K N(s) = 0
  • Mark the roots at the selected K
  • Compare real and imaginary coordinates
Explore a gain range

Distinguish open-loop poles, zeros and selected roots

The starting model and the closed-loop result play different roles in a root locus diagram. Crosses mark the roots of the denominator polynomial D(s) (the open-loop pole markers), circles mark the finite zeros of N(s), and colored points identify the roots at your chosen gain. Keeping those markers together helps explain the model before discussing how its feedback response changes.

  • Open-loop poles shown as crosses
  • Finite zeros shown as circles
  • Selected closed-loop roots shown separately
Inspect your poles and zeros

Choose the gain interval and sampling scale

Use a linear gain grid to inspect a focused interval, or a logarithmic grid when the positive gains span several orders of magnitude. The root locus calculator also lets you select a sampled gain to inspect. It samples a finite interval rather than the entire path to infinite gain; uncertain connections near repeated roots are left disconnected.

  • Set the minimum and maximum gain
  • Choose linear or logarithmic sampling
  • Read the gain associated with each sampled set of roots
Set your gain interval

Keep the figure and the calculation settings together

A root locus figure is easier to reuse when its inputs travel with it. Export SVG for a scalable line drawing or PNG for a document, and keep the sampled roots as CSV. Saving the transfer function and gain settings as JSON lets a colleague reopen the same setup and calculate another view of the same model.

  • Download SVG or PNG
  • Save gain and complex root coordinates as CSV
  • Restore coefficient and gain settings from JSON
Prepare a figure for export

How to Plot a Root Locus Online

To create a root locus plot online, start with the open-loop transfer function N(s)/D(s). The calculator applies a variable scalar gain K under unity negative feedback.

  1. Enter the polynomial coefficients

    Type numerator and denominator coefficients in descending powers of s, keeping zeros for missing powers. For G(s) = 1/[s(s + 2)], enter 1 as the numerator and 1, 2, 0 as the denominator. You can also start from a built-in example.

  2. Set the gain range and selected K

    Choose the minimum and maximum nonnegative gain, the number of samples and linear or logarithmic spacing. Set a particular K for the highlighted closed-loop poles.

  3. Calculate and inspect the roots

    Select Calculate to draw the trajectory. Compare the crosses, circles and highlighted roots, then inspect the listed coordinates or move through the sampled gains. Editing the inputs clears the result so the displayed figure always corresponds to an explicit calculation.

  4. Export or save the setup

    Download the root locus as SVG or PNG, or export the sampled gain and root coordinates as CSV. Save settings as JSON when you want to return to the same model later or share its coefficients and gain range with a colleague.

Root Locus Plots for Coursework and Reports

Use the same model inputs to create a clear pole trajectory, a numerical attachment or a reusable calculation setup for the task at hand.

Root locus for 1/(s² + 2s), with open-loop pole crosses and the closed-loop roots highlighted at K = 2

Check a control-systems assignment

Bring the transfer function from a feedback-control exercise and plot the gain interval used in your solution. Inspect the selected-K roots beside your algebra, then include the SVG with your explanation of the characteristic equation. The graph provides a numerical companion to the derivation.

Explore this example
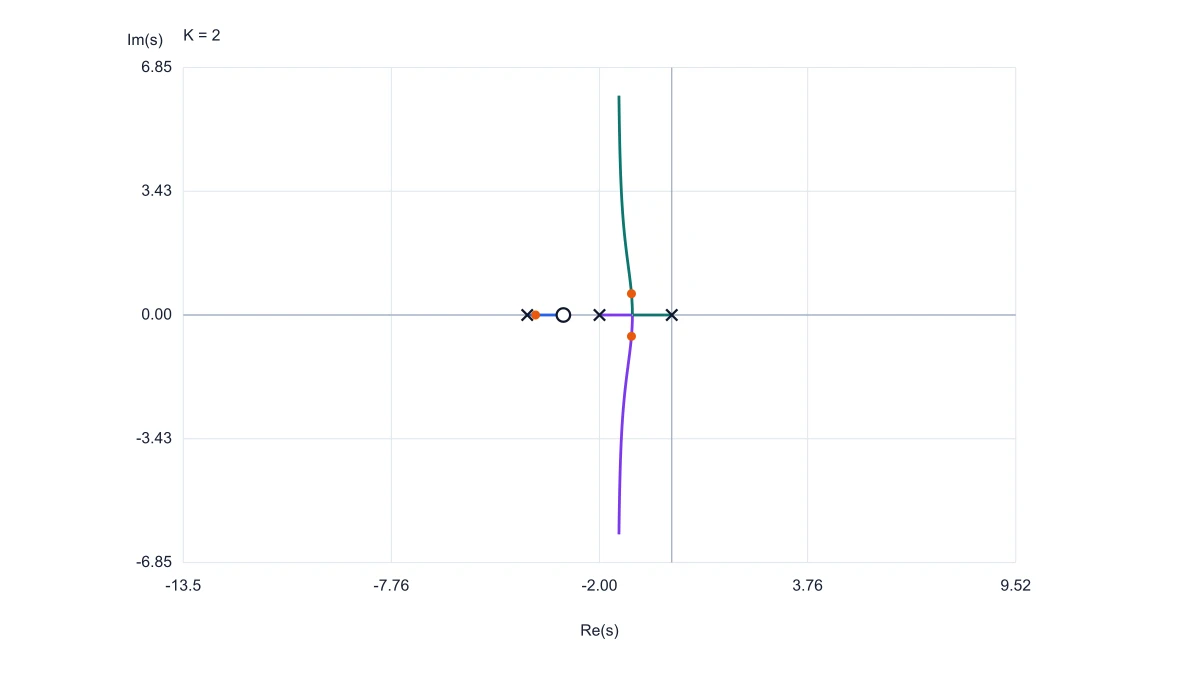
Root locus of (s + 3)/(s³ + 6s² + 8s), showing a finite zero and three open-loop poles

Discuss candidate feedback gains

For a design discussion, start from an agreed plant model and calculate separate views for the gains your team is comparing. The selected pole coordinates make each snapshot specific. Put the images into a review document with the model assumptions and gain values stated alongside them.

Explore this example
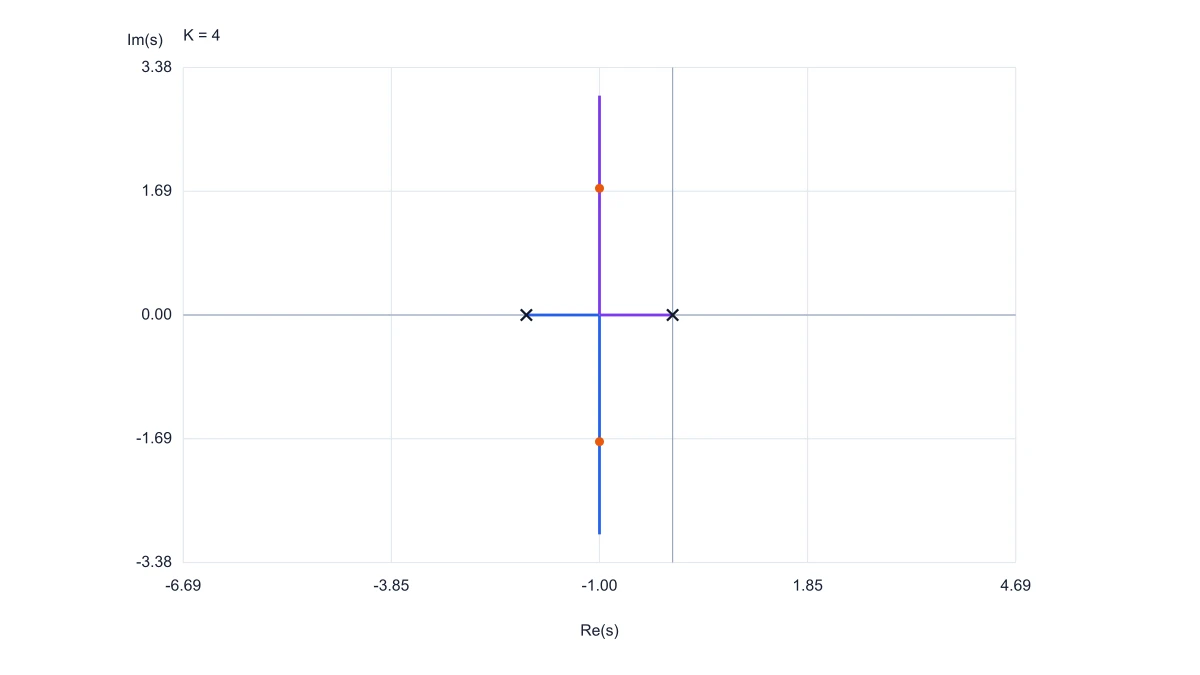
The same root locus with the selected closed-loop poles highlighted at K = 4

Explain the role of an open-loop zero

In a controls lesson, use a model with a finite numerator zero and keep its circle marker visible beside the open-loop pole crosses. Follow the computed branches over a chosen gain interval, then export the figure to annotate how the starting model relates to the closed-loop roots.

Explore this example
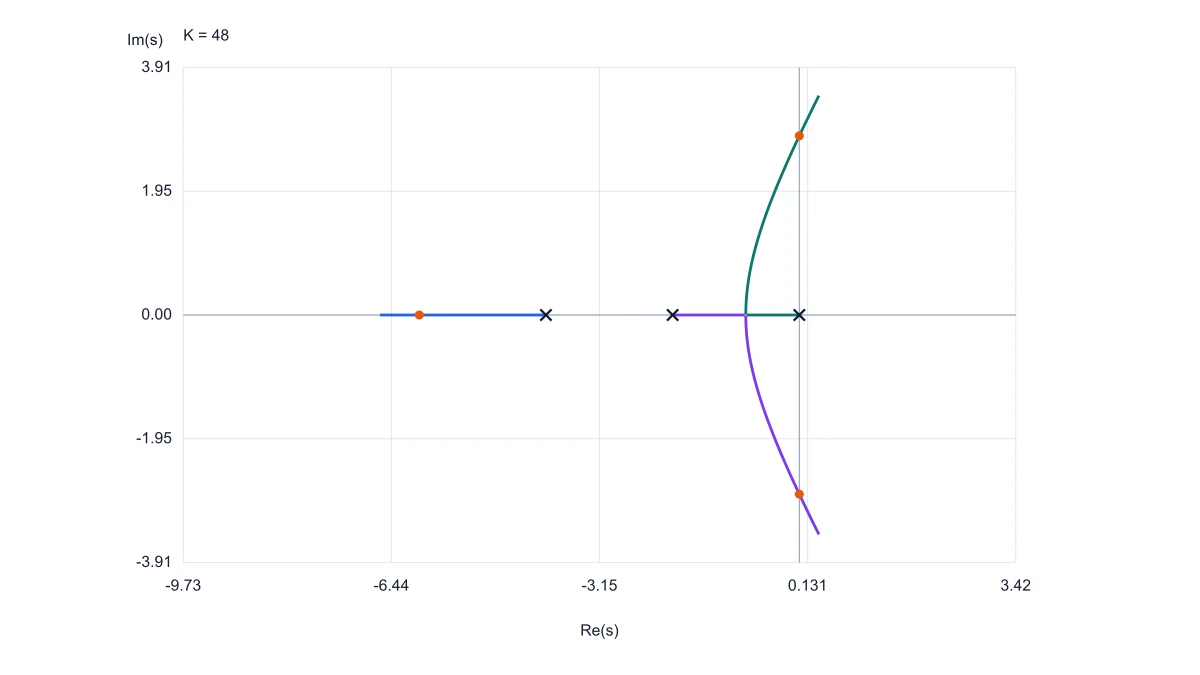
Three-branch root locus for 1/(s³ + 6s² + 8s), with roots highlighted at K = 48

Document a continuous-time laboratory model

When a laboratory exercise has produced a low-order rational model, enter those coefficients and plot the root locus for the gain values under discussion. Keep the sampled roots as CSV with the lab report so readers can inspect numerical positions as well as the displayed trajectory.

Explore this example
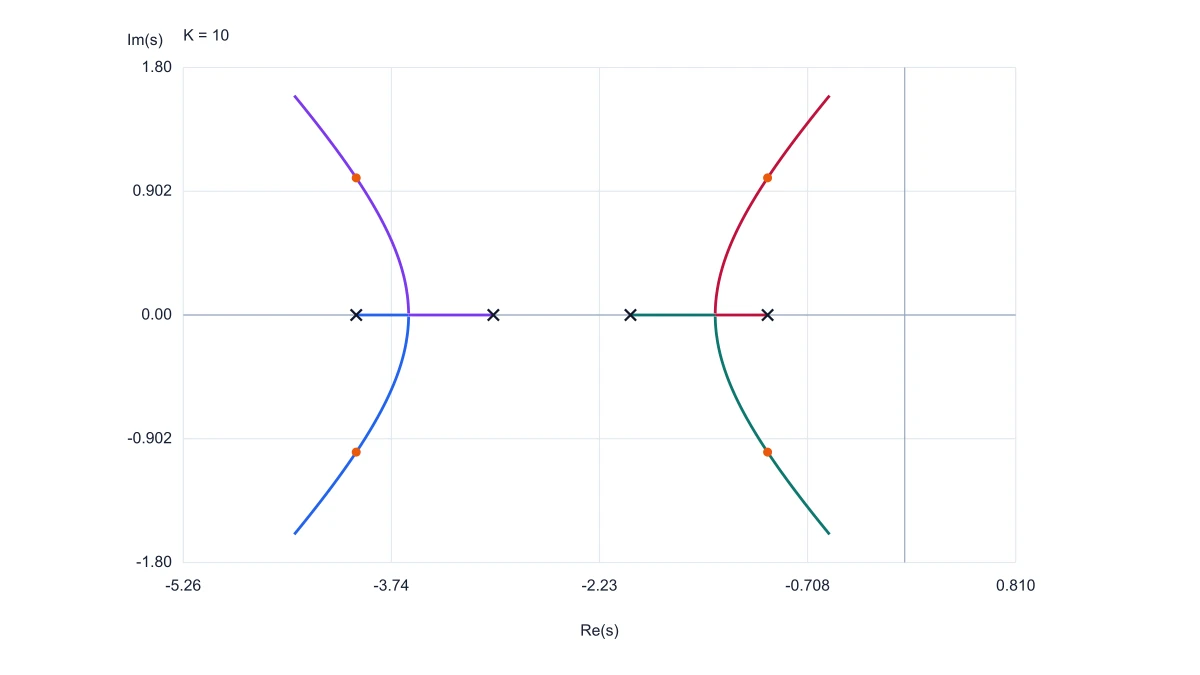
Fourth-order root locus with four branches and the selected roots at K = 10

Hand a calculation setup to a teammate

Save the coefficients, sampling choices and gain interval as a JSON settings file before handing off a control-model discussion. A teammate can restore that setup and calculate a new selected-K view, keeping the numerical inputs explicit while preparing their own figure or report section.

Explore this example

Root locus for 1/(s² + 2s), with open-loop pole crosses and the closed-loop roots highlighted at K = 2

Prepare a scalable figure for a thesis

Use the SVG export when a root locus must remain readable across a thesis page, a presentation slide and a printed handout. Keep the selected gain and transfer function in the caption, with the CSV root coordinates available as supporting material for the numerical example.

Explore this example
Root Locus Plot · Project Workflows

My report used a root locus plot to compare proportional gains for a two-pole plant. I entered the coefficients once, changed the selected K and kept the highlighted pole coordinates beside each SVG. That made it much easier to explain which figure belonged to which gain in the final discussion.

Maya Chen

Control engineering master's student, University of Sheffield

Free tools

A tool for every scientific figure

156 focused generators for the scientific figure you need — each opens in the right workspace with a matching example.

Illustrations, structures and concept diagrams

87 tools
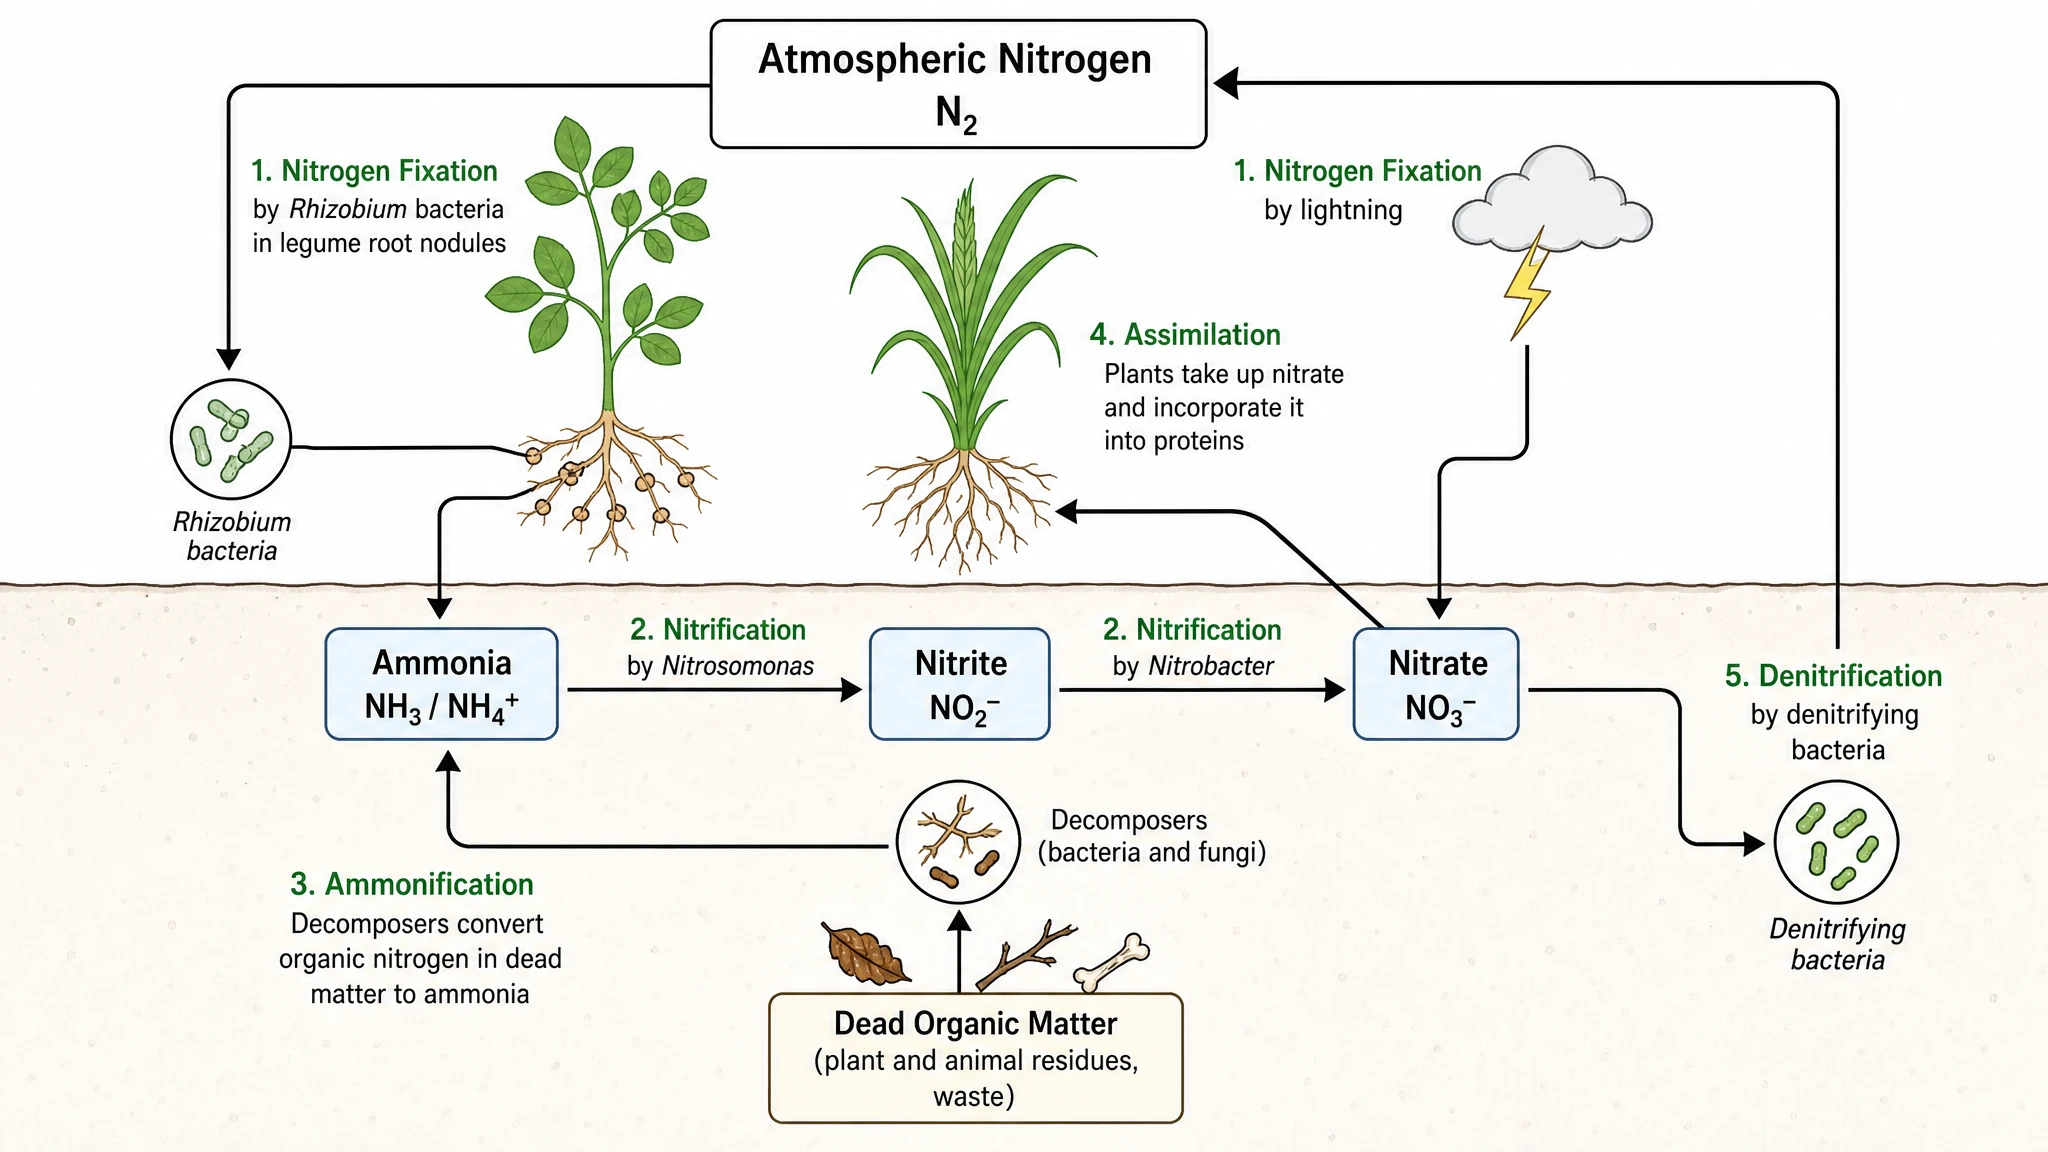
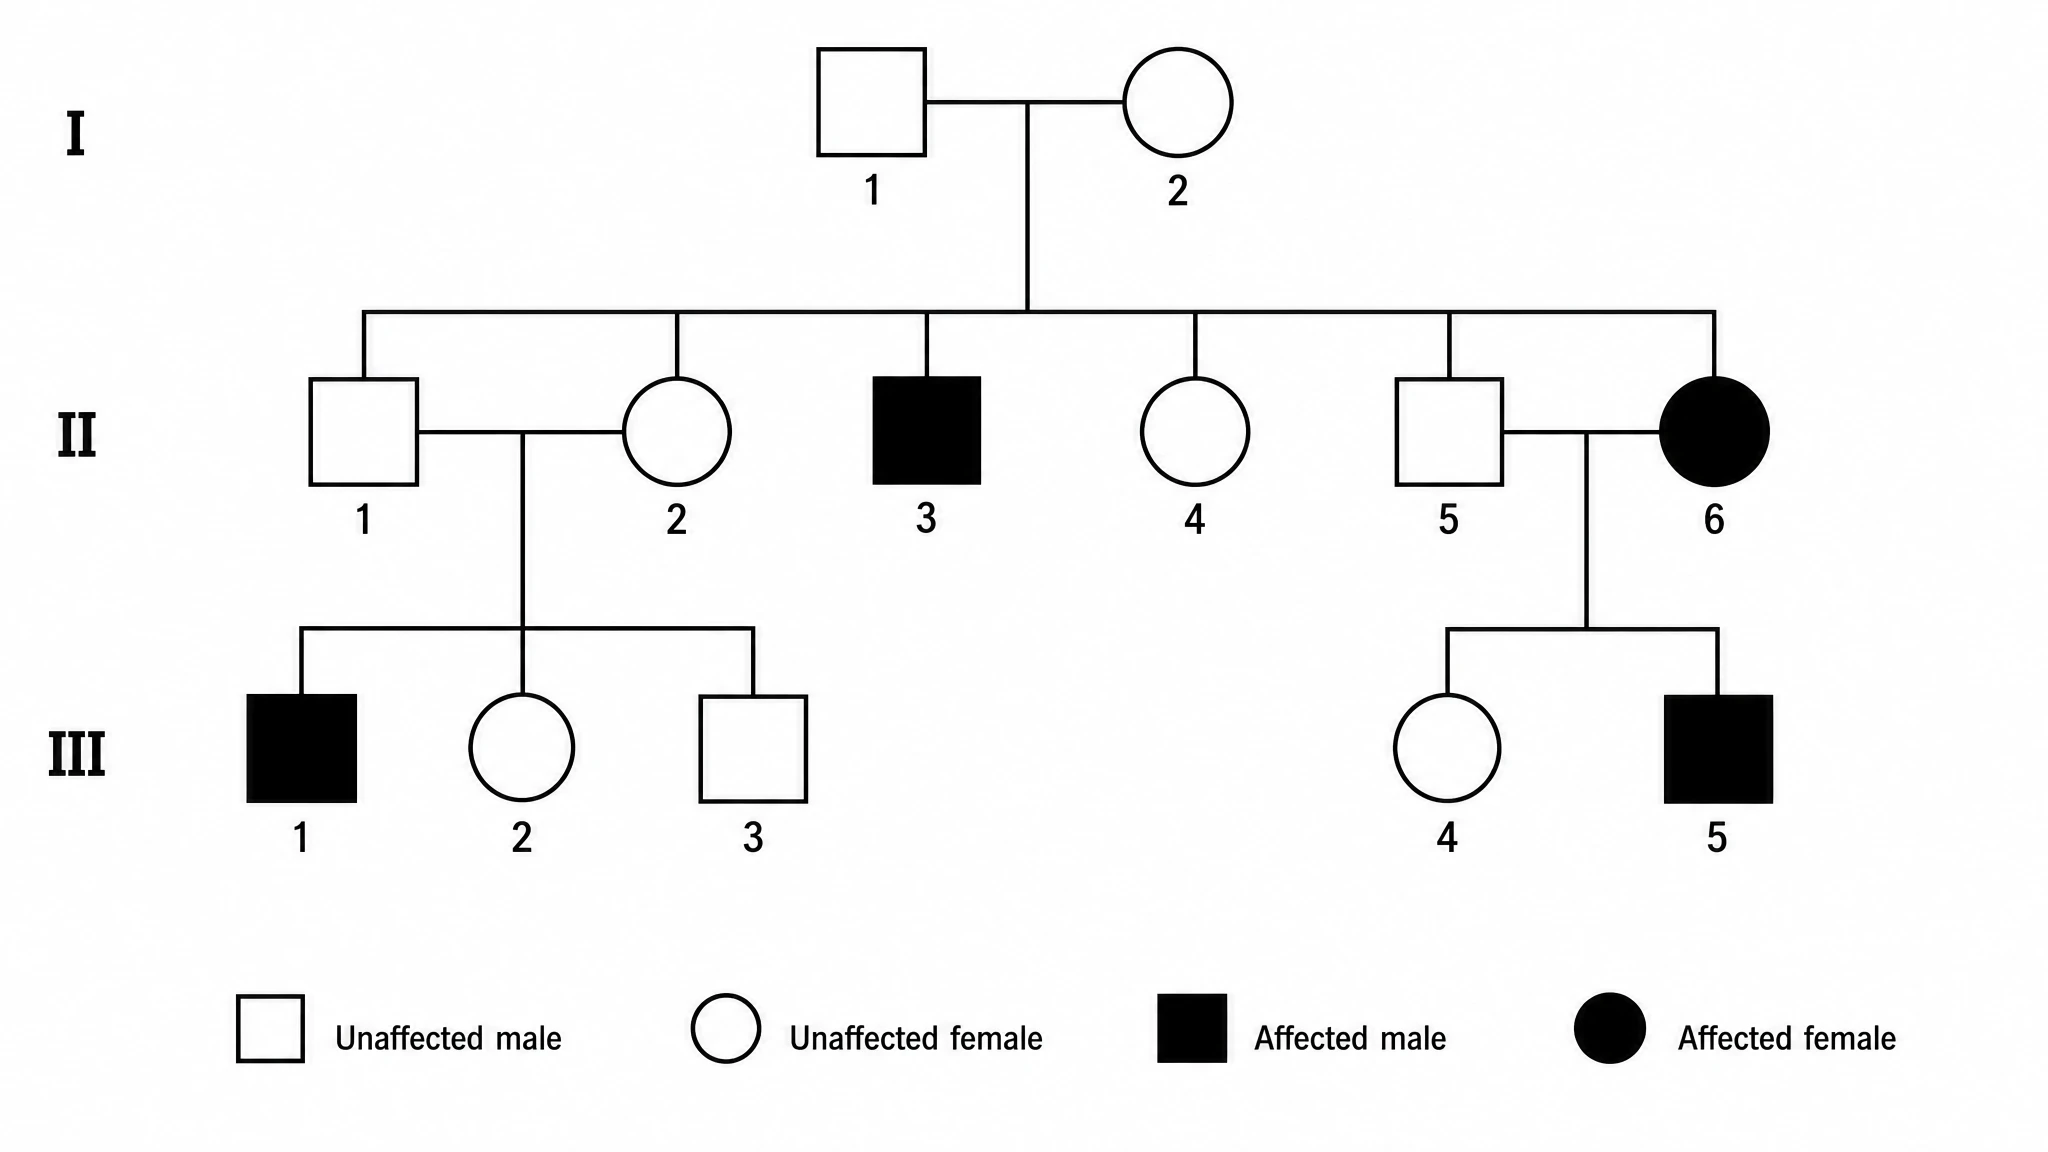
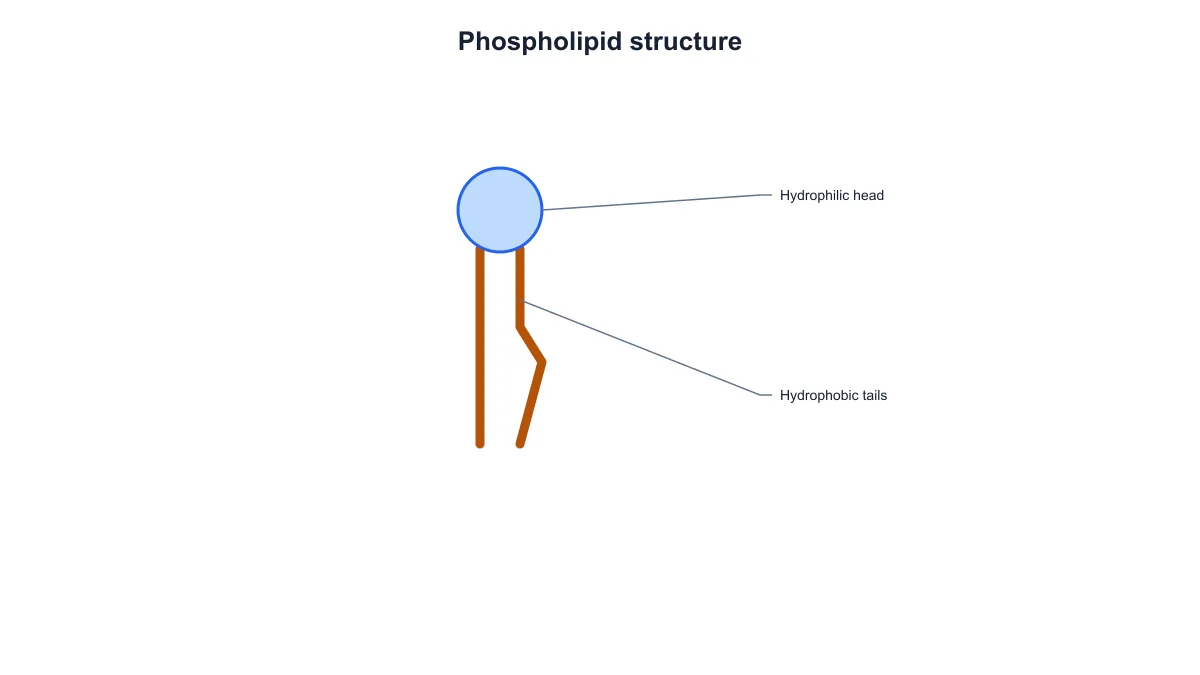
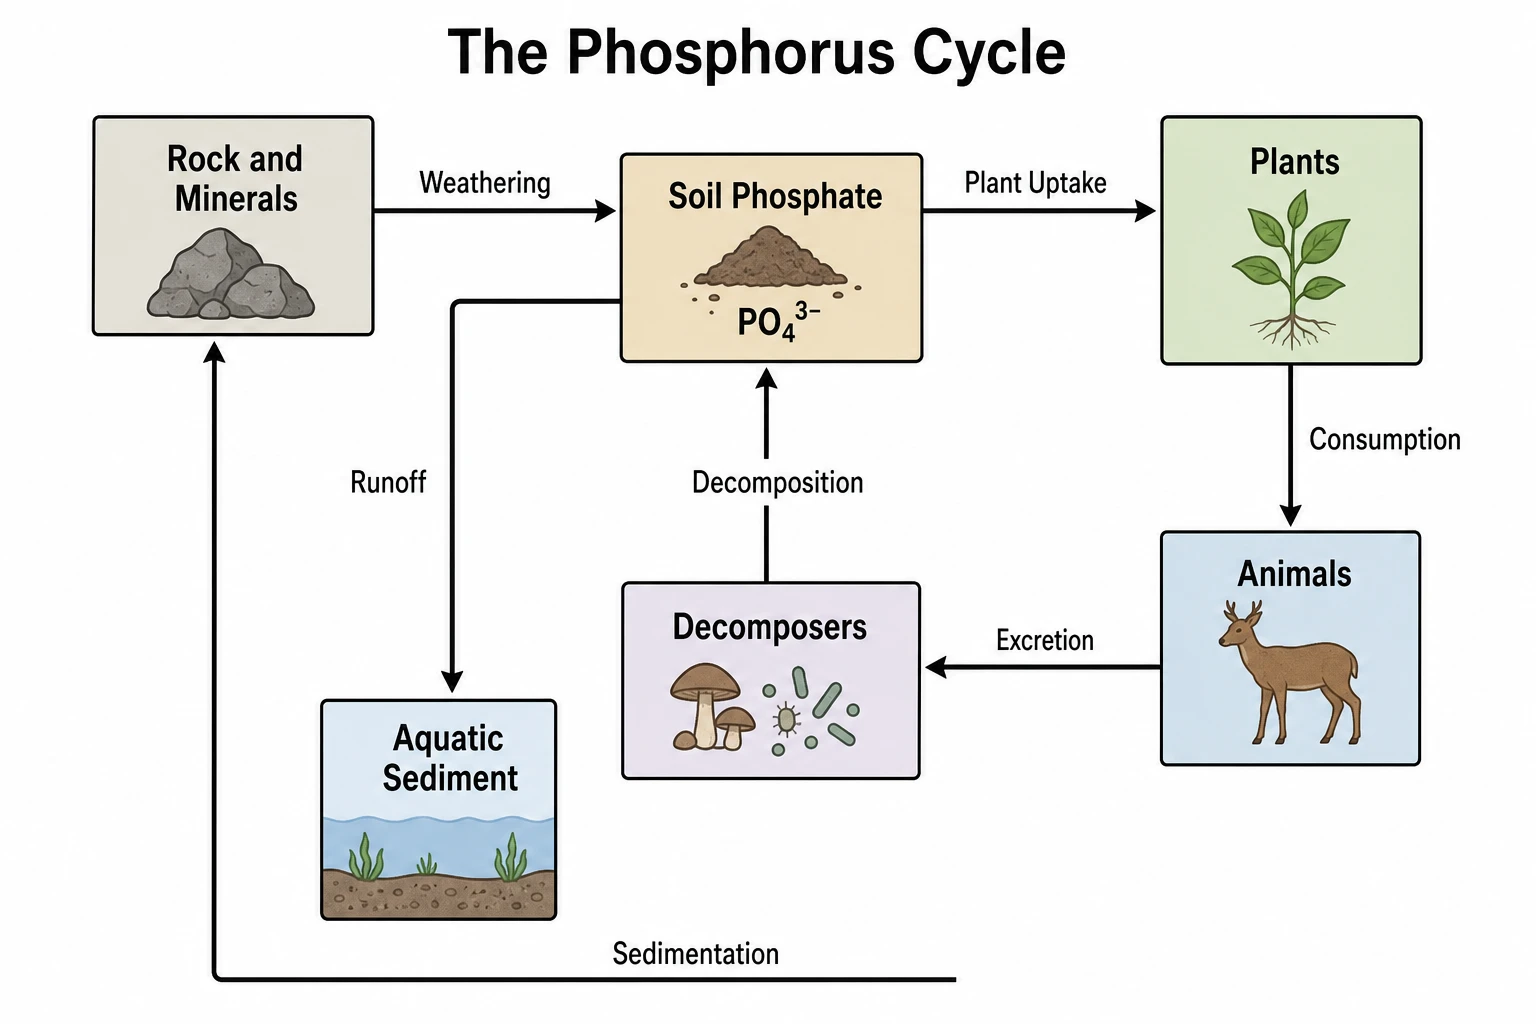
Chemistry Structure Generator example figureChemistry Structure GeneratorGraphical Abstract Maker example figureGraphical Abstract MakerFree Body Diagram Generator example figureFree Body Diagram GeneratorCircuit Diagram Maker example figureCircuit Diagram MakerAI Scientific Image Generator example figureAI Scientific Image GeneratorEditable 96-Well Plate example figureEditable 96-Well PlateLewis Dot Structure Generator example figureLewis Dot Structure GeneratorDNA Structure Diagram Generator example figureDNA Structure Diagram GeneratorWiring Diagram Maker example figureWiring Diagram MakerP&ID Diagram Generator example figureP&ID Diagram GeneratorScientific Poster Generator example figureScientific Poster GeneratorCladogram Maker example figureCladogram MakerFood Web Maker example figureFood Web MakerMedical Illustration Generator example figureMedical Illustration GeneratorPCR Diagram Generator example figurePCR Diagram GeneratorPPT Text to Visual Converter example figurePPT Text to Visual ConverterMitosis Diagram Generator example figureMitosis Diagram GeneratorDog Lymph Nodes Diagram example figureDog Lymph Nodes DiagramCSF Circulation Diagram example figureCSF Circulation DiagramEditable 24-Well Plate example figureEditable 24-Well PlateEditable 384-Well Plate example figureEditable 384-Well PlateEditable 48-Well Plate example figureEditable 48-Well PlateEditable 6-Well Plate example figureEditable 6-Well PlateAI Infographic Generator example figureAI Infographic GeneratorAnatomical Drawing Generator example figureAnatomical Drawing GeneratorAnimal and Plant Cell Comparison example figureAnimal and Plant Cell ComparisonAnimal Cell Diagram Generator example figureAnimal Cell Diagram GeneratorAntibody Structure Diagram Generator example figureAntibody Structure Diagram GeneratorApoptosis Diagram Generator example figureApoptosis Diagram GeneratorAutophagy Diagram Generator example figureAutophagy Diagram GeneratorBacteria Diagram Generator example figureBacteria Diagram GeneratorBlueprint Maker example figureBlueprint MakerBohr Model Maker example figureBohr Model MakerBrain Anatomy Diagram example figureBrain Anatomy DiagramCalvin Cycle Diagram Generator example figureCalvin Cycle Diagram GeneratorCarbon Cycle Diagram Generator example figureCarbon Cycle Diagram GeneratorCell Cycle Diagram Generator example figureCell Cycle Diagram GeneratorCell Membrane Diagram example figureCell Membrane DiagramCellular Respiration Diagram Generator example figureCellular Respiration Diagram GeneratorComplement System Diagram Generator example figureComplement System Diagram GeneratorCRISPR-Cas9 Diagram Generator example figureCRISPR-Cas9 Diagram GeneratorDNA Replication Diagram Generator example figureDNA Replication Diagram GeneratorEar Anatomy Diagram example figureEar Anatomy DiagramElectron Configuration Diagram Generator example figureElectron Configuration Diagram GeneratorElectron Transport Chain Diagram Generator example figureElectron Transport Chain Diagram GeneratorELISA Diagram Generator example figureELISA Diagram GeneratorEye Anatomy Diagram example figureEye Anatomy DiagramFoot Anatomy Diagram example figureFoot Anatomy DiagramGel Electrophoresis Diagram Generator example figureGel Electrophoresis Diagram GeneratorGene Regulation Diagram Generator example figureGene Regulation Diagram GeneratorGlycolysis Diagram Generator example figureGlycolysis Diagram GeneratorHeart Diagram example figureHeart DiagramImage to Editable SVG Converter example figureImage to Editable SVG ConverterImmune Checkpoint Diagram Generator example figureImmune Checkpoint Diagram GeneratorImmune Response Diagram Generator example figureImmune Response Diagram GeneratorInflammasome Diagram Generator example figureInflammasome Diagram GeneratorKrebs Cycle Diagram Generator example figureKrebs Cycle Diagram GeneratorLab Diagram Maker example figureLab Diagram MakerMeiosis Diagram Generator example figureMeiosis Diagram GeneratorMetabolic Pathway Diagram Generator example figureMetabolic Pathway Diagram GeneratorMicroscope Diagram example figureMicroscope DiagramMolecular Orbital Diagram Generator example figureMolecular Orbital Diagram GeneratorNitrogen Cycle Diagram Generator example figureNitrogen Cycle Diagram GeneratorPedigree Chart Maker example figurePedigree Chart MakerPhospholipid Diagram Generator example figurePhospholipid Diagram GeneratorPhosphorus Cycle Diagram Generator example figurePhosphorus Cycle Diagram GeneratorPhotosynthesis Diagram Generator example figurePhotosynthesis Diagram GeneratorPhylogenetic Tree Maker example figurePhylogenetic Tree MakerPhysics Vector Diagram Maker example figurePhysics Vector Diagram MakerPlant Cell Diagram Generator example figurePlant Cell Diagram GeneratorPlasmid Map Maker example figurePlasmid Map MakerProtein Synthesis Diagram Generator example figureProtein Synthesis Diagram GeneratorPunnett Square Maker example figurePunnett Square MakerRay Diagram Maker example figureRay Diagram MakerRNA Structure Diagram Generator example figureRNA Structure Diagram GeneratorScientific Color Palette Generator example figureScientific Color Palette GeneratorSignaling Pathway Diagram Generator example figureSignaling Pathway Diagram GeneratorSingle Line Diagram Generator example figureSingle Line Diagram GeneratorT-Cell Activation Diagram Generator example figureT-Cell Activation Diagram GeneratorWater Cycle Diagram Generator example figureWater Cycle Diagram GeneratorWestern Blot Diagram Generator example figureWestern Blot Diagram GeneratorFungal Cell Diagram example figureFungal Cell DiagramGibson Assembly Diagram example figureGibson Assembly DiagramHigh-Pressure Homogenizer Diagram example figureHigh-Pressure Homogenizer DiagramNeuron Diagram example figureNeuron DiagramSpinning Disk Confocal Optical Diagram example figureSpinning Disk Confocal Optical DiagramSwan-Neck Flask Experiment example figureSwan-Neck Flask Experiment

Root Locus Plot Questions

1.

2.

3.

4.

5.

6.

Call to action background

Your transfer function, your gain range

Create Your Root Locus Plot

Plot the closed-loop roots

Free to start · No credit card required · Built for researchers