
Free Electron Transport Chain Diagram Generator
Generate accurate electron transport chain figures showing complexes I through IV, ATP synthase, and the proton gradient — labeled or blank for class or research.
Start with up to 150 free credits|No credit card required
Get up to 350 free credits on day one when you join through an invite.
Updated
Free Electron Transport Chain Diagram Generator— templates & examples
Everything you need to build a clear electron transport chain diagram
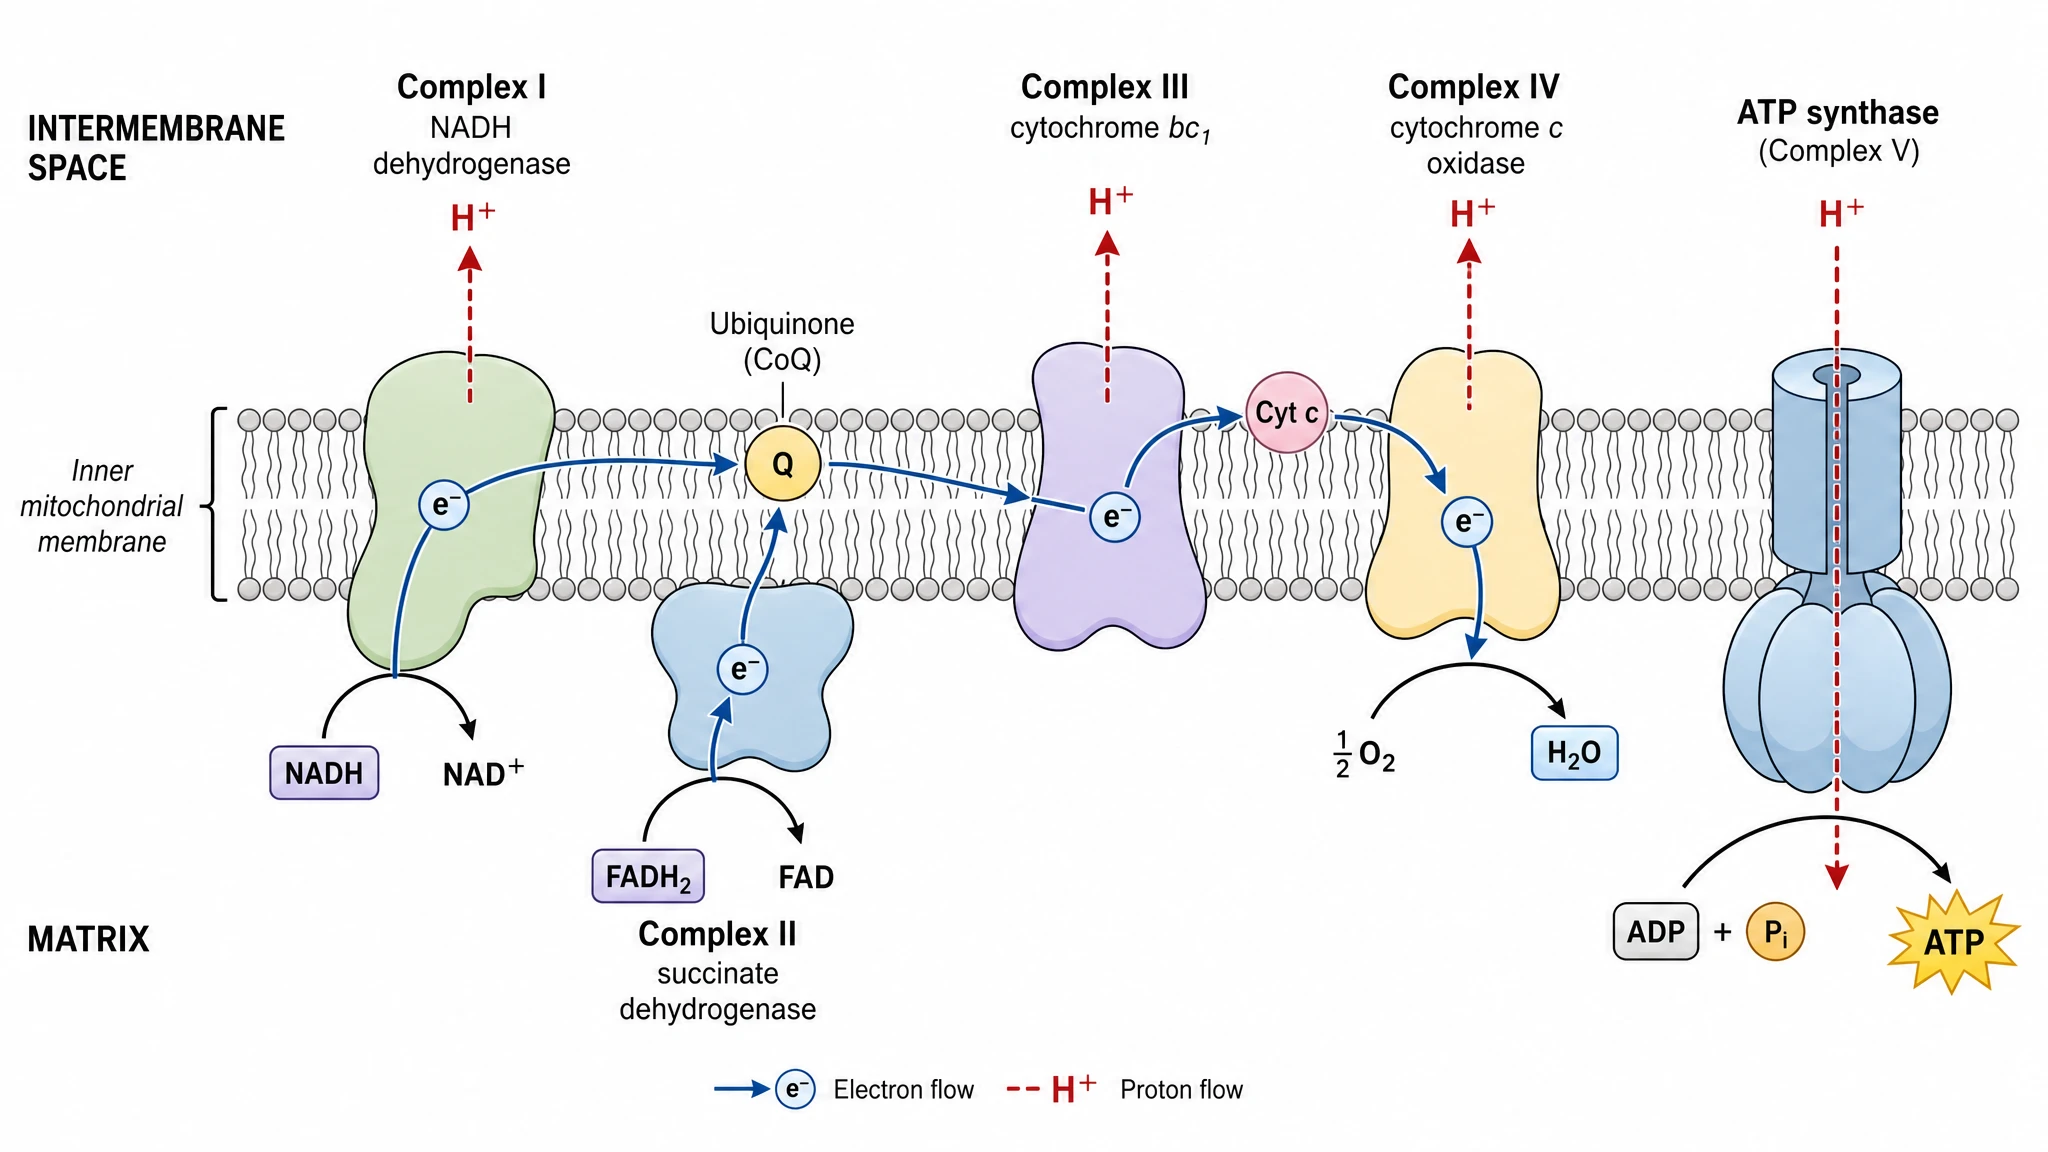
Draw all four complexes in the correct order
The hardest part of this figure is getting the membrane topology right. SciFig's electron transport chain diagram generator places Complex I through Complex IV in sequence along the inner membrane, with ubiquinone and cytochrome c shuttling between them, so electron flow reads left to right without ambiguity.
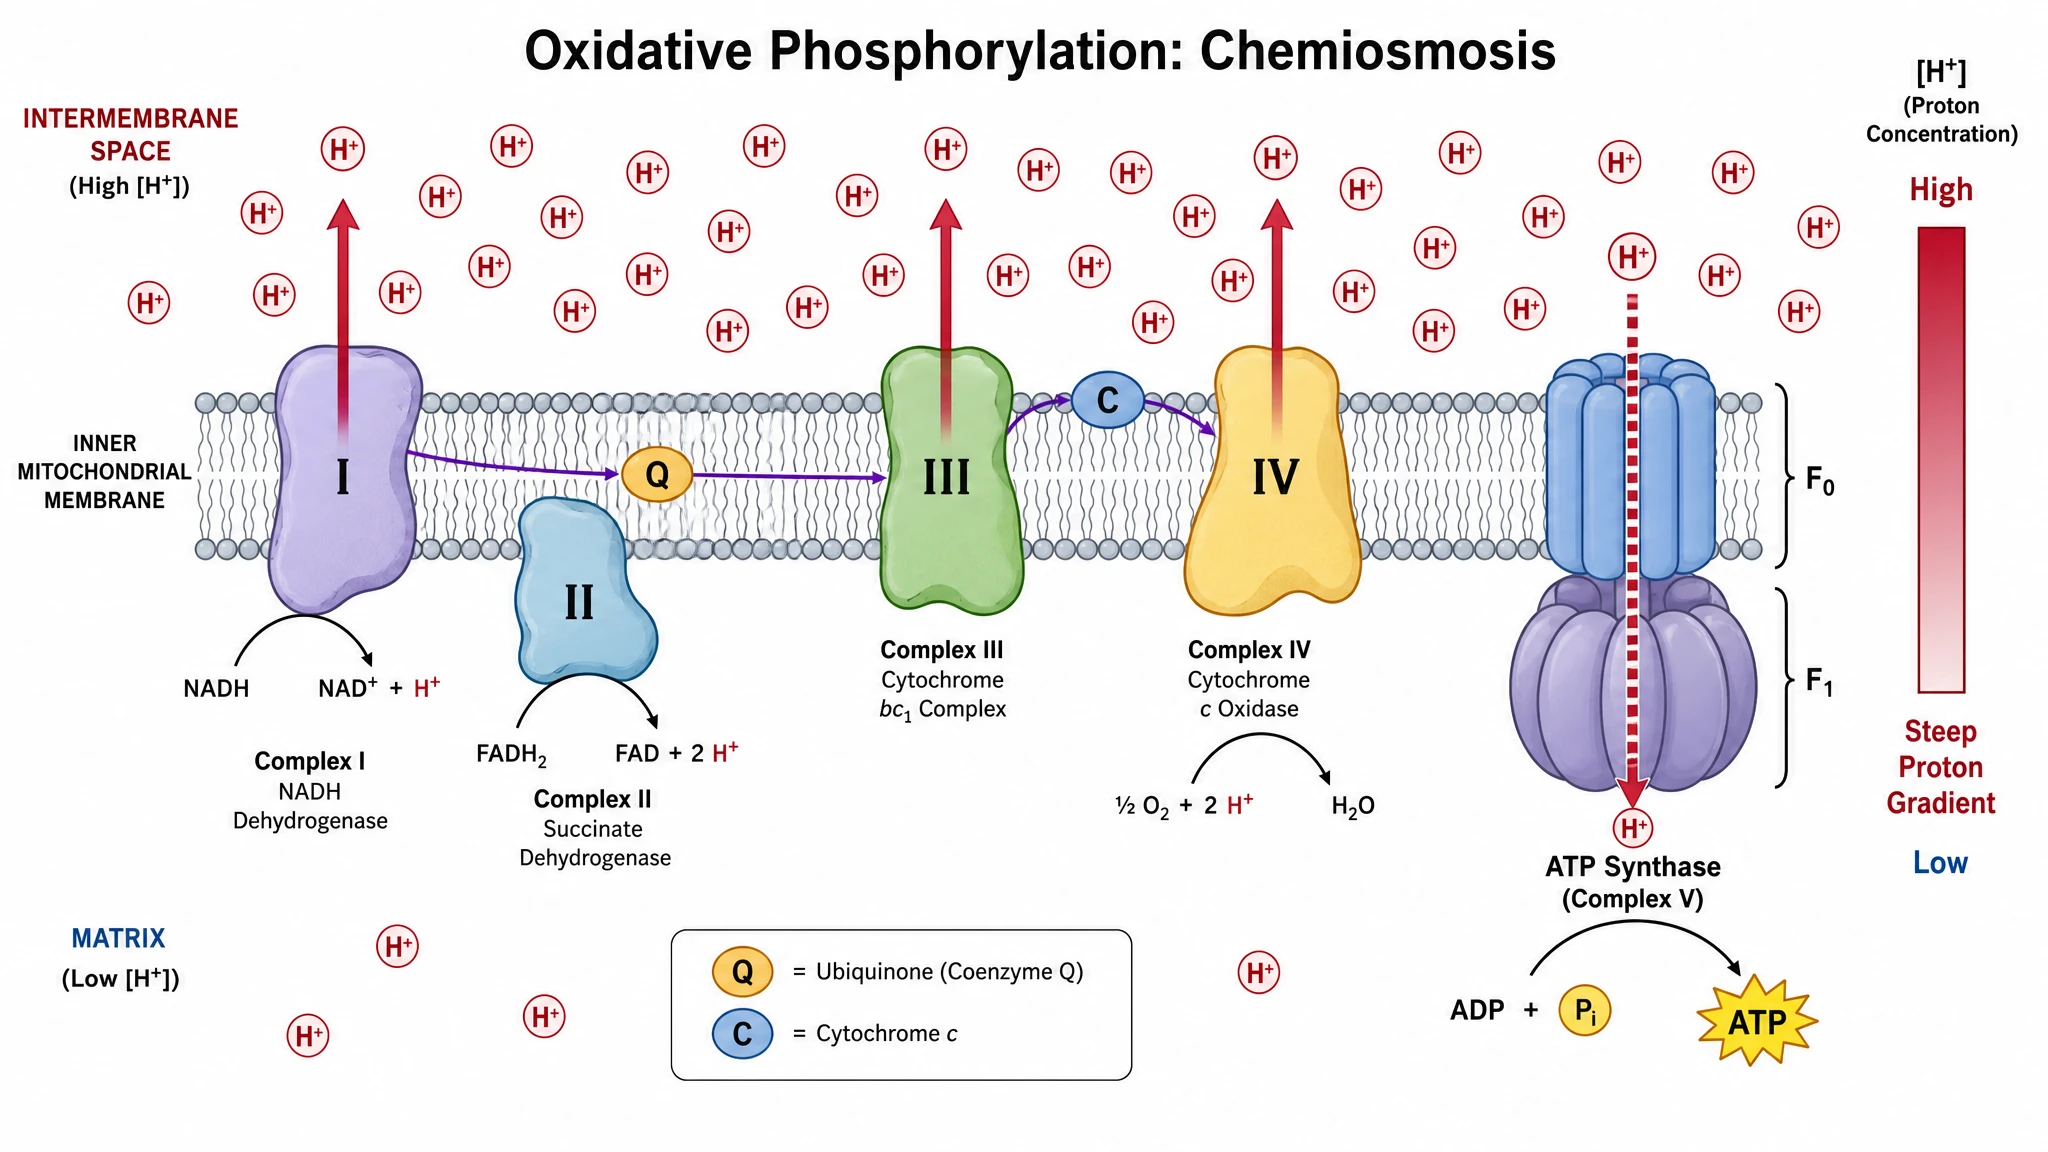
Show the proton gradient and ATP synthase together
A complete oxidative phosphorylation diagram has to connect proton pumping to ATP output. SciFig marks protons moving into the intermembrane space at Complexes I, III, and IV, then shows them returning through ATP synthase — making the chemiosmotic coupling visible instead of implied.
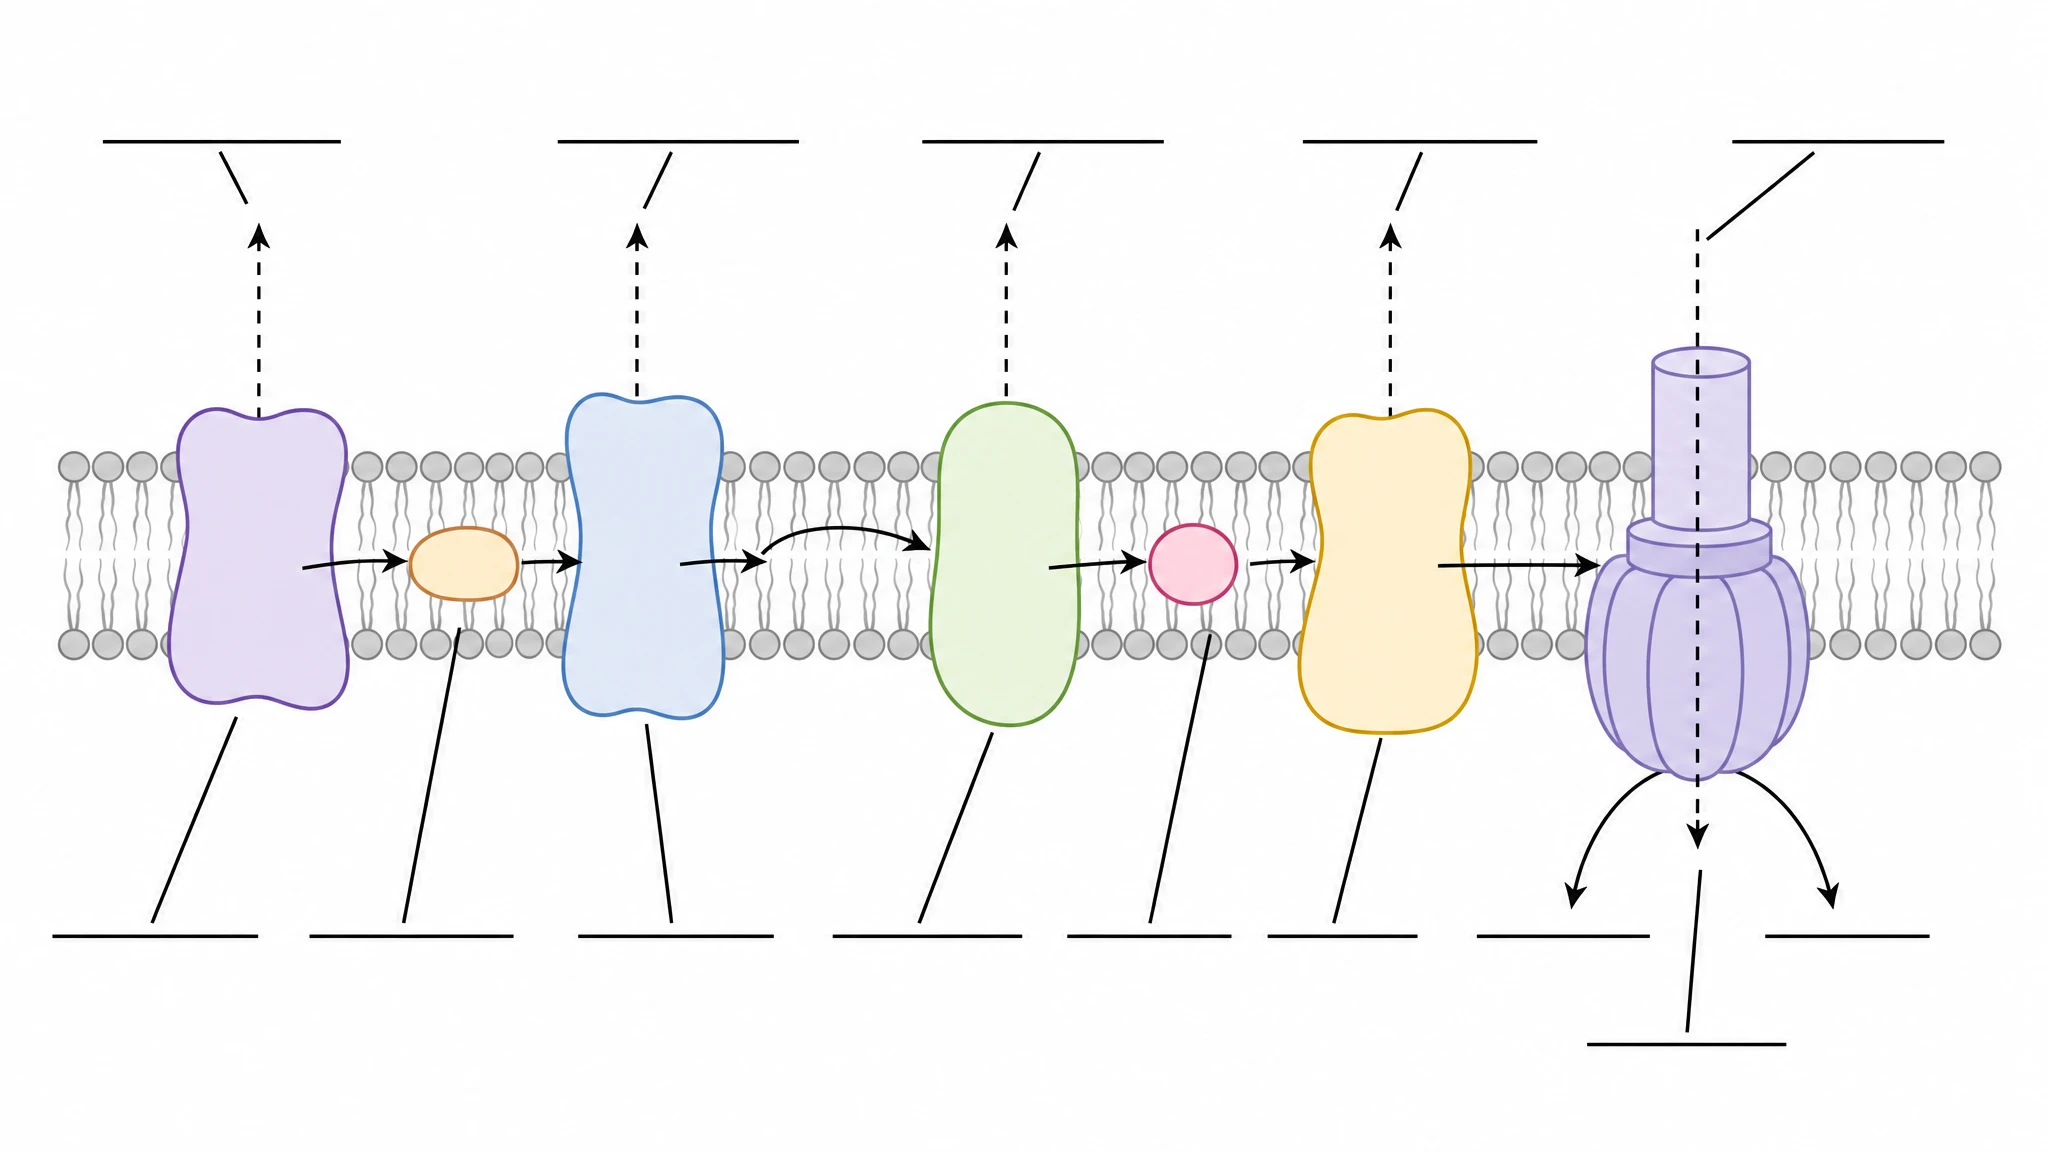
Export labeled or blank versions for teaching
Use a fully labeled electron transport chain diagram in a lecture slide, then export the same figure unlabeled as a worksheet. SciFig keeps the underlying structure identical across both versions, so students practise on exactly the figure they were taught from, at publication resolution.
What is an electron transport chain diagram?
The electron transport chain is the final stage of cellular respiration, where electrons from NADH and FADH2 pass through four protein complexes in the inner mitochondrial membrane. A labeled electron transport chain diagram traces those electrons to oxygen while protons are pumped into the intermembrane space, building the gradient that drives ATP synthase. With SciFig's electron transport chain diagram generator you describe the labels you need and get an accurate figure ready to export.
Why accurate electron transport chain diagrams matter
- Show how electrons from NADH and FADH2 reach oxygen through four membrane complexes
- Make chemiosmosis visible by linking proton pumping to ATP synthase rotation
- Clarify that the chain builds a gradient rather than producing ATP directly
- Required in AP Biology, undergraduate biochemistry, and metabolism courses
- Explain why oxygen is essential as the final electron acceptor
- Support figures on mitochondrial disease, uncouplers, and bioenergetics research
Key components of an electron transport chain diagram
- Complex I (NADH dehydrogenase) — accepts electrons from NADH and pumps protons
- Complex II (succinate dehydrogenase) — feeds in electrons from FADH2 without pumping protons
- Ubiquinone (coenzyme Q) — a mobile carrier shuttling electrons to Complex III
- Complex III and cytochrome c — pass electrons onward and pump further protons
- Complex IV (cytochrome c oxidase) — reduces oxygen to water at the end of the chain
- ATP synthase — the rotary enzyme that converts the proton gradient into ATP
- Inner mitochondrial membrane — the cross-section separating matrix from intermembrane space
Where electron transport chain diagrams are used
- AP Biology and IB lessons on how cells finish releasing energy from glucose
- University biochemistry and cell metabolism lecture slides
- Textbooks, revision guides, and fill-in-the-blank worksheets
- Research figures on mitochondrial dysfunction and bioenergetics
- Posters covering oxidative stress, uncoupling agents, and ATP production
- Student presentations and exam preparation materials
How to make an electron transport chain diagram
Describe your electron transport chain diagram
Tell SciFig what to draw in plain language — no design tools required.
Generate with SciFig
Get a clean, publication-ready figure that matches your description in seconds.
Edit & export
Vectorize it into editable SVG, relabel everything, and export for your paper, poster, or slides.
Free Electron Transport Chain Diagram Generator — Frequently Asked Questions
Common questions about Free Electron Transport Chain Diagram Generator.
More tools
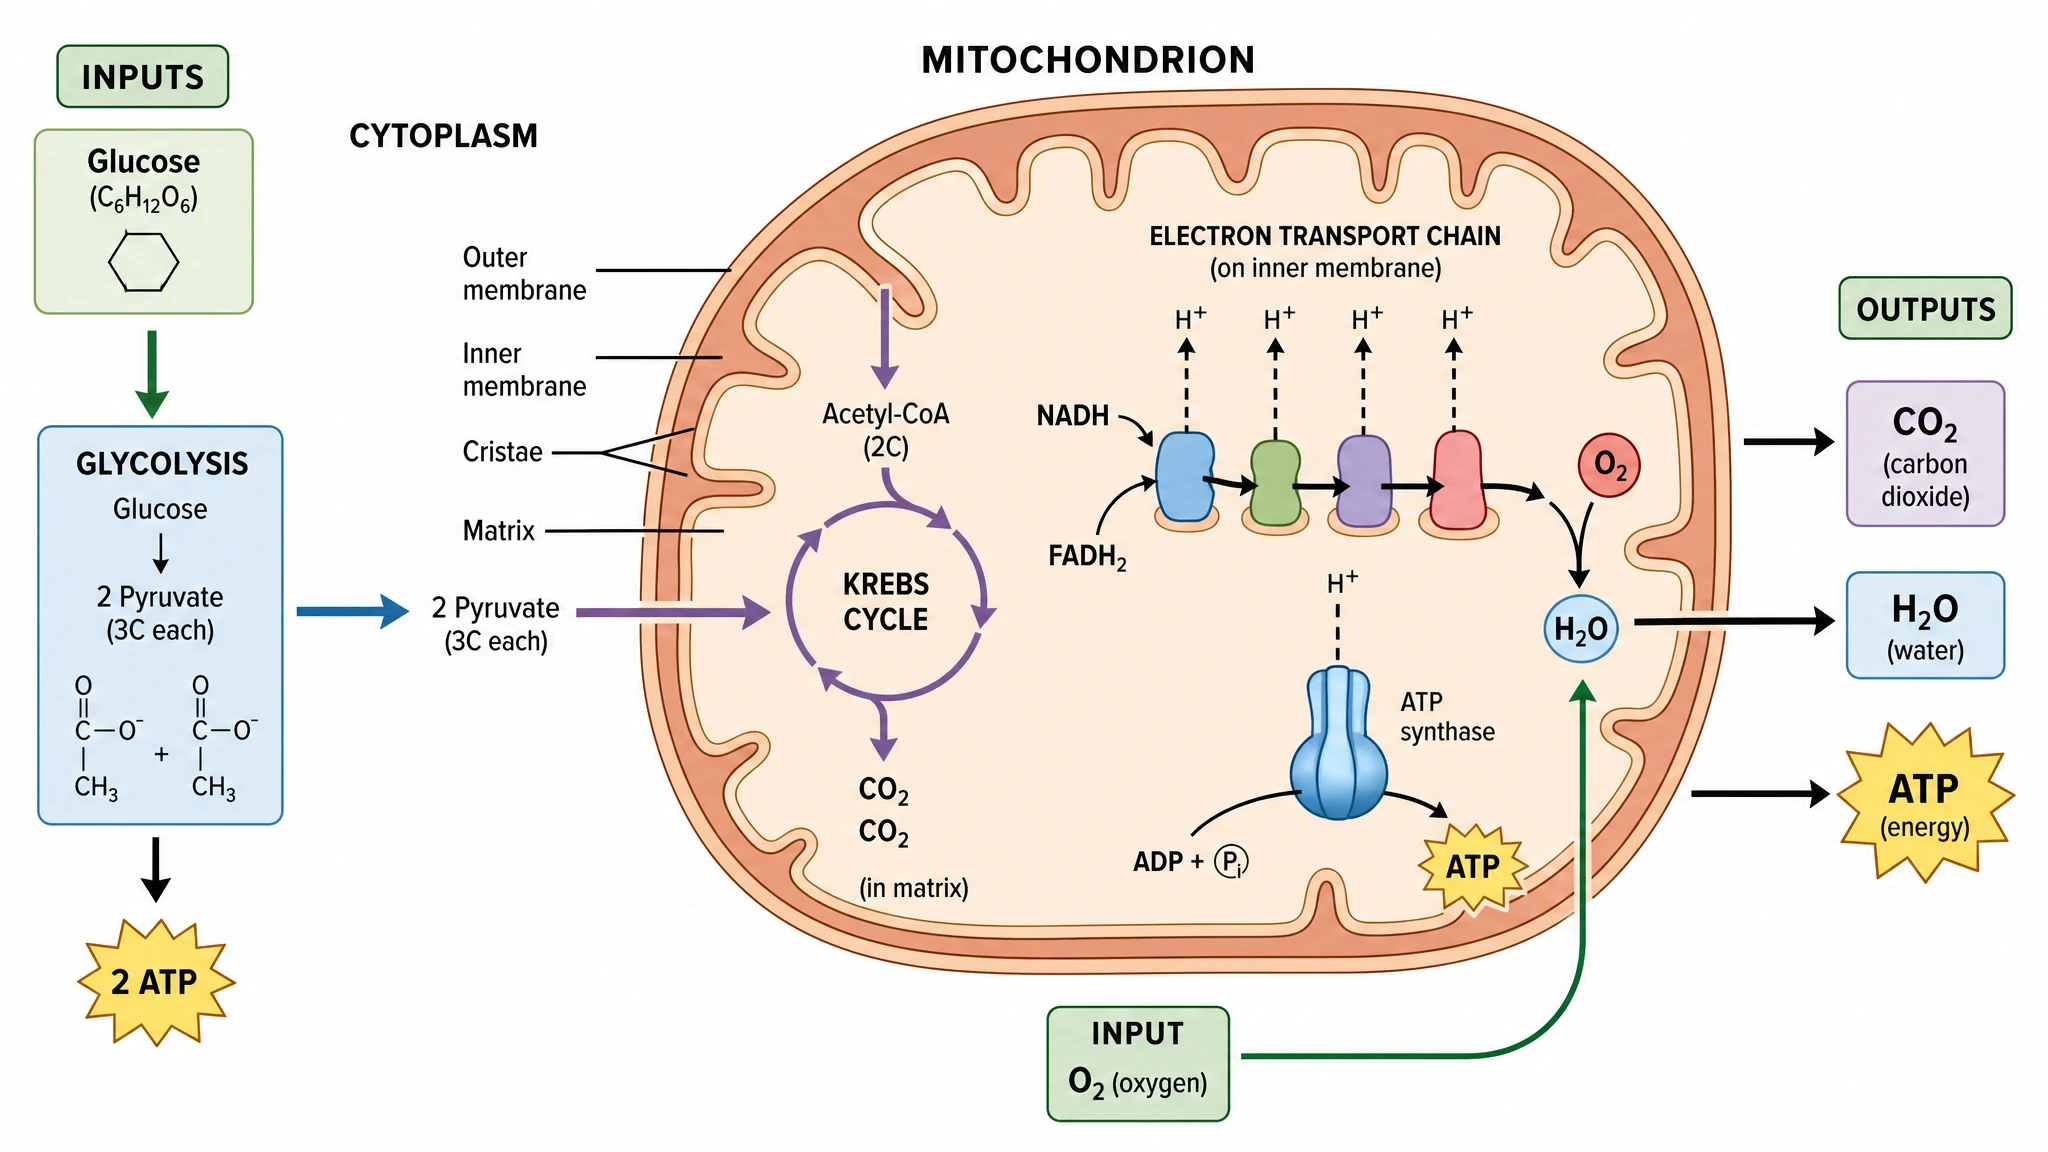
Cellular Respiration Diagram Generator
Map glycolysis, Krebs, and the ETC
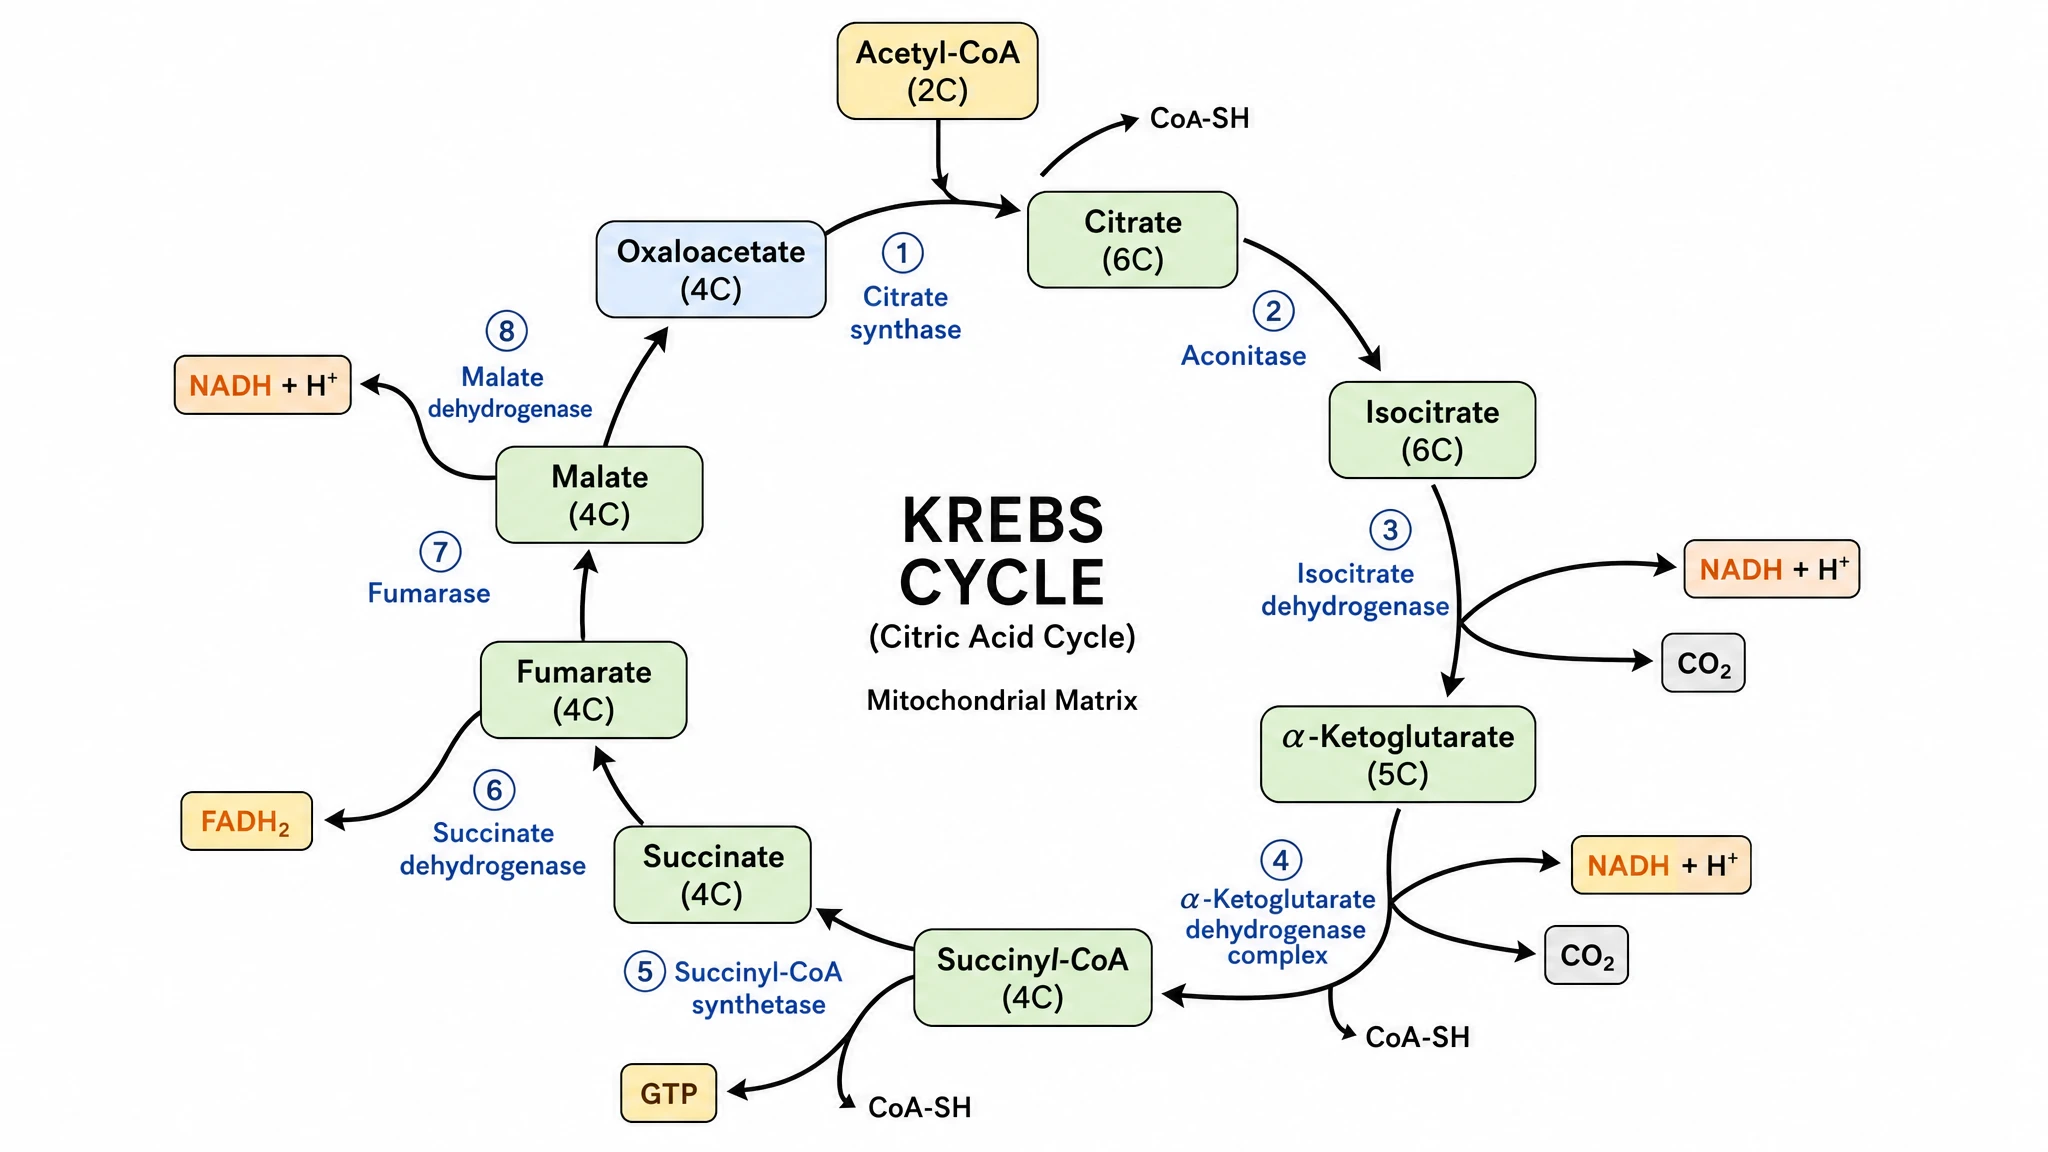
Krebs Cycle Diagram Generator
Diagram the citric acid cycle steps
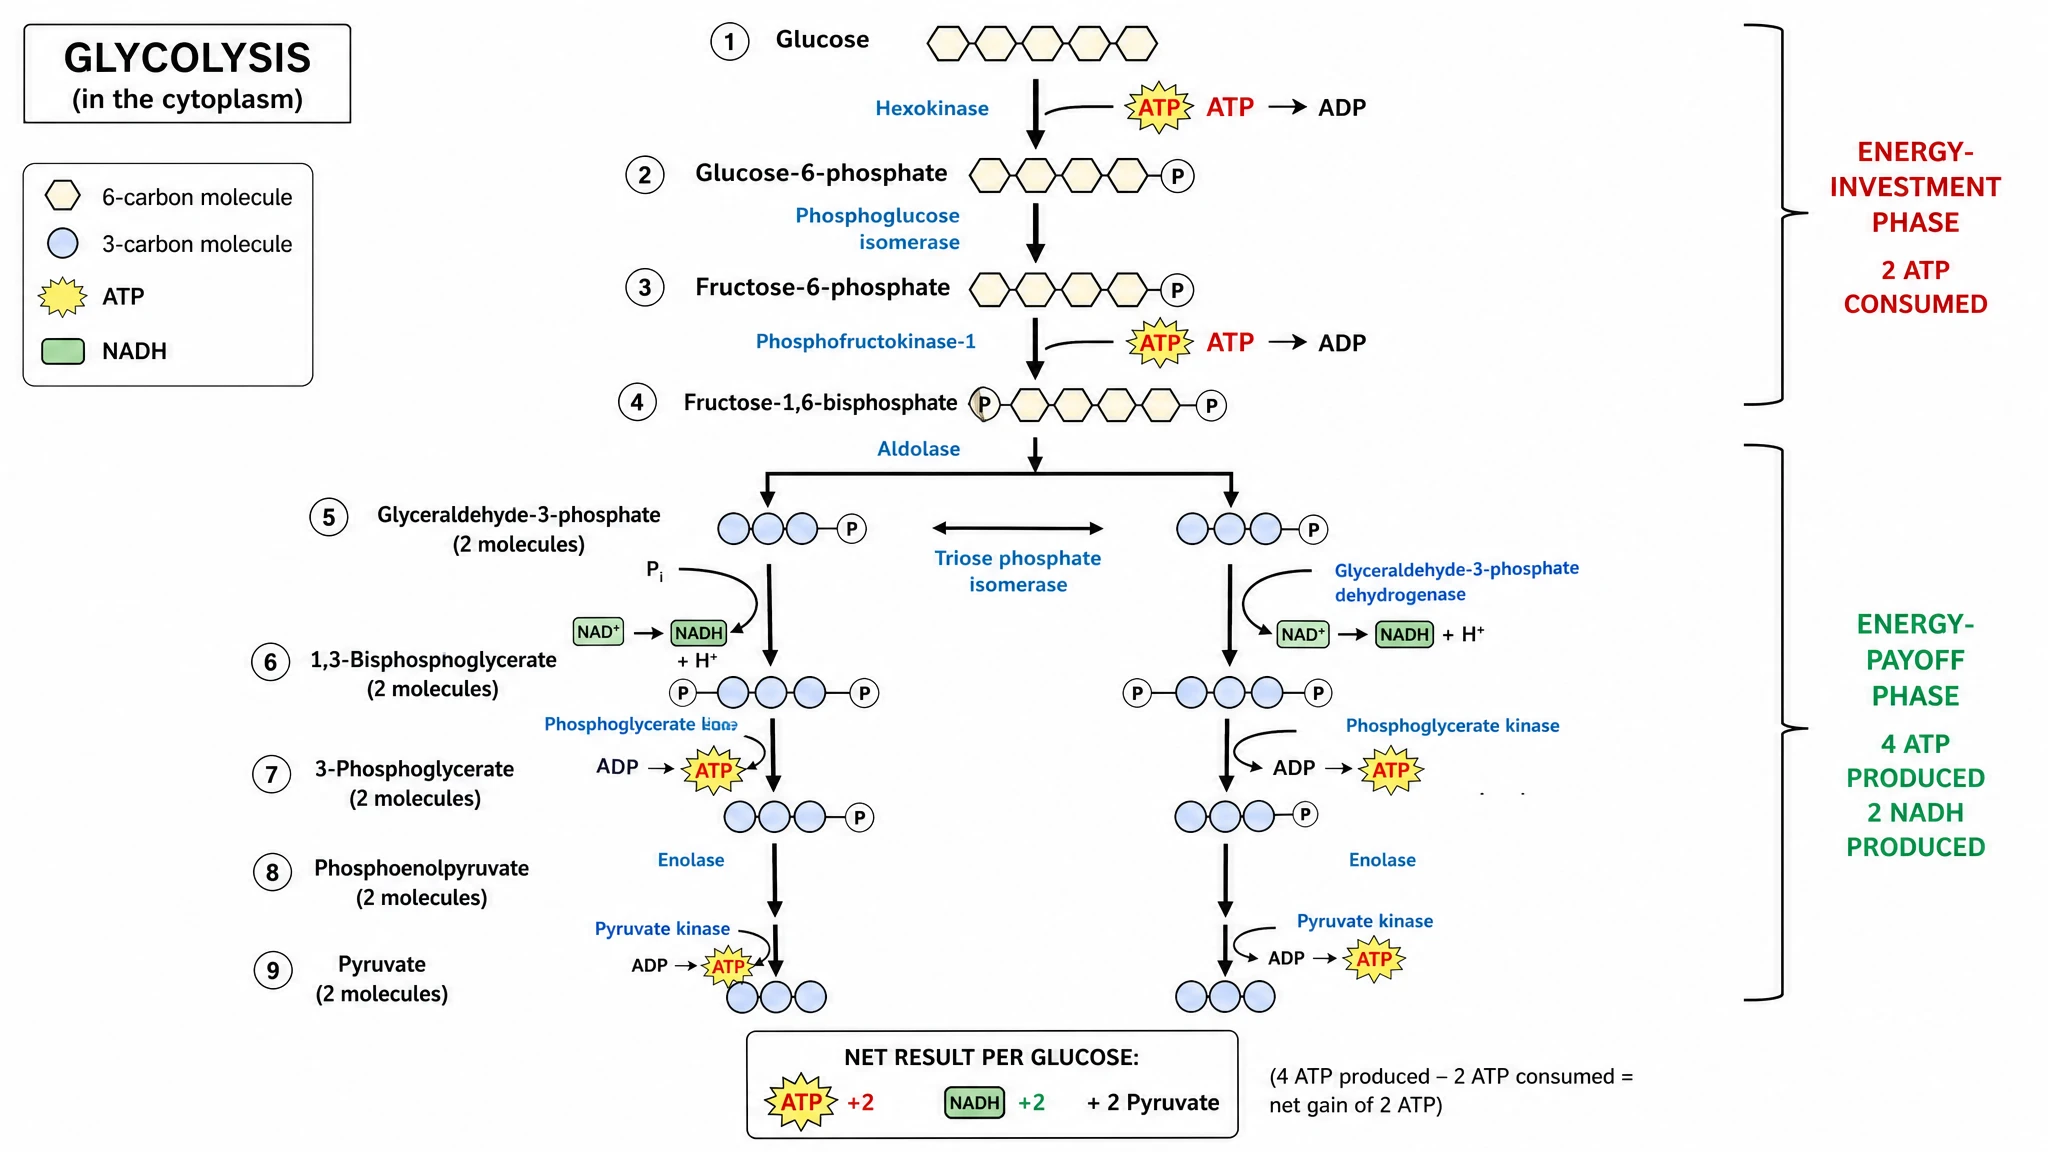
Glycolysis Diagram Generator
Break glucose down into pyruvate
SciFig
Free AI Scientific Figure Generator for Illustrations, Images, Charts and Flowcharts
Models
Default to GPT Image 2 for journal papers; switch to Nano Banana Pro for slides and posters; pick Nano Banana 2.1 for routine figure work
Tutorials
Seven short walkthroughs of the AI scientific figure generator
Blog
Tutorials, tool comparisons, and publication tips for researchers.
Inspiration
Explore publication-ready illustrations, charts and flowcharts. Copy a prompt or open any template as the starting point for your own figure.
Pricing
View pricing

Ready to publish?
Make your own electron transport chain diagram in minutes.
Start for freeFree to start · No credit card required · Built for researchers