Heatmap Generator
Turn your data matrix into a clear scientific heatmap — correlation matrices, gene expression profiles, or spatial density maps — editable and export-ready for publication.
Figure prompt
Core Subject (e.g., Cas9 protein cutting DNA)
Action / Details (e.g., Double strand break, detailed molecular view)
Start with 100 free credits|No credit card required
Get up to 300 free credits on day one when you join through an invite.
Reviewed by SciFig TeamUpdated
Heatmap Generator— templates & examples
Everything you need to build your scientific heatmap
Generate a heatmap from any data matrix description
Describe your matrix — dimensions, data type, value range, and row and column labels — and SciFig's heatmap generator produces a color-encoded scientific heatmap instantly. The tool selects an appropriate color scale based on your data type and renders the heatmap at publication resolution, ready to edit or export.
Correct color scales for scientific data
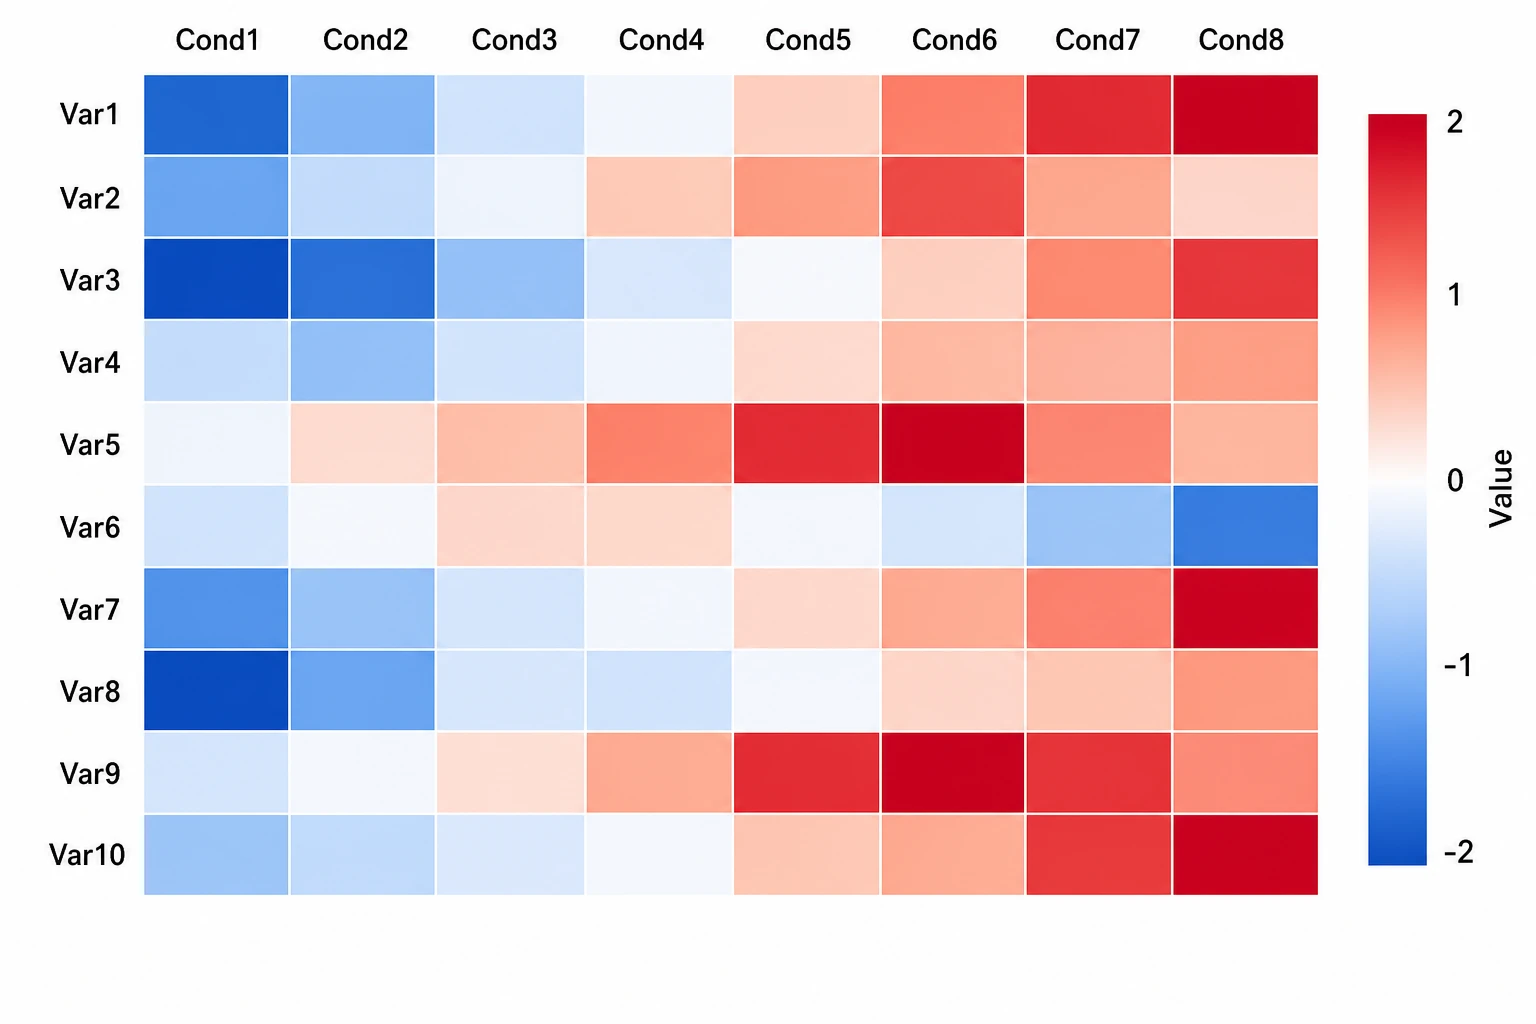
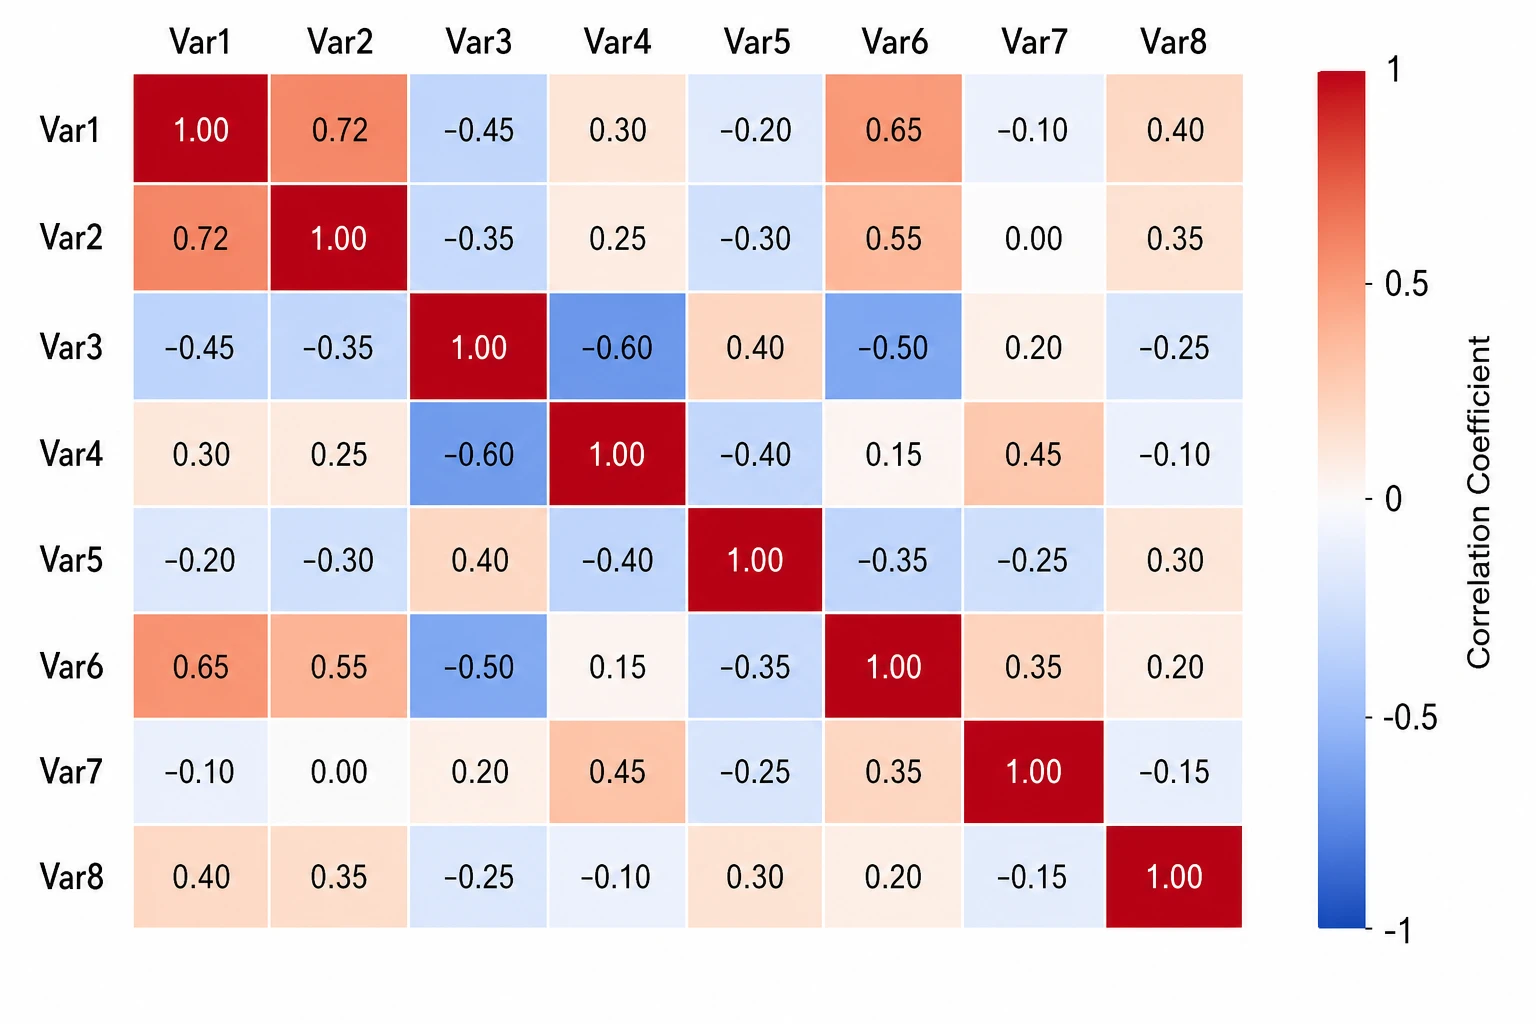
SciFig's scientific heatmap generator applies sequential scales for count and concentration data and diverging scales for correlation or fold-change data — the color encoding conventions expected in life science and data science publications. Customize the scale range, midpoint, and color endpoints to match your data and journal requirements.
Add clustering, labels, and annotations
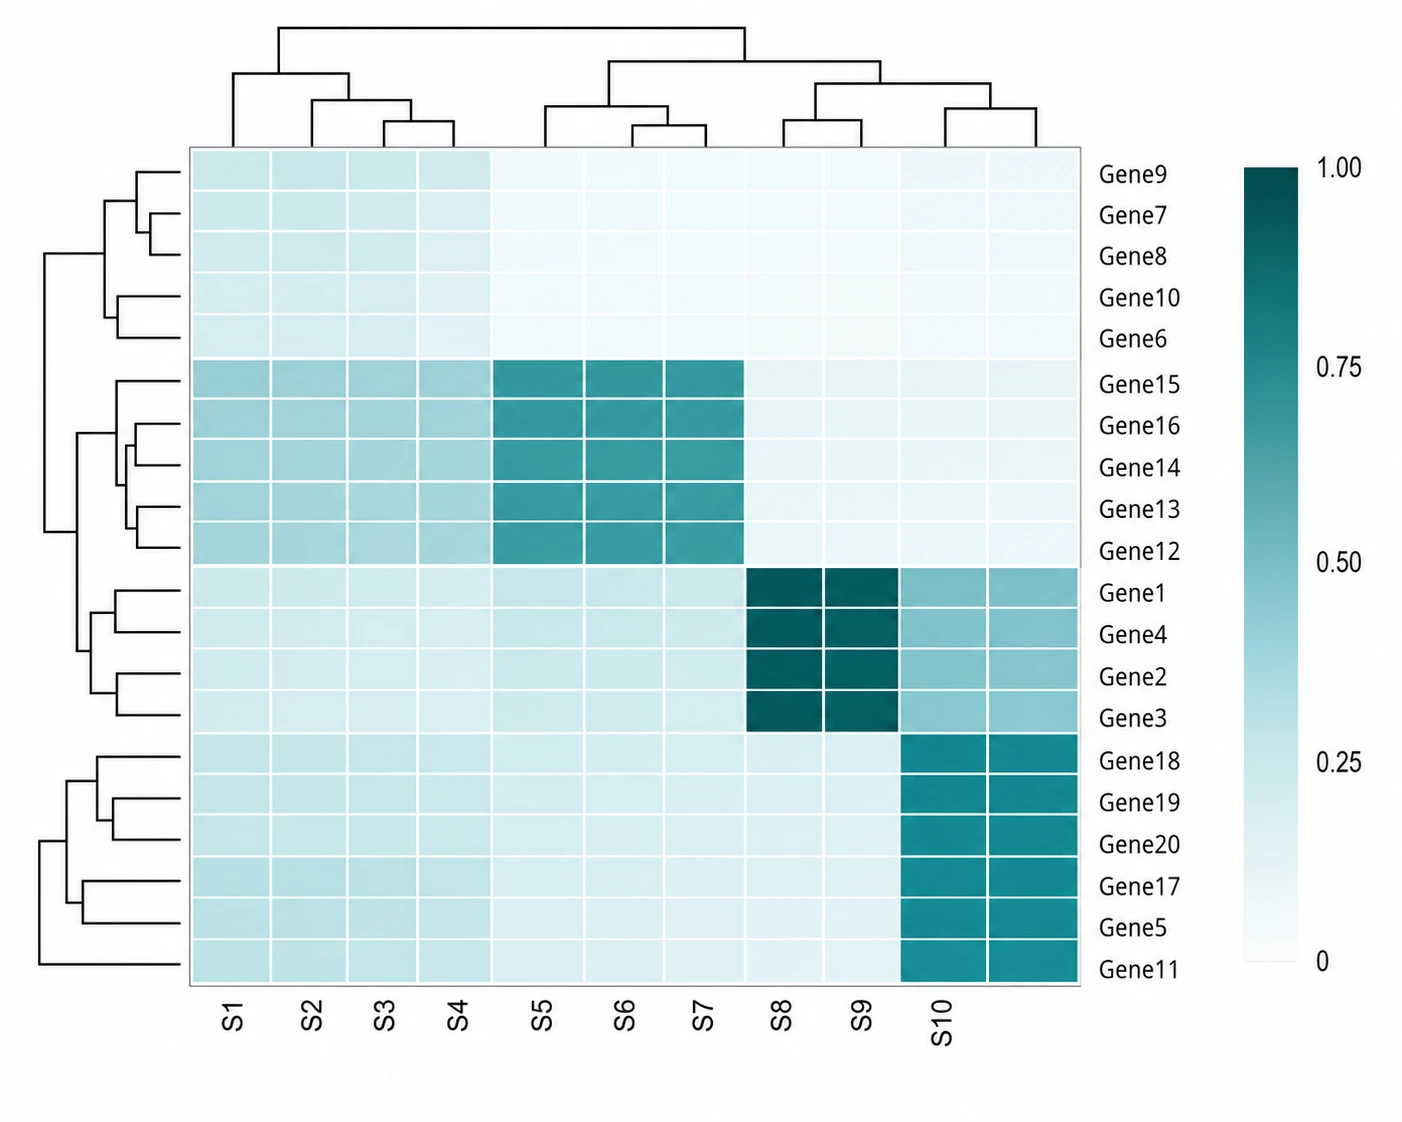
Enhance your heatmap with hierarchical clustering dendrograms along rows, columns, or both — revealing groupings in your data without additional analysis software. Add row and column labels, a color bar legend, annotations on selected cells, and a descriptive title so the heatmap figure is fully self-contained for publication.
What is a heatmap?
A heatmap is a data visualization where matrix values are encoded as colors, making patterns, gradients, and clusters immediately visible across correlation matrices, gene expression profiles, and spatial datasets. Scientific heatmaps are standard in omics, ecology, and neuroscience. With SciFig's heatmap generator you describe your data structure, value range, and color scale and receive a labeled, publication-ready figure with optional clustering dendrograms.
Why heatmaps are essential in scientific data visualization
- Encodes an entire data matrix into a single figure that reveals patterns at a glance
- Standard figure format in omics, ecology, neuroscience, and climate science publications
- Scales to large matrices — hundreds of rows and columns — that line charts cannot display
- Clustering dendrograms reveal natural groupings in data without requiring separate figures
- Color gradients communicate value magnitude more efficiently than tables of numbers
- Diverging color scales make above-zero and below-zero values immediately distinguishable
Key components of a scientific heatmap
- Color-encoded cells — a grid where each cell's color represents its numerical value
- Color bar — a legend mapping colors to numerical values along the scale range
- Row labels — identifiers for each row (e.g., gene names, sample IDs, species)
- Column labels — identifiers for each column (e.g., conditions, time points, variables)
- Dendrograms — hierarchical clustering trees attached to rows or columns to show groupings
- Annotations — text or symbol overlays on selected cells indicating significance or category
Where scientific heatmaps are used in research
- Genomics and transcriptomics: gene expression profiles across samples and conditions
- Proteomics and metabolomics: abundance matrices for high-throughput mass spectrometry data
- Ecology: species-by-site abundance matrices and biodiversity data visualization
- Neuroscience: neural activity matrices and connectivity correlation heatmaps
- Climate science: spatial temperature or precipitation anomaly maps encoded as heatmaps
- Statistics and data science: correlation matrices, confusion matrices, and covariance heatmaps
How to make a heatmap
Describe your heatmap
Tell SciFig what to draw in plain language — no design tools required.
Generate with SciFig
Get a clean, publication-ready figure that matches your description in seconds.
Edit & export
Vectorize it into editable SVG, relabel everything, and export for your paper, poster, or slides.
Heatmap Generator — Frequently Asked Questions
Common questions about Heatmap Generator.
More tools

Conceptual Framework Generator
Create professional conceptual framework diagrams showing variable relationships, hypotheses, and theoretical models for your research.

Free Body Diagram Generator
Create accurate, publication-ready free body diagrams with labeled force vectors for weight, normal force, friction, and tension in seconds.

Bell Curve Generator
Generate a precise, fully labeled bell curve showing mean, standard deviations, and percentile regions — ready to export for your paper, thesis, or classroom.
Related links
Home
Turn text, sketches, references, PDFs, and photos into Scientific Figures
Text-to-Figure
Generate a figure from a plain-language description
Models
Default to GPT Image 2 for journal papers; switch to Nano Banana Pro for slides and posters; pick Nano Banana 2 for routine figure work
Tutorials
Seven short walkthroughs of the AI scientific figure generator
Blog
Tutorials, tool comparisons, and publication tips for researchers.
Inspiration
Explore publication-ready scientific figure examples, copy the prompts, and use them as starting points for your own work.

Ready to publish?
Make your own heatmap in minutes.
Start for freeFree to start · No credit card required · Built for researchers