PRISMA Flow Diagram Generator
Create a clean, publication-ready PRISMA flow diagram with identification, screening, eligibility, and included stages, exact record counts, and exclusion reasons.
Figure prompt
Core Subject (e.g., Cas9 protein cutting DNA)
Action / Details (e.g., Double strand break, detailed molecular view)
Start with 100 free credits|No credit card required
Get up to 300 free credits on day one when you join through an invite.
Reviewed by SciFig TeamUpdated
PRISMA Flow Diagram Generator— templates & examples
Everything you need to build your PRISMA flow diagram
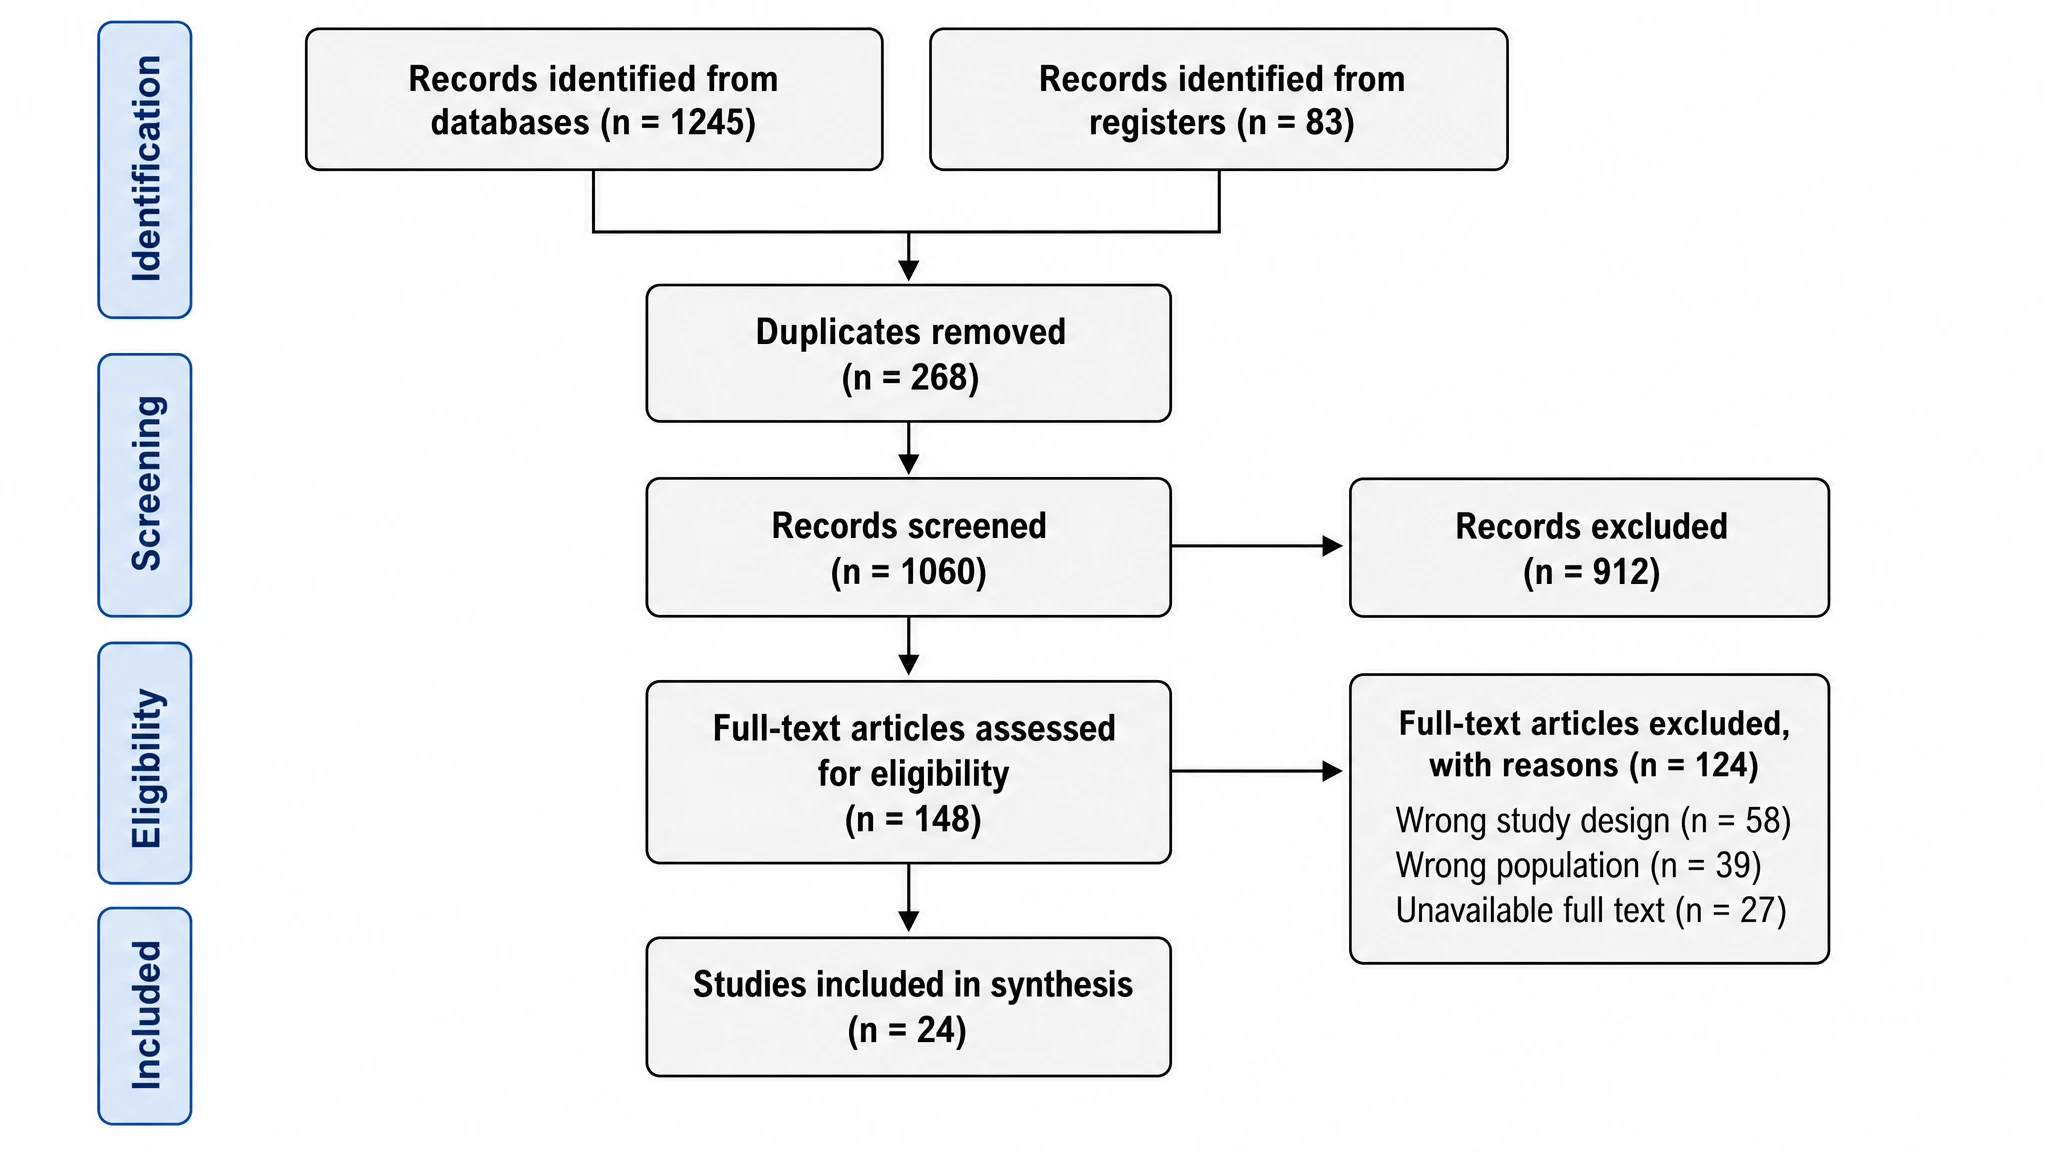
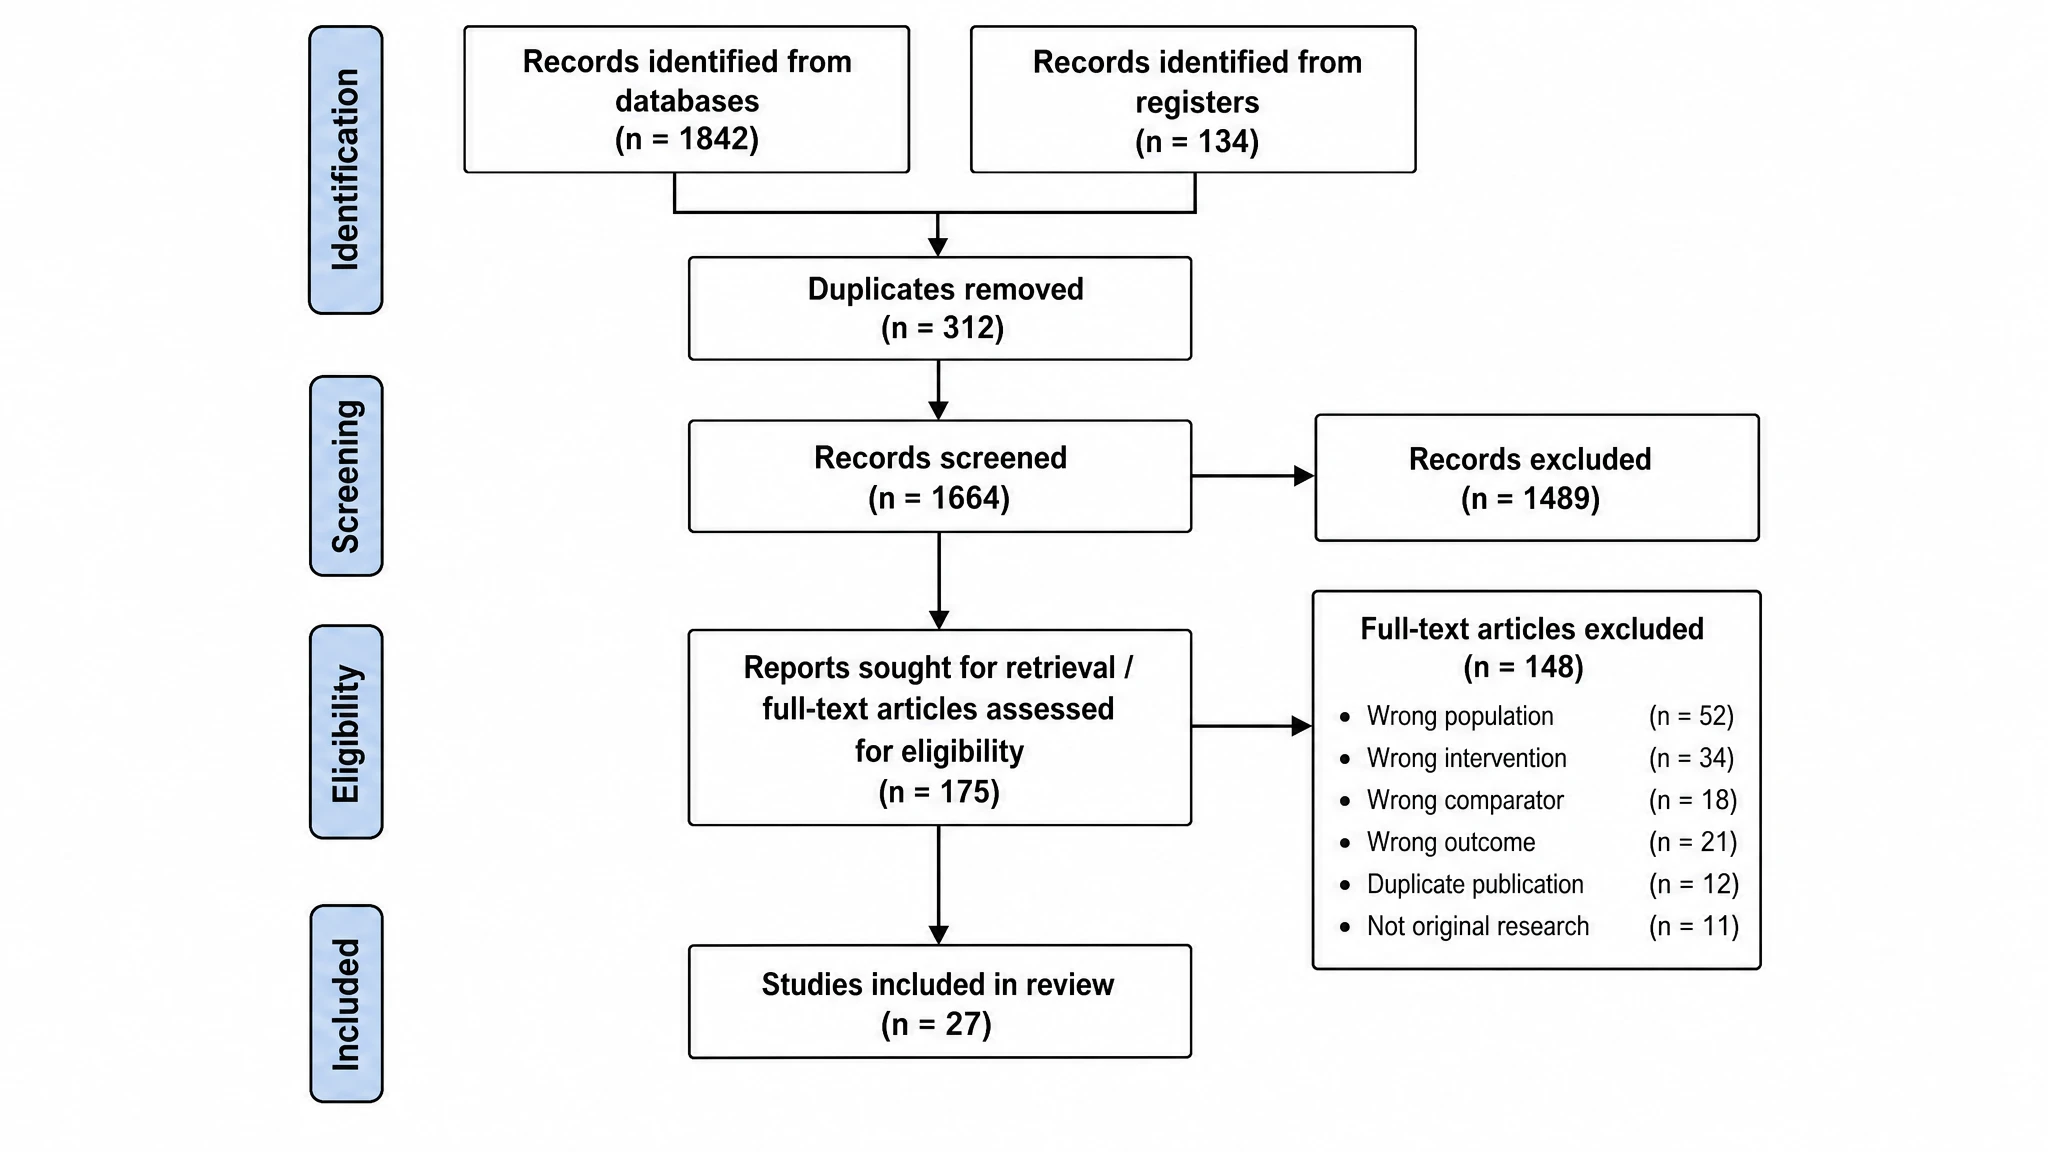
Four-stage PRISMA 2020 layout with record counts
A compliant PRISMA flow diagram must track records through identification, screening, eligibility, and included — with exact counts at each transition. SciFig's PRISMA flow diagram generator renders all four stages in the correct vertical sequence, places your record counts in every box, and adds the PRISMA 2020 dual-track identification row (databases plus registers) so your diagram meets current reporting standards without manual formatting. It behaves as a PRISMA 2020 flow diagram generator by default, so you never have to retrofit a legacy single-source identification box after a reviewer flags it.
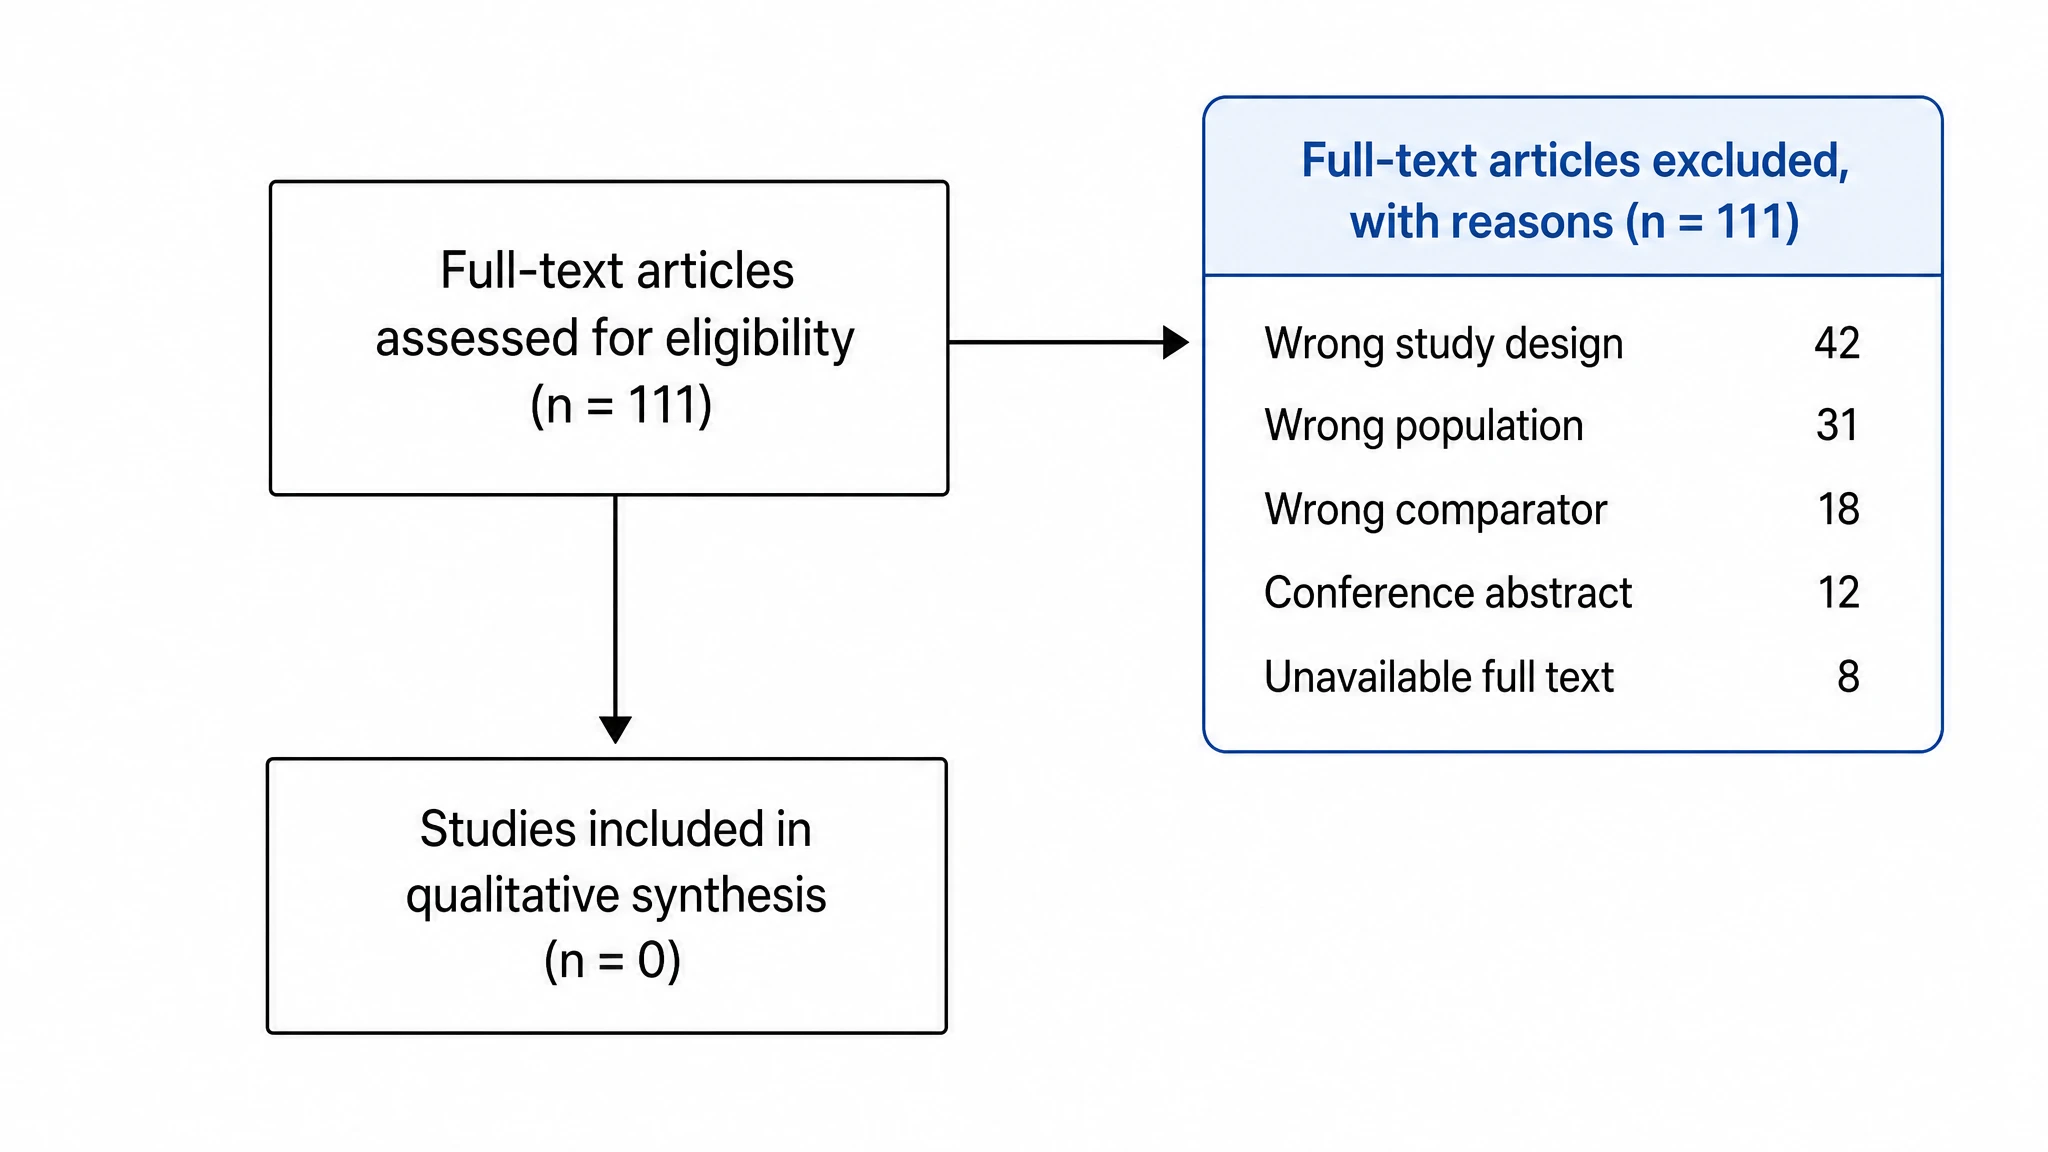
Exclusion reasons and side boxes in one step
Journal reviewers look for clearly labeled exclusion-reasons boxes beside the screening and eligibility stages. List your reasons and counts in plain language — wrong study design, wrong population, unavailable full text — and SciFig's PRISMA diagram maker places each reason in a correctly positioned side box with an arrow, matching the layout required by EQUATOR-compliant journals. No manual positioning or drawing required.
Export a publication-ready figure for any journal
Once your PRISMA flow chart builder output is ready, export a high-resolution image in the format your target journal requires. Relabel any box, adjust font size, recolor borders, and resize for a two-column or full-page layout. SciFig saves your diagram so you can update record counts as your search is updated and regenerate a clean PRISMA flow diagram for each submission revision.
What is a PRISMA flow diagram?
A PRISMA flow diagram is the standardized flowchart required in systematic reviews and meta-analyses to document how studies were identified, screened, assessed for eligibility, and included. Following PRISMA 2020 guidelines, it traces records from database and register searches through deduplication and full-text screening, with exact counts and exclusion reasons at each stage. SciFig's PRISMA flow diagram generator turns your screening numbers into an editable, journal-ready diagram.
Why every systematic review needs a PRISMA flow diagram
- Required by PRISMA 2020 checklist item 16a for transparent reporting of study selection
- Allows readers and peer reviewers to audit the search and selection process at a glance
- Demonstrates methodological rigor and compliance with EQUATOR Network guidelines
- Satisfies submission requirements at Cochrane, The BMJ, JAMA, The Lancet, and PLOS Medicine
- Provides a traceable record of how many studies were identified, screened, and excluded at each stage
- Supports replication and future updates by documenting every decision point in the review
Key components of a PRISMA 2020 flow diagram
- Identification stage — separate boxes for records from databases, registers, and other methods (citation searching, grey literature, expert contacts), with duplicates removed
- Screening stage — number of records screened after deduplication and number excluded at title-and-abstract review with reasons
- Eligibility stage — number of full-text articles assessed and a side box listing each exclusion reason with its count
- Included stage — number of studies included in the qualitative synthesis and, if applicable, the number included in the quantitative meta-analysis
- Directional arrows — downward flow between stages showing progression from identification to final inclusion
- Record-count labels — numeric values in every box so readers can trace attrition across the entire selection process
Where PRISMA flow diagrams are used
- Systematic reviews and meta-analyses submitted to peer-reviewed journals
- Cochrane Reviews and Campbell Collaboration reviews
- Scoping reviews following the PRISMA-ScR extension
- Rapid reviews, umbrella reviews, and network meta-analyses
- Thesis and dissertation chapters presenting a systematic literature search
- Grant applications and health technology assessment reports requiring evidence synthesis documentation
How to make a PRISMA flow diagram
Describe your PRISMA flow diagram
Tell SciFig what to draw in plain language — no design tools required.
Generate with SciFig
Get a clean, publication-ready figure that matches your description in seconds.
Edit & export
Vectorize it into editable SVG, relabel everything, and export for your paper, poster, or slides.
PRISMA Flow Diagram Generator — Frequently Asked Questions
Common questions about PRISMA Flow Diagram Generator.
More tools

Conceptual Framework Generator
Create professional conceptual framework diagrams showing variable relationships, hypotheses, and theoretical models for your research.

Free Body Diagram Generator
Create accurate, publication-ready free body diagrams with labeled force vectors for weight, normal force, friction, and tension in seconds.

Bell Curve Generator
Generate a precise, fully labeled bell curve showing mean, standard deviations, and percentile regions — ready to export for your paper, thesis, or classroom.
Related links
Home
Turn text, sketches, references, PDFs, and photos into Scientific Figures
Text-to-Figure
Generate a figure from a plain-language description
Models
Default to GPT Image 2 for journal papers; switch to Nano Banana Pro for slides and posters; pick Nano Banana 2 for routine figure work
Tutorials
Seven short walkthroughs of the AI scientific figure generator
Blog
Tutorials, tool comparisons, and publication tips for researchers.
Inspiration
Explore publication-ready scientific figure examples, copy the prompts, and use them as starting points for your own work.

Ready to publish?
Make your own PRISMA flow diagram in minutes.
Start for freeFree to start · No credit card required · Built for researchers