Graphical Abstract Maker
Generate a publication-ready graphical abstract — a single-panel visual summary that captures your study's methods, key finding, and result with clear icons and flow arrows.
Figure prompt
Core Subject (e.g., Cas9 protein cutting DNA)
Action / Details (e.g., Double strand break, detailed molecular view)
Start with 100 free credits|No credit card required
Get up to 300 free credits on day one when you join through an invite.
Reviewed by SciFig TeamUpdated
Graphical Abstract Maker— templates & examples
Everything you need to create your graphical abstract
Generate a journal-ready panel from a plain-language description
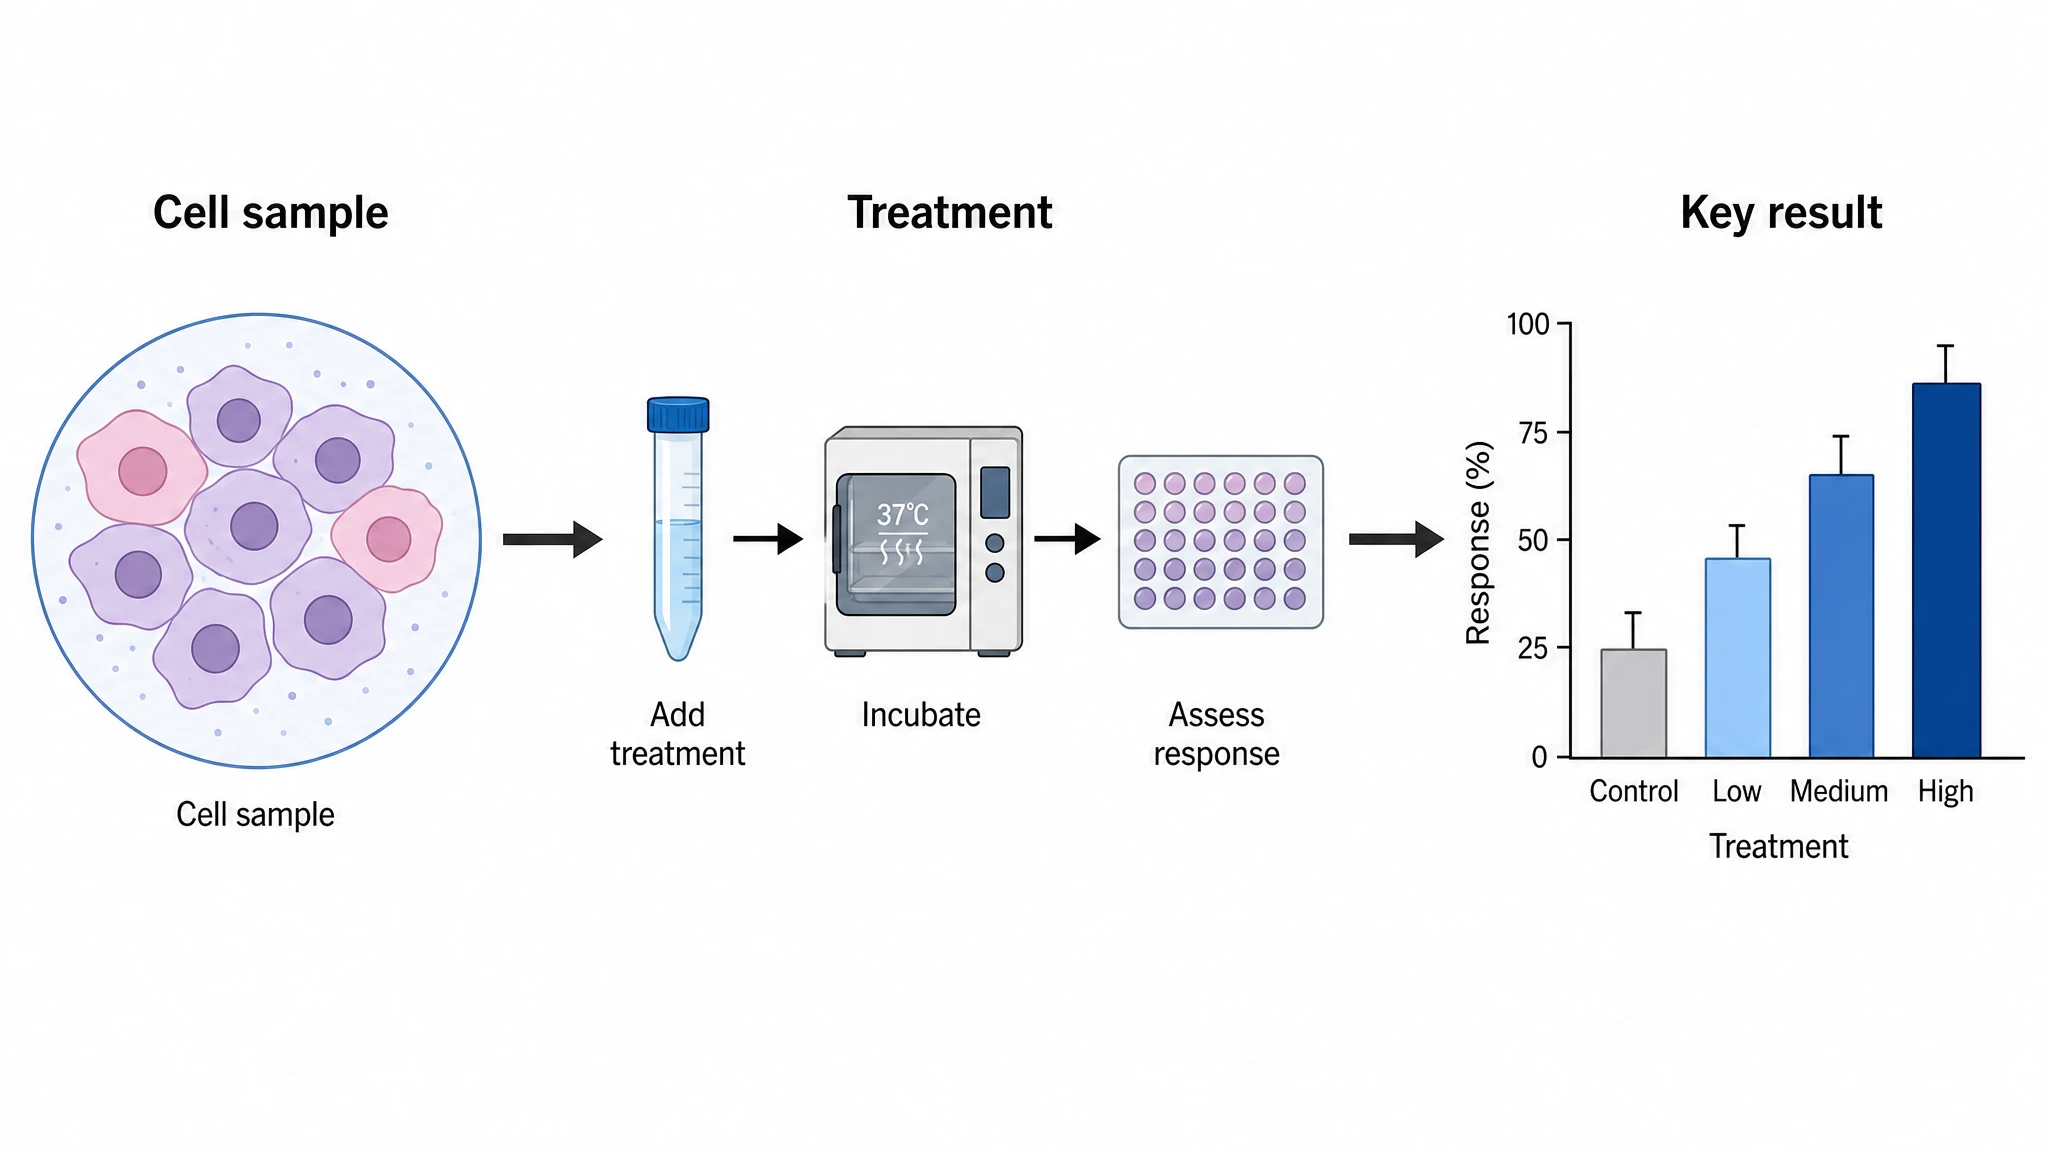
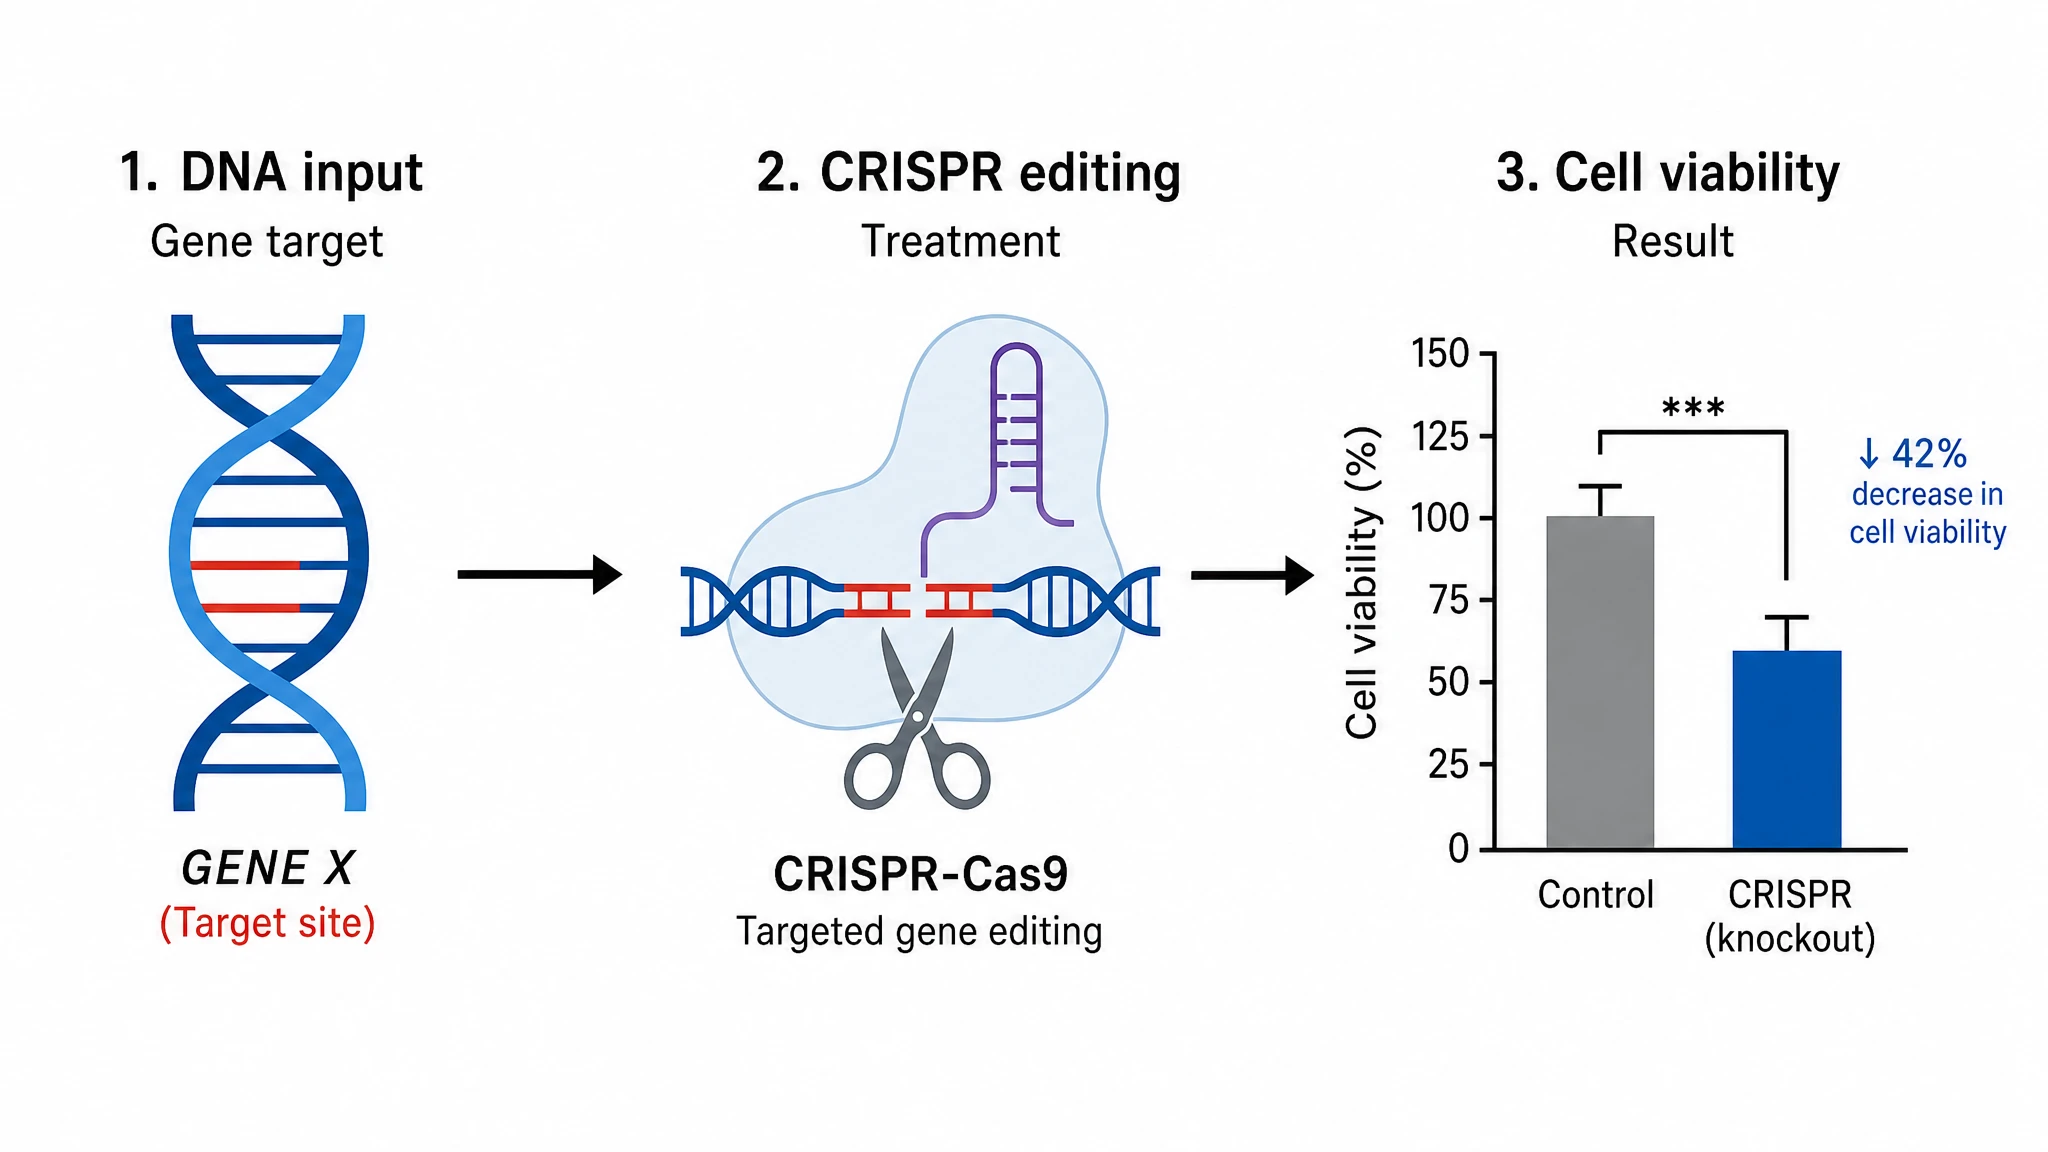
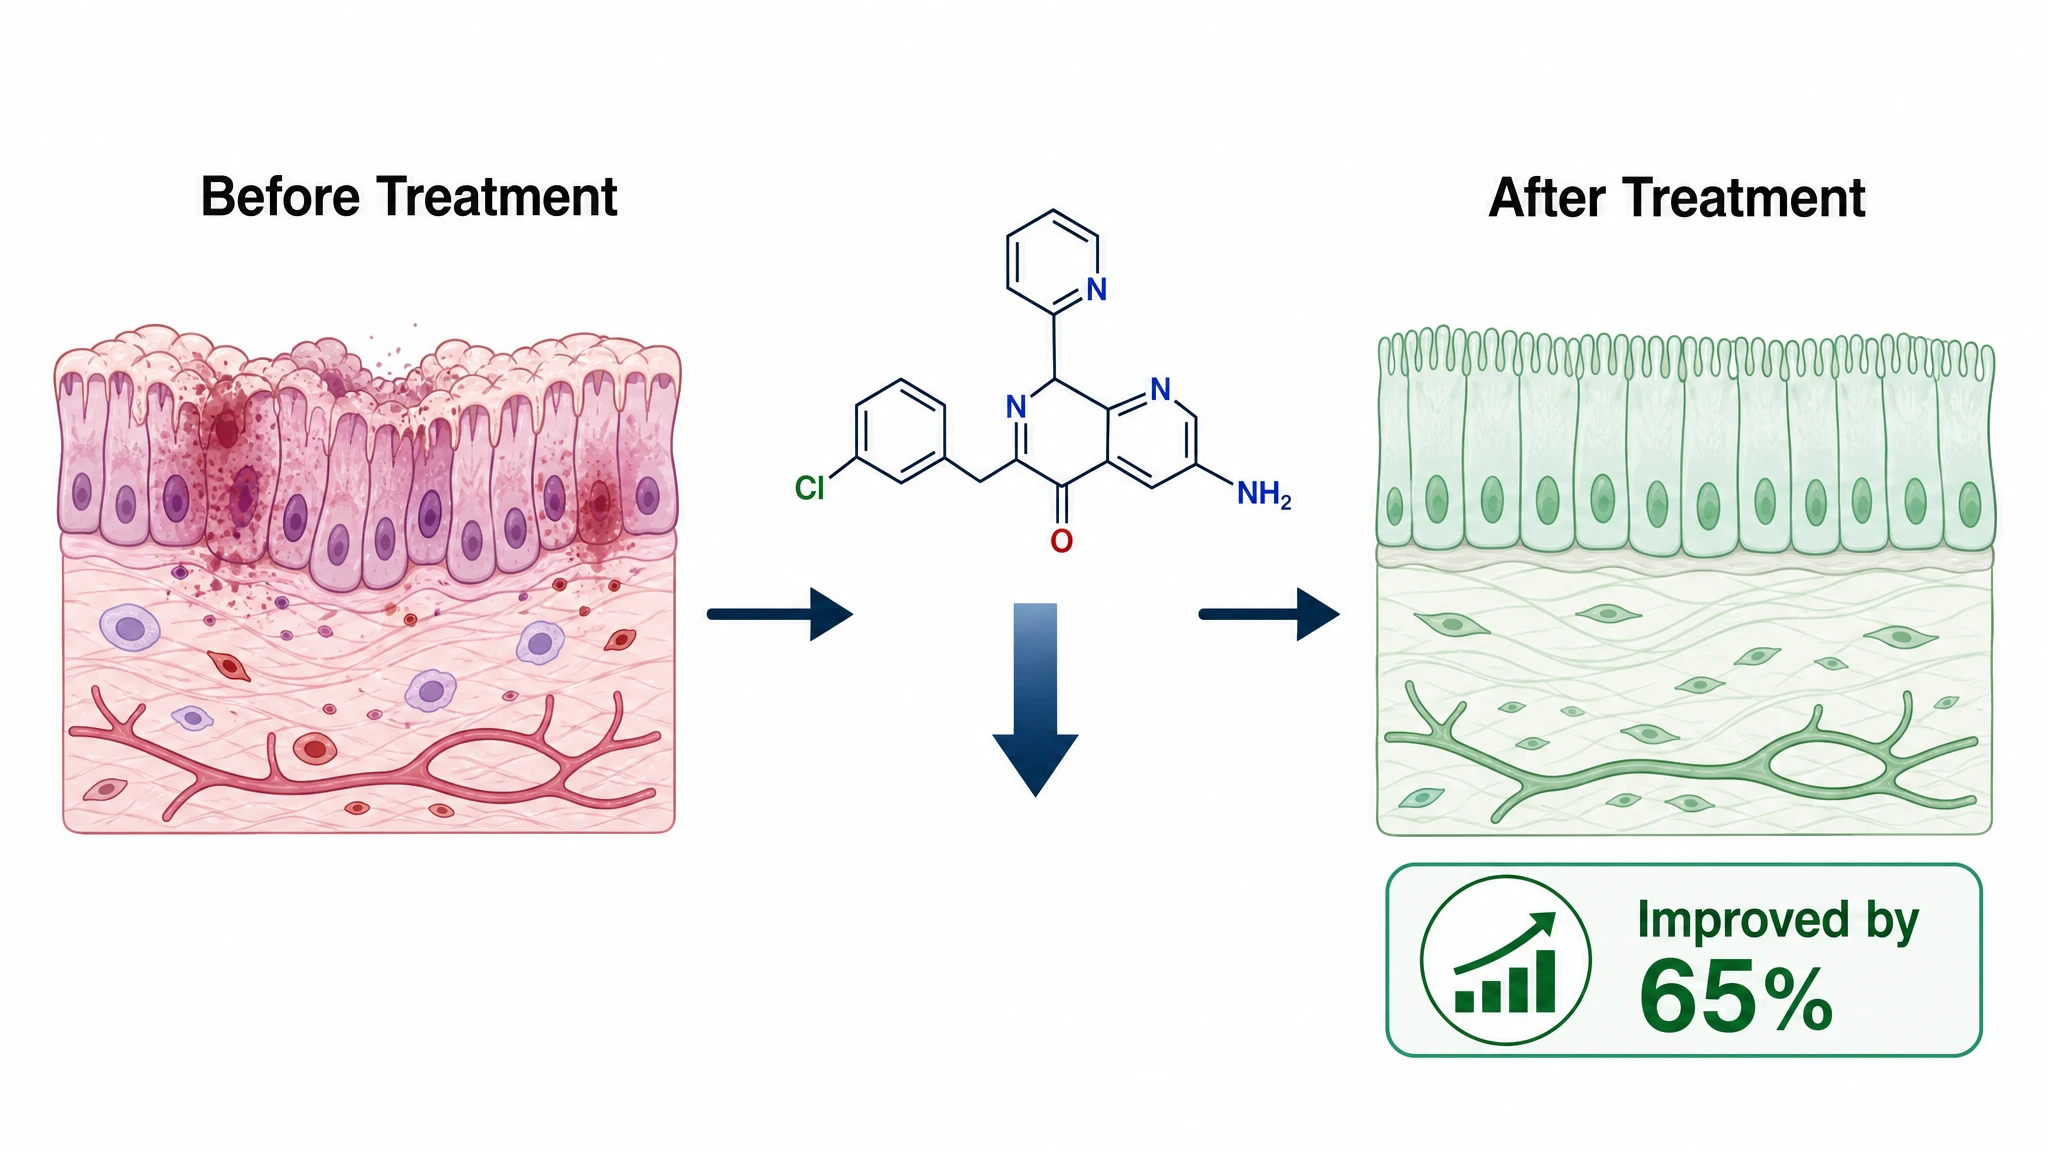
Describe your study's input, method, and key result in a sentence or two, and SciFig's graphical abstract maker produces a clean single-panel figure with labeled icons, directional flow arrows, and balanced whitespace. The layout follows the three-zone convention that Elsevier, ACS, and Cell Press reviewers expect — study subject on the left, experimental approach in the center, key finding on the right. No design skills are needed: this AI graphical abstract generator handles spacing, icon selection, and arrow routing automatically so your figure is ready to submit. It also helps you turn strong graphical abstract examples into your own submission-ready composition rather than copying a static template.
Edit labels, icons, and colors to match your exact data
Every graphical abstract generated by SciFig is fully editable. Swap out icons to reflect your specific organism, material, or instrument; update labels to match your measured endpoints; recolor elements to align with your journal's style guide or your institution's brand palette. Because accuracy is the core requirement of any publication-ready graphical abstract, the editor lets you fine-tune every element — from arrow weights to font size — without rebuilding the figure from scratch.
Export at journal-specified resolution for immediate submission
Once your graphical abstract design is final, export at the pixel dimensions and DPI your target journal requires — whether that is the 531 × 1328 px Elsevier spec, the 300-dpi Cell Press square, or a wide 16:9 panel for a conference poster. SciFig outputs a crisp, high-resolution image that passes editorial file-format checks. You can also use this visual abstract maker to produce a wider, social-media-friendly version of the same figure for sharing on X or LinkedIn. If you prefer to start from graphical abstract examples or free graphical abstract templates, you can use those as references and still generate a custom panel in SciFig.
What is a graphical abstract?
A graphical abstract is a single-panel visual summary of a research paper that communicates the study's question, methods, and key finding at a glance — now required or recommended by most journals. It uses simple labeled icons, directional arrows, and minimal text. SciFig's graphical abstract maker lets you describe your study in plain language and generate a clean, journal-style figure you can edit, recolor, and export to meet submission requirements.
Why every paper needs a strong graphical abstract
- Most high-impact journals require or strongly recommend a graphical abstract at submission
- A well-designed panel increases article views and citation rates by communicating the key finding instantly
- Readers scanning a table of contents decide in seconds whether to open a paper — a clear visual summary wins that decision
- Graphical abstracts are shared as standalone images on social media, driving traffic back to the full article
- Grant reviewers and conference program committees use them to triage proposals and abstracts quickly
- A focused single-panel figure forces authors to distill their work to its single most important result
- Graphical abstract examples and free templates speed up first-draft layout decisions when they are adapted to the paper rather than copied literally
Key components of an effective graphical abstract
- Study input — the biological sample, patient cohort, material, or research question shown as a labeled icon on the left
- Experimental method or treatment — represented by process icons and labeled steps in the center panel
- Directional flow arrows — guide the reader's eye from input through method to result in a logical sequence
- Key result or conclusion — a clear visual outcome such as a data graph, structural model, or quantitative callout on the right
- Minimal text labels — short noun phrases (two to five words) identify each element without cluttering the panel
- Consistent color palette — two or three accent colors highlight the most important pathway or comparison
Where graphical abstracts are used
- Journal manuscript submissions to Elsevier, ACS, Cell Press, RSC, and Wiley titles
- Conference poster sessions and oral presentation opening slides
- Grant and fellowship applications where a single-panel summary accompanies the specific aims
- Lab websites, university news releases, and institutional social-media accounts
- Thesis and dissertation front matter as a concise visual overview of the study
- Science communication and public engagement content reaching non-specialist audiences
How to make a graphical abstract
Describe your graphical abstract
Tell SciFig what to draw in plain language — no design tools required.
Generate with SciFig
Get a clean, publication-ready figure that matches your description in seconds.
Edit & export
Vectorize it into editable SVG, relabel everything, and export for your paper, poster, or slides.
Graphical Abstract Maker — Frequently Asked Questions
Common questions about Graphical Abstract Maker.
More tools

Conceptual Framework Generator
Create professional conceptual framework diagrams showing variable relationships, hypotheses, and theoretical models for your research.

Free Body Diagram Generator
Create accurate, publication-ready free body diagrams with labeled force vectors for weight, normal force, friction, and tension in seconds.

Bell Curve Generator
Generate a precise, fully labeled bell curve showing mean, standard deviations, and percentile regions — ready to export for your paper, thesis, or classroom.
Related links
Home
Turn text, sketches, references, PDFs, and photos into Scientific Figures
Text-to-Figure
Generate a figure from a plain-language description
Models
Default to GPT Image 2 for journal papers; switch to Nano Banana Pro for slides and posters; pick Nano Banana 2 for routine figure work
Tutorials
Seven short walkthroughs of the AI scientific figure generator
Blog
Tutorials, tool comparisons, and publication tips for researchers.
Inspiration
Explore publication-ready scientific figure examples, copy the prompts, and use them as starting points for your own work.

Ready to publish?
Make your own graphical abstract in minutes.
Start for freeFree to start · No credit card required · Built for researchers