ER Diagram Generator
Create precise entity relationship diagrams with tables, attributes, primary keys, and cardinality — using SciFig's AI ER diagram generator.
Figure prompt
Core Subject (e.g., Cas9 protein cutting DNA)
Action / Details (e.g., Double strand break, detailed molecular view)
Start with 100 free credits|No credit card required
Get up to 300 free credits on day one when you join through an invite.
Reviewed by SciFig TeamUpdated
ER Diagram Generator— templates & examples
Everything you need to generate a clear ER diagram
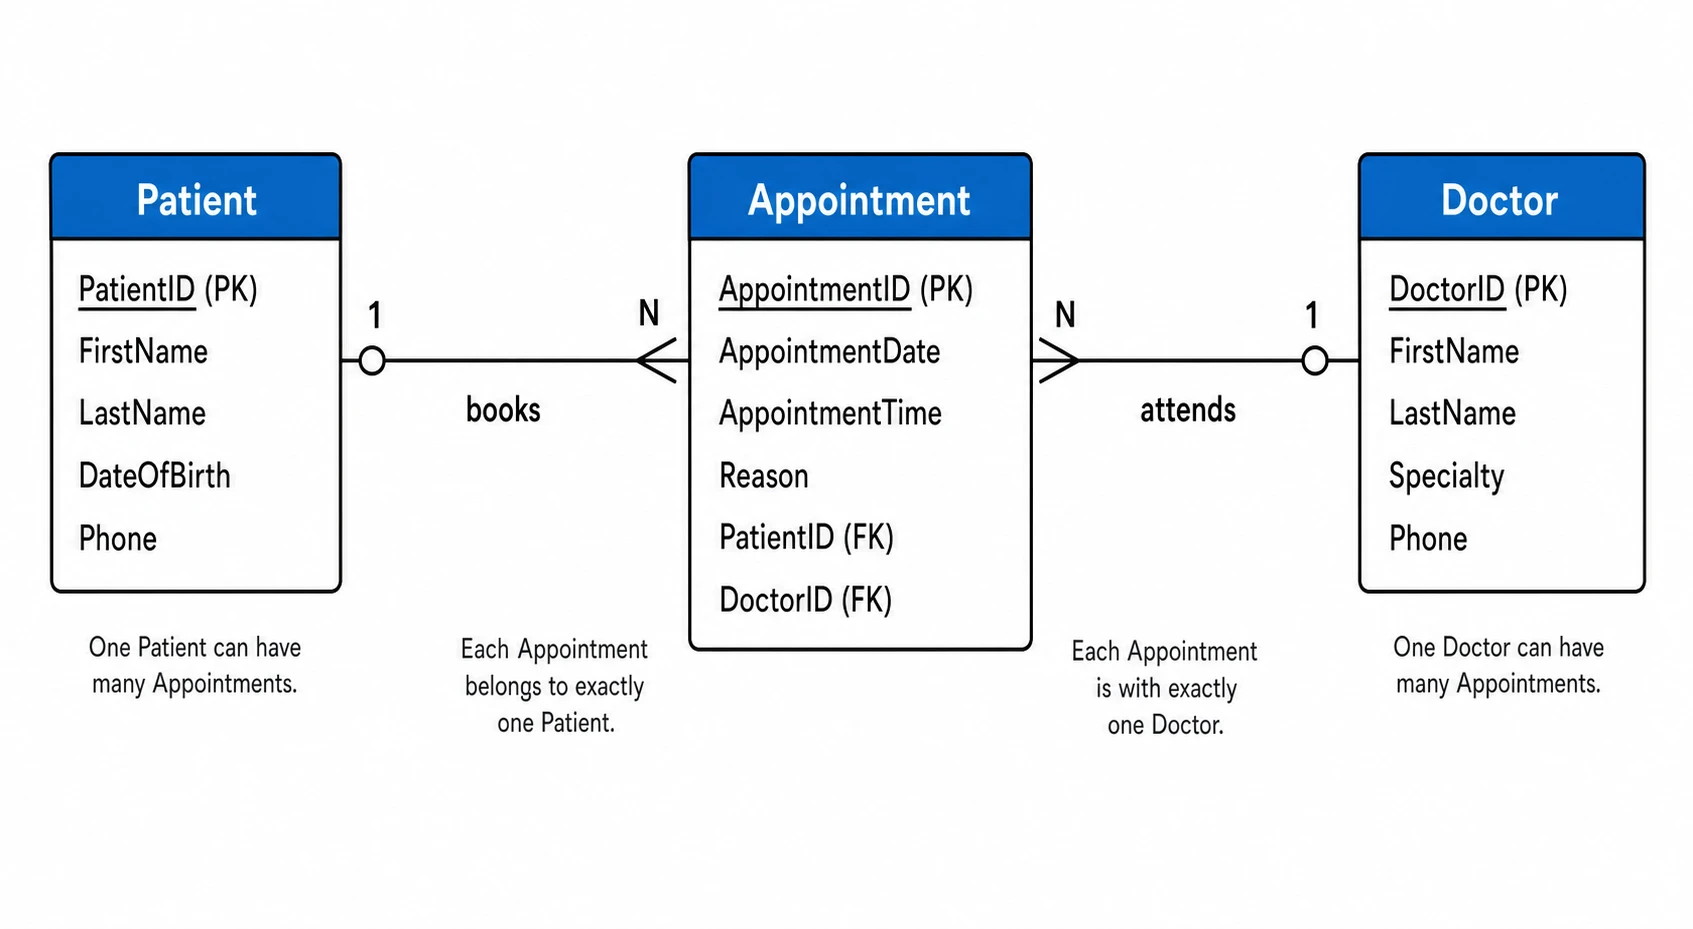
Entities, attributes, and relationships from plain language
Describe your data model in everyday terms — entity names, key attributes, primary and foreign keys, and how entities relate — and SciFig's ER diagram generator AI renders a complete ERD with correct cardinality notation. Primary keys are marked, foreign key links are drawn as labeled connectors, and every entity appears as a named rectangle with its attributes listed. The result is a publication-ready entity relationship diagram that meets the figure standards of database and information-systems journals.
Flexible notation and editable output
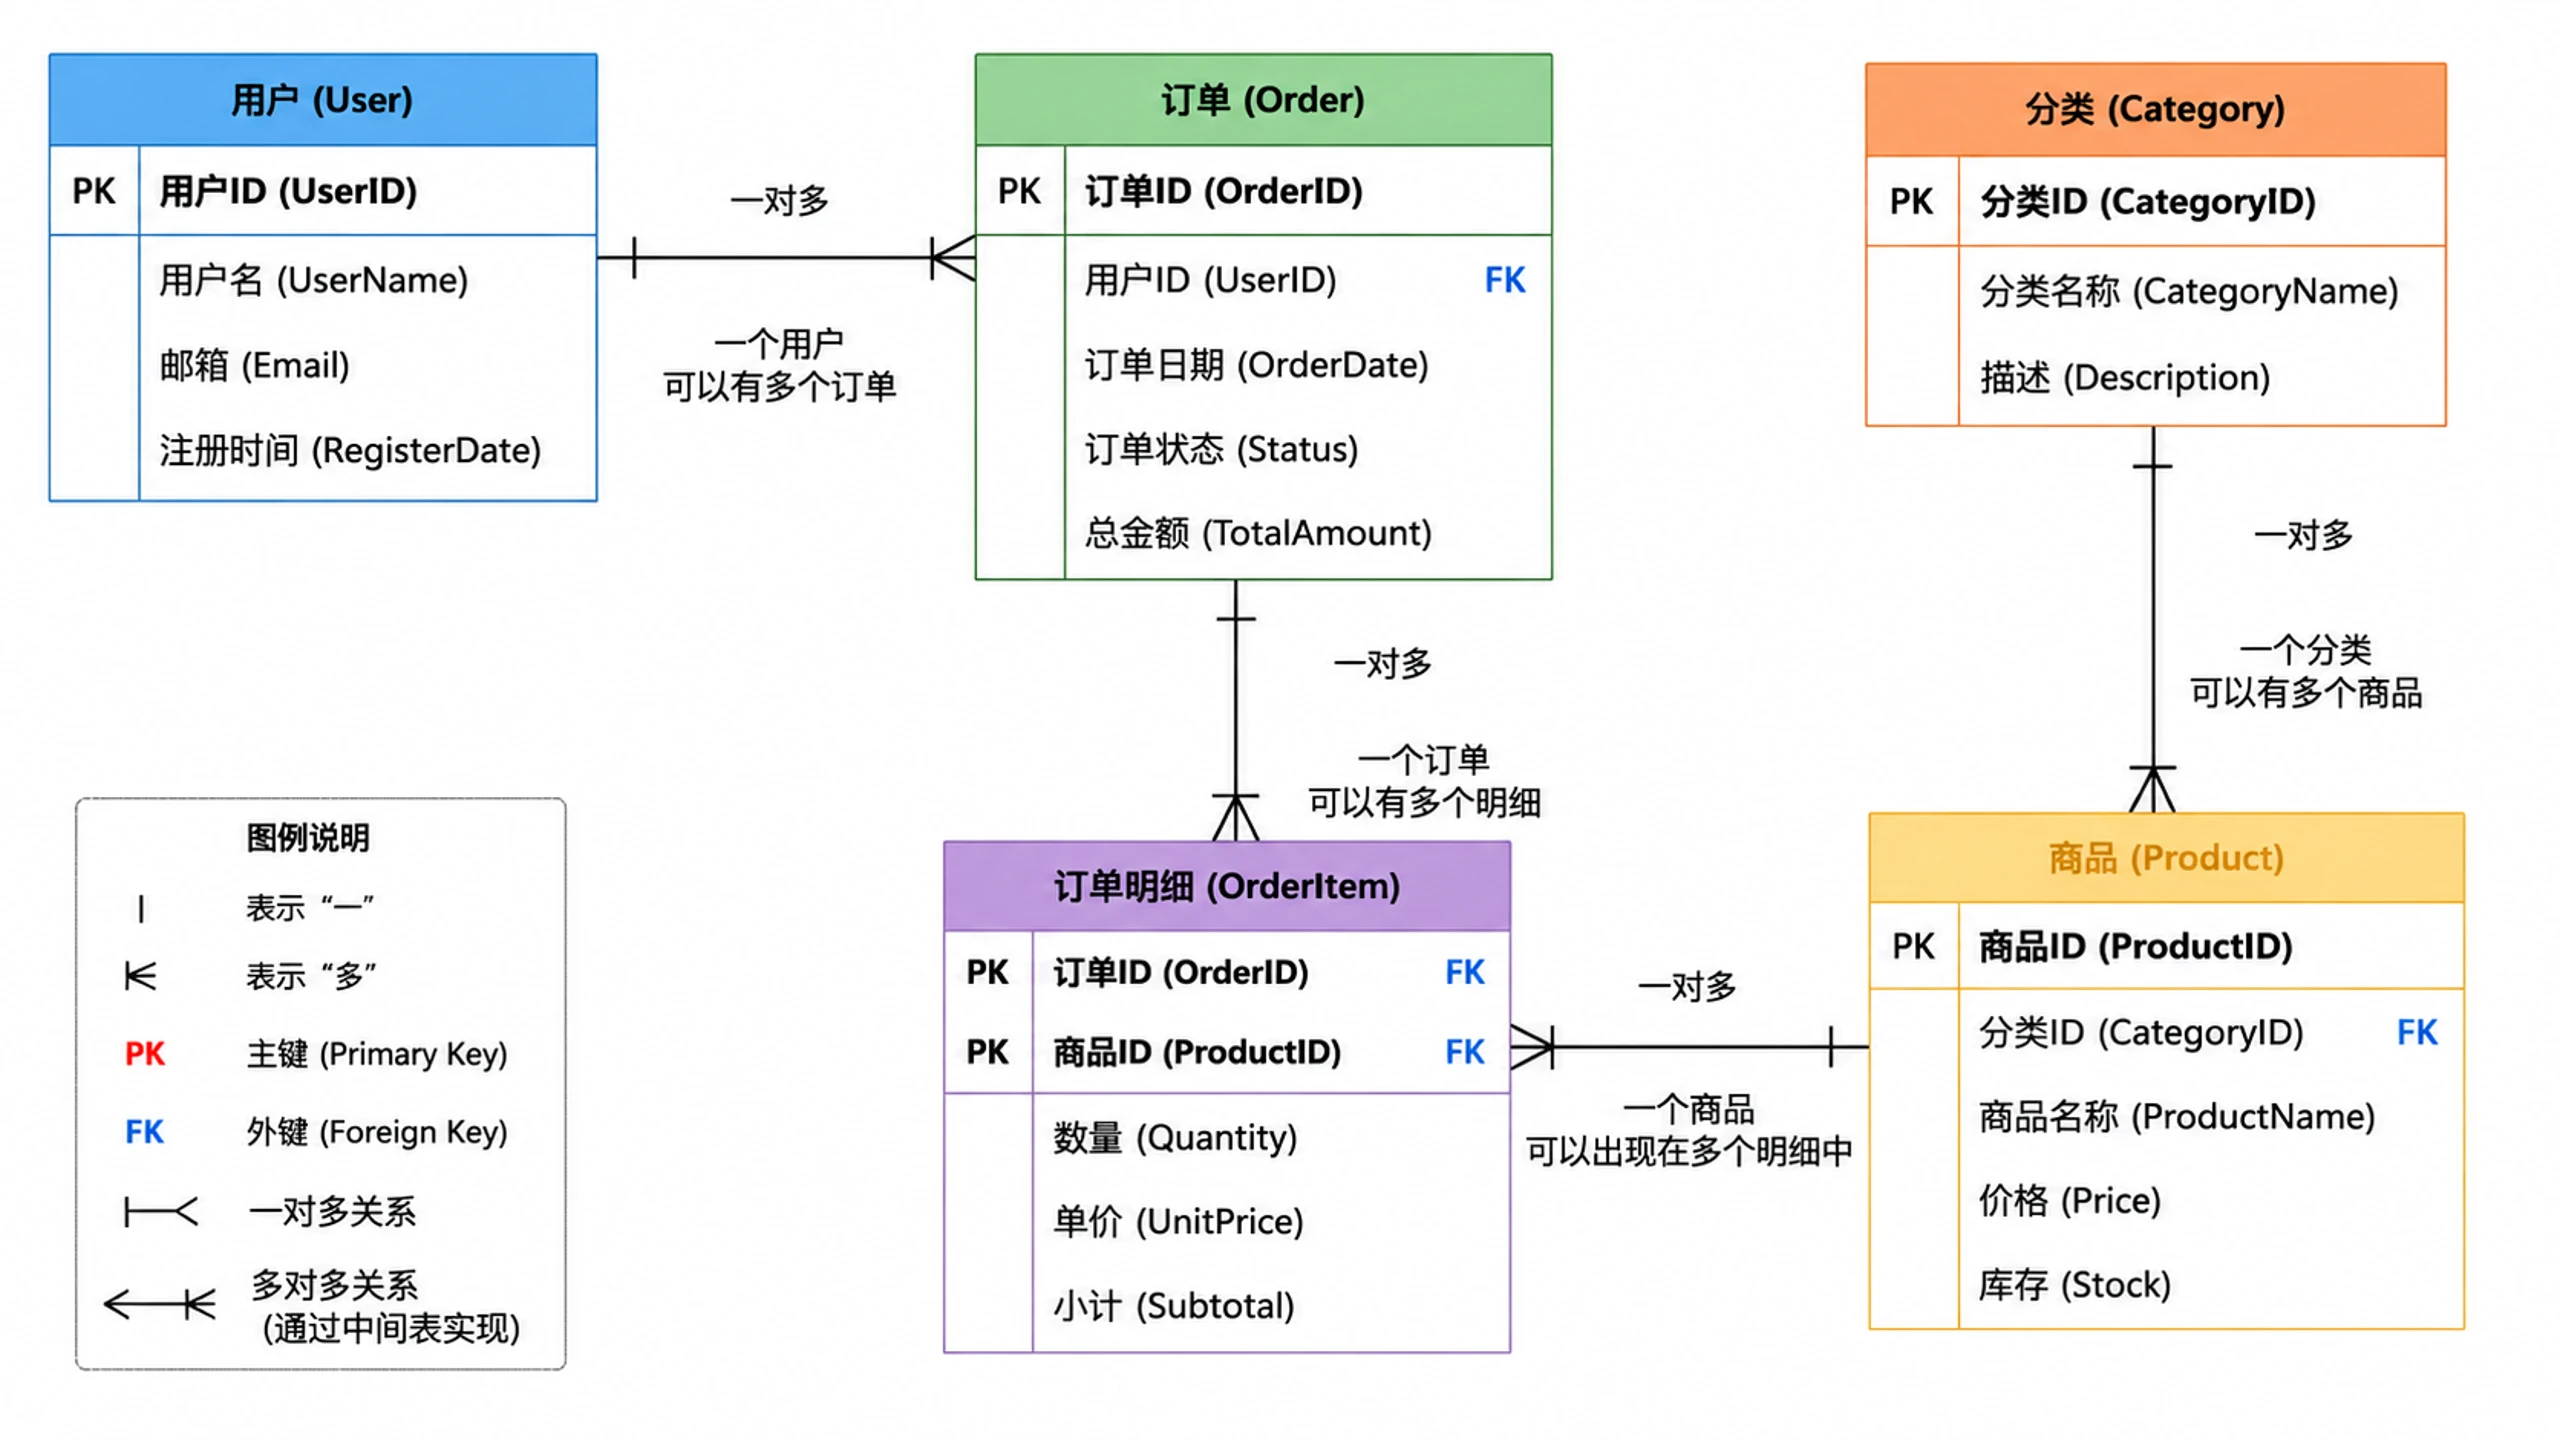
SciFig's ERD diagram maker supports Crow's Foot and Chen-style cardinality notation and keeps every generated ER diagram fully editable. Add or rename entities, adjust cardinality symbols, annotate foreign key labels, or restructure the layout before exporting. Use the ER diagram online result directly in your thesis methods section, system architecture chapter, or software engineering paper without any reformatting.
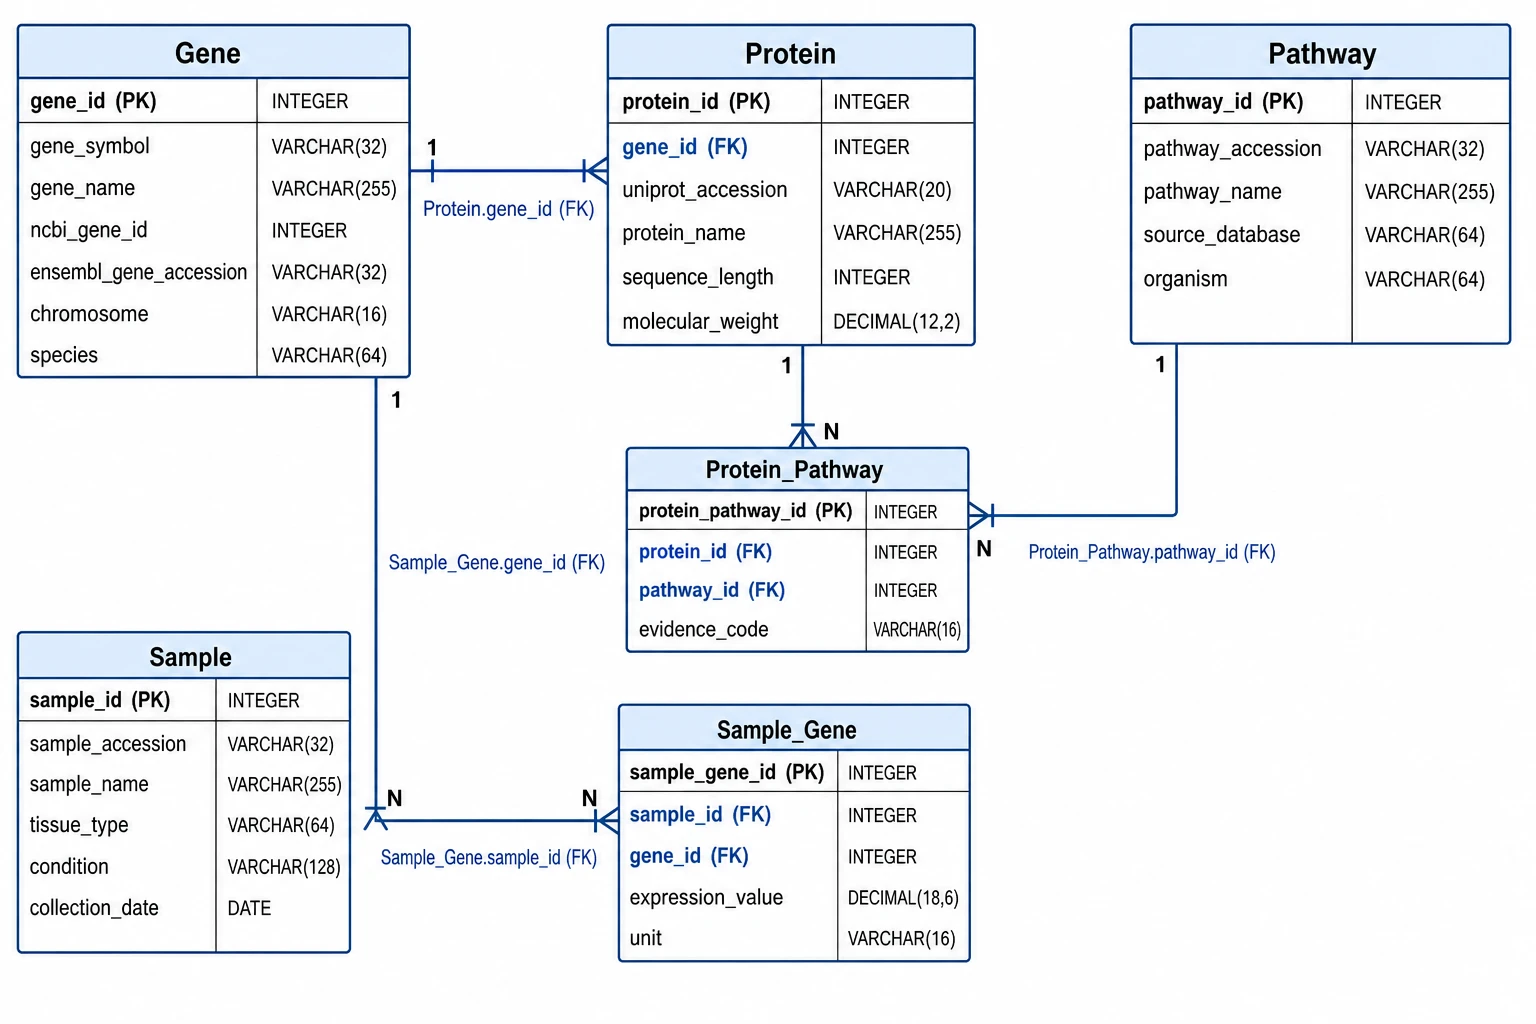
Built for data science, bioinformatics, and research documentation
Whether you are documenting a clinical trial database schema, a bioinformatics pipeline data model, or an information system for a software engineering paper, SciFig's ER diagram generator produces figures at the visual quality that reviewers and committees expect. Export high-resolution ERDs for IEEE, ACM, Springer, or Elsevier publications, or embed them in grant applications that require data management plan diagrams.
What is an ER diagram?
An entity relationship diagram (ER diagram or ERD) maps the entities in a data system, their attributes, and the relationships between them — including cardinality — and is the standard schema figure in computer science, information systems, and data science research. With SciFig's ER diagram generator you describe your data model in plain language and receive a clean, labeled ERD with primary keys marked and Crow's Foot or Chen notation that you can edit and export at publication quality.
Why ER diagrams are essential in data-driven research
- Communicate the logical structure of your database clearly to reviewers and readers
- Required in methods sections of any paper describing a custom data collection system
- Allow collaborators and future researchers to understand and extend your data model
- Make foreign key constraints, join logic, and data relationships immediately visible
- Serve as the authoritative schema reference for software engineering and systems papers
- Support reproducibility by documenting exactly how data is stored and related
Key elements of an ER diagram
- Entities — named rectangles representing real-world objects or concepts (tables in a relational database)
- Attributes — properties of an entity shown inside the rectangle or as ovals; primary keys are underlined or marked
- Primary keys — unique identifiers for each entity record, conventionally underlined or labeled (PK)
- Foreign keys — attributes that reference the primary key of another entity, establishing relationships
- Relationships — lines connecting entities, labeled with a verb phrase describing how entities interact
- Cardinality notation — Crow's Foot or Chen symbols at relationship ends encoding one-to-one, one-to-many, or many-to-many multiplicity
Where ER diagrams appear in research and documentation
- Database and information systems research papers describing schema design
- Bioinformatics publications documenting genomic, proteomic, or clinical data models
- Health informatics and electronic health record system architecture documentation
- Software engineering papers presenting the data layer of a designed system
- Data science methods sections showing how collected datasets are structured and joined
- Grant applications and data management plans that describe database infrastructure
How to make an ER diagram
Describe your ER diagram
Tell SciFig what to draw in plain language — no design tools required.
Generate with SciFig
Get a clean, publication-ready figure that matches your description in seconds.
Edit & export
Vectorize it into editable SVG, relabel everything, and export for your paper, poster, or slides.
ER Diagram Generator — Frequently Asked Questions
Common questions about ER Diagram Generator.
More tools

Conceptual Framework Generator
Create professional conceptual framework diagrams showing variable relationships, hypotheses, and theoretical models for your research.

Free Body Diagram Generator
Create accurate, publication-ready free body diagrams with labeled force vectors for weight, normal force, friction, and tension in seconds.

Bell Curve Generator
Generate a precise, fully labeled bell curve showing mean, standard deviations, and percentile regions — ready to export for your paper, thesis, or classroom.
Related links
Home
Turn text, sketches, references, PDFs, and photos into Scientific Figures
Text-to-Figure
Generate a figure from a plain-language description
Models
Default to GPT Image 2 for journal papers; switch to Nano Banana Pro for slides and posters; pick Nano Banana 2 for routine figure work
Tutorials
Seven short walkthroughs of the AI scientific figure generator
Blog
Tutorials, tool comparisons, and publication tips for researchers.
Inspiration
Explore publication-ready scientific figure examples, copy the prompts, and use them as starting points for your own work.

Ready to publish?
Make your own ER diagram in minutes.
Start for freeFree to start · No credit card required · Built for researchers