Tree Diagram Generator
Create professional tree diagrams showing hierarchical structures, probability branches, and parent-child relationships with SciFig's AI tree diagram maker.
Figure prompt
Core Subject (e.g., Cas9 protein cutting DNA)
Action / Details (e.g., Double strand break, detailed molecular view)
Start with 100 free credits|No credit card required
Get up to 300 free credits on day one when you join through an invite.
Reviewed by SciFig TeamUpdated
Tree Diagram Generator— templates & examples
Everything you need to create a publication-ready tree diagram
Hierarchical structures and probability trees from plain language
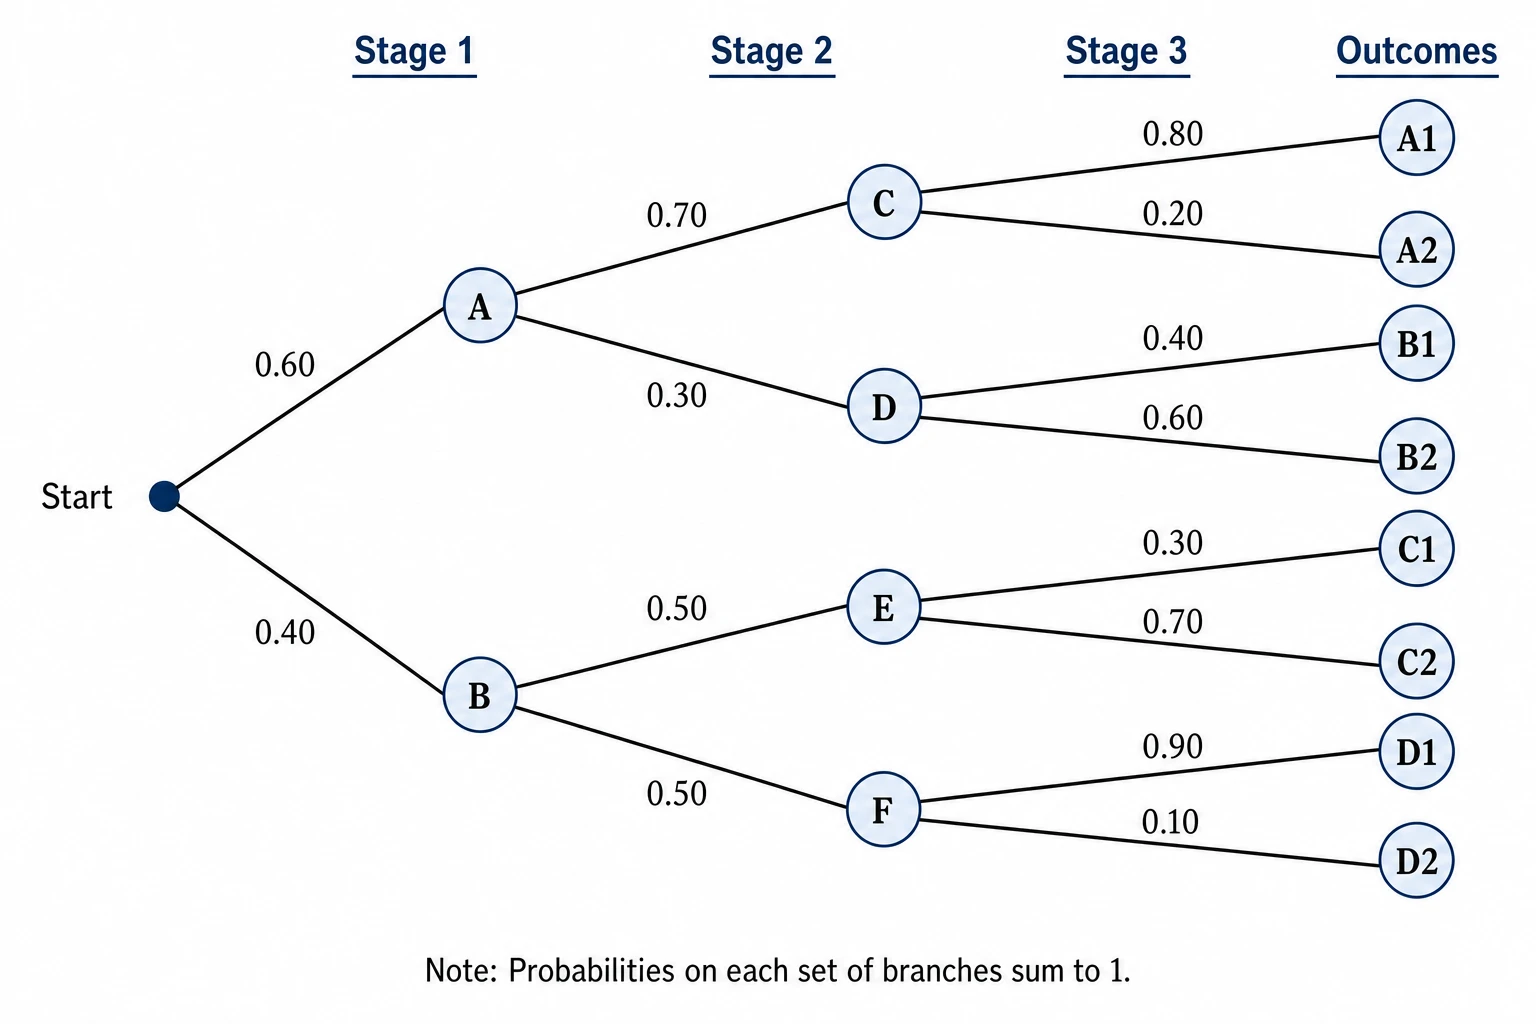
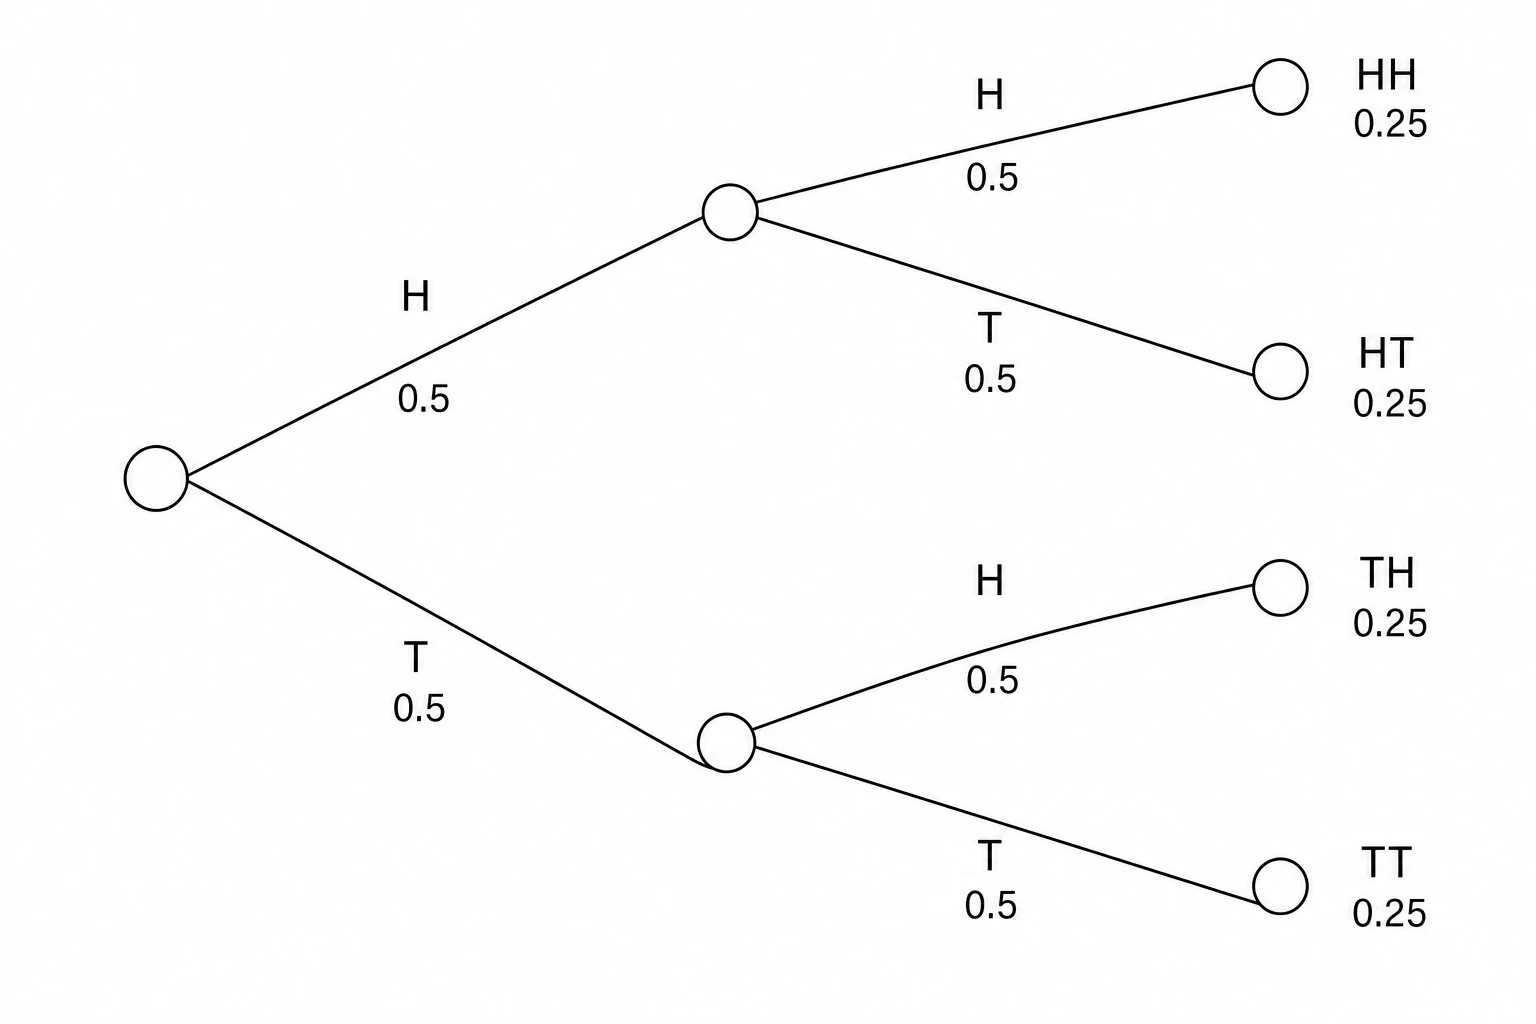
Describe your hierarchy, taxonomy, or probability tree in natural language — list the root, branch labels, child nodes, and any probabilities — and SciFig's tree diagram maker renders a clean, level-aligned tree graph automatically. Whether you need a two-level classification, a five-stage probability tree diagram, or a deep nested hierarchy, the figure emerges with correct parent-child spacing and labeled edges suitable for any research paper or report.
Full editing and flexible layout support
Every tree diagram generated by SciFig's tree diagram creator stays fully editable. Rename nodes, adjust branch labels, rebalance the tree layout, or add probability values after generation. The create tree diagram online workflow is designed for iteration — refine the structure as your analysis develops and export a final figure that meets the visual standards of journals in statistics, biology, linguistics, or computer science.
Built for research figures across disciplines
From probability trees in a statistics methods section to phylogenetic diagrams in a biology paper to decision tree visualizations in a machine learning study, SciFig's tree graph maker produces figures at publication quality. Export high-resolution tree diagrams for Springer, Wiley, Nature, or IEEE publications, or embed them in presentations and thesis chapters — with white backgrounds and clear node-label contrast throughout.
What is a tree diagram?
A tree diagram expands from a root node through labeled branches to leaf nodes, representing hierarchical relationships, sequential decisions, or probability outcomes, and is used across probability theory, biology, computer science, and organizational research. With SciFig's tree diagram maker you describe your hierarchy or probability tree in plain language and create a labeled tree graph you can edit and export for any academic publication or research report.
Why tree diagrams are essential research figures
- Communicate hierarchical relationships and classification levels in a single readable image
- Required in probability and statistics methods sections to enumerate sequential outcomes
- Essential for biology taxonomy, phylogenetics, and evolutionary lineage figures
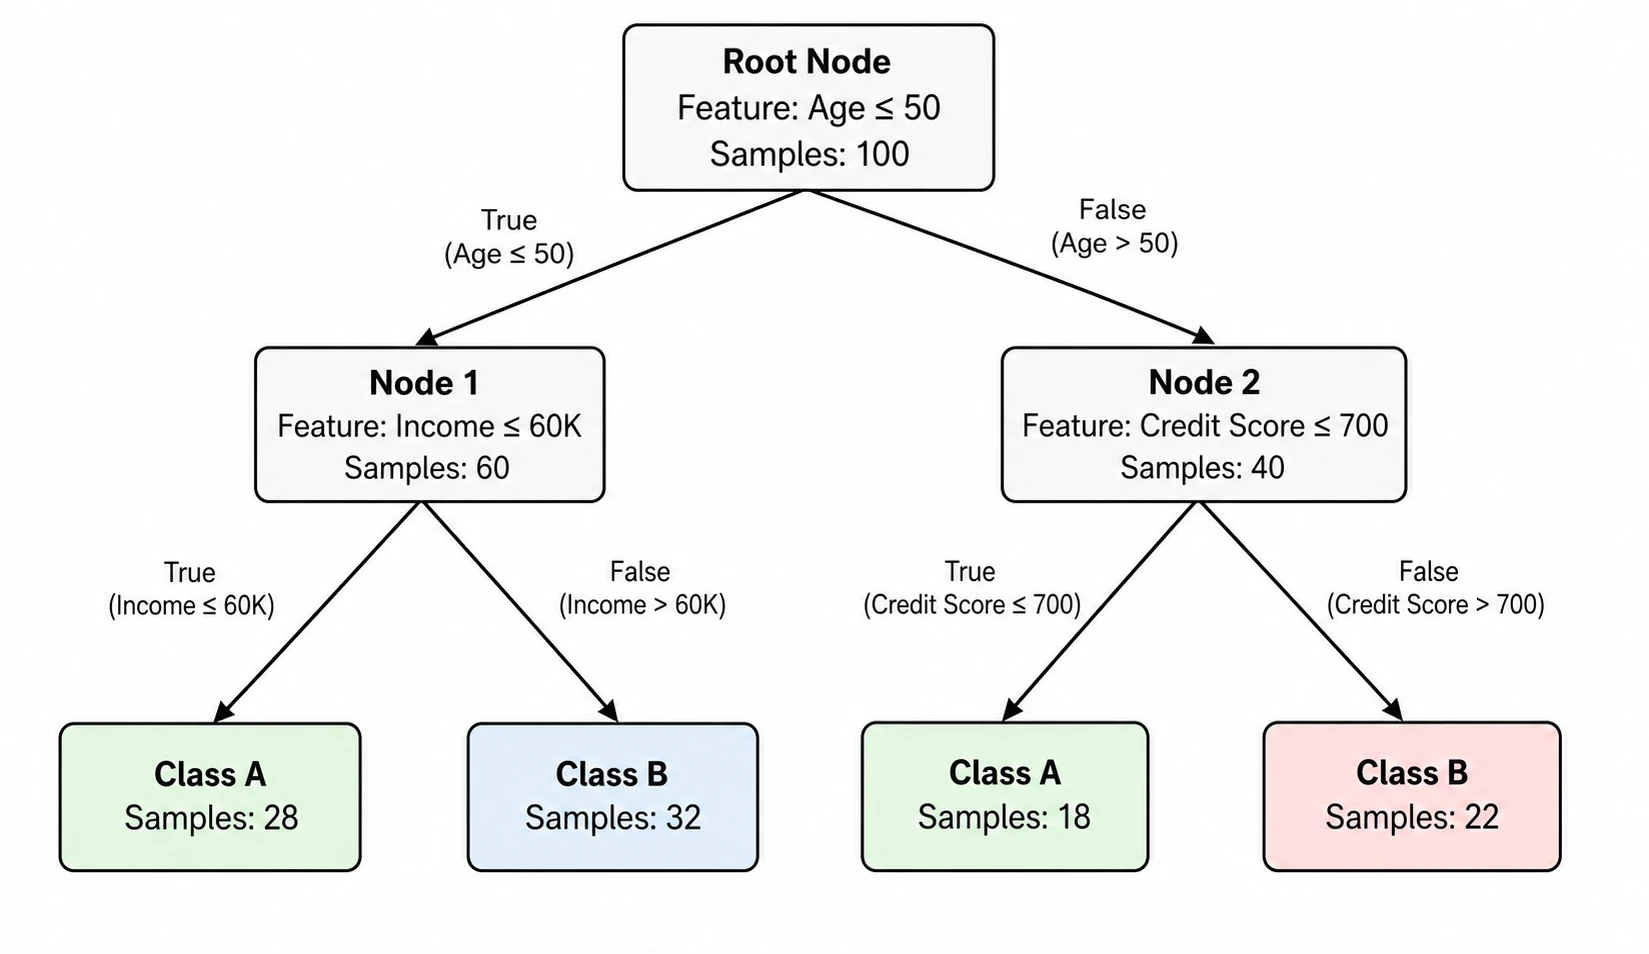
- Show decision paths and branching logic in machine learning and algorithmic papers
- Make complex nested structures immediately navigable for reviewers and readers
- Serve as the standard structural figure in linguistics, computer science, and organizational research
Key elements of a tree diagram
- Root node — the top-level starting point of the hierarchy, drawn at the top or left of the figure
- Internal nodes — intermediate categories or decision points connected to both parent and child branches
- Leaf nodes — terminal endpoints with no children, representing final outcomes, categories, or taxa
- Branches — labeled edges connecting parent to child nodes, often carrying probability values or relationship names
- Levels — horizontal or vertical tiers that indicate depth in the hierarchy from root to leaves
- Labels — node names and branch annotations that give the tree diagram its semantic meaning
Where tree diagrams appear in research
- Probability and statistics papers enumerating outcomes of sequential or conditional events
- Biology and ecology publications showing taxonomic classification and phylogenetic trees
- Computational linguistics papers depicting parse trees and syntactic derivation structures
- Machine learning papers visualizing decision tree models and classification hierarchies
- Computer science algorithm papers illustrating recursive data structures and search trees
- Organizational and social science research mapping institutional hierarchies and typologies
How to make a tree diagram
Describe your tree diagram
Tell SciFig what to draw in plain language — no design tools required.
Generate with SciFig
Get a clean, publication-ready figure that matches your description in seconds.
Edit & export
Vectorize it into editable SVG, relabel everything, and export for your paper, poster, or slides.
Tree Diagram Generator — Frequently Asked Questions
Common questions about Tree Diagram Generator.
More tools

Conceptual Framework Generator
Create professional conceptual framework diagrams showing variable relationships, hypotheses, and theoretical models for your research.

Free Body Diagram Generator
Create accurate, publication-ready free body diagrams with labeled force vectors for weight, normal force, friction, and tension in seconds.

Bell Curve Generator
Generate a precise, fully labeled bell curve showing mean, standard deviations, and percentile regions — ready to export for your paper, thesis, or classroom.
Related links
Home
Turn text, sketches, references, PDFs, and photos into Scientific Figures
Text-to-Figure
Generate a figure from a plain-language description
Models
Default to GPT Image 2 for journal papers; switch to Nano Banana Pro for slides and posters; pick Nano Banana 2 for routine figure work
Tutorials
Seven short walkthroughs of the AI scientific figure generator
Blog
Tutorials, tool comparisons, and publication tips for researchers.
Inspiration
Explore publication-ready scientific figure examples, copy the prompts, and use them as starting points for your own work.

Ready to publish?
Make your own tree diagram in minutes.
Start for freeFree to start · No credit card required · Built for researchers