
Free Gantt Chart Generator
Turn a research plan into a clean timeline figure — work packages as horizontal bars, milestones as markers, and a month axis reviewers can read at a glance.
Start with up to 150 free credits|No credit card required
Get up to 350 free credits on day one when you join through an invite.
Updated
Free Gantt Chart Generator— templates & examples
Everything you need to build a clear gantt chart
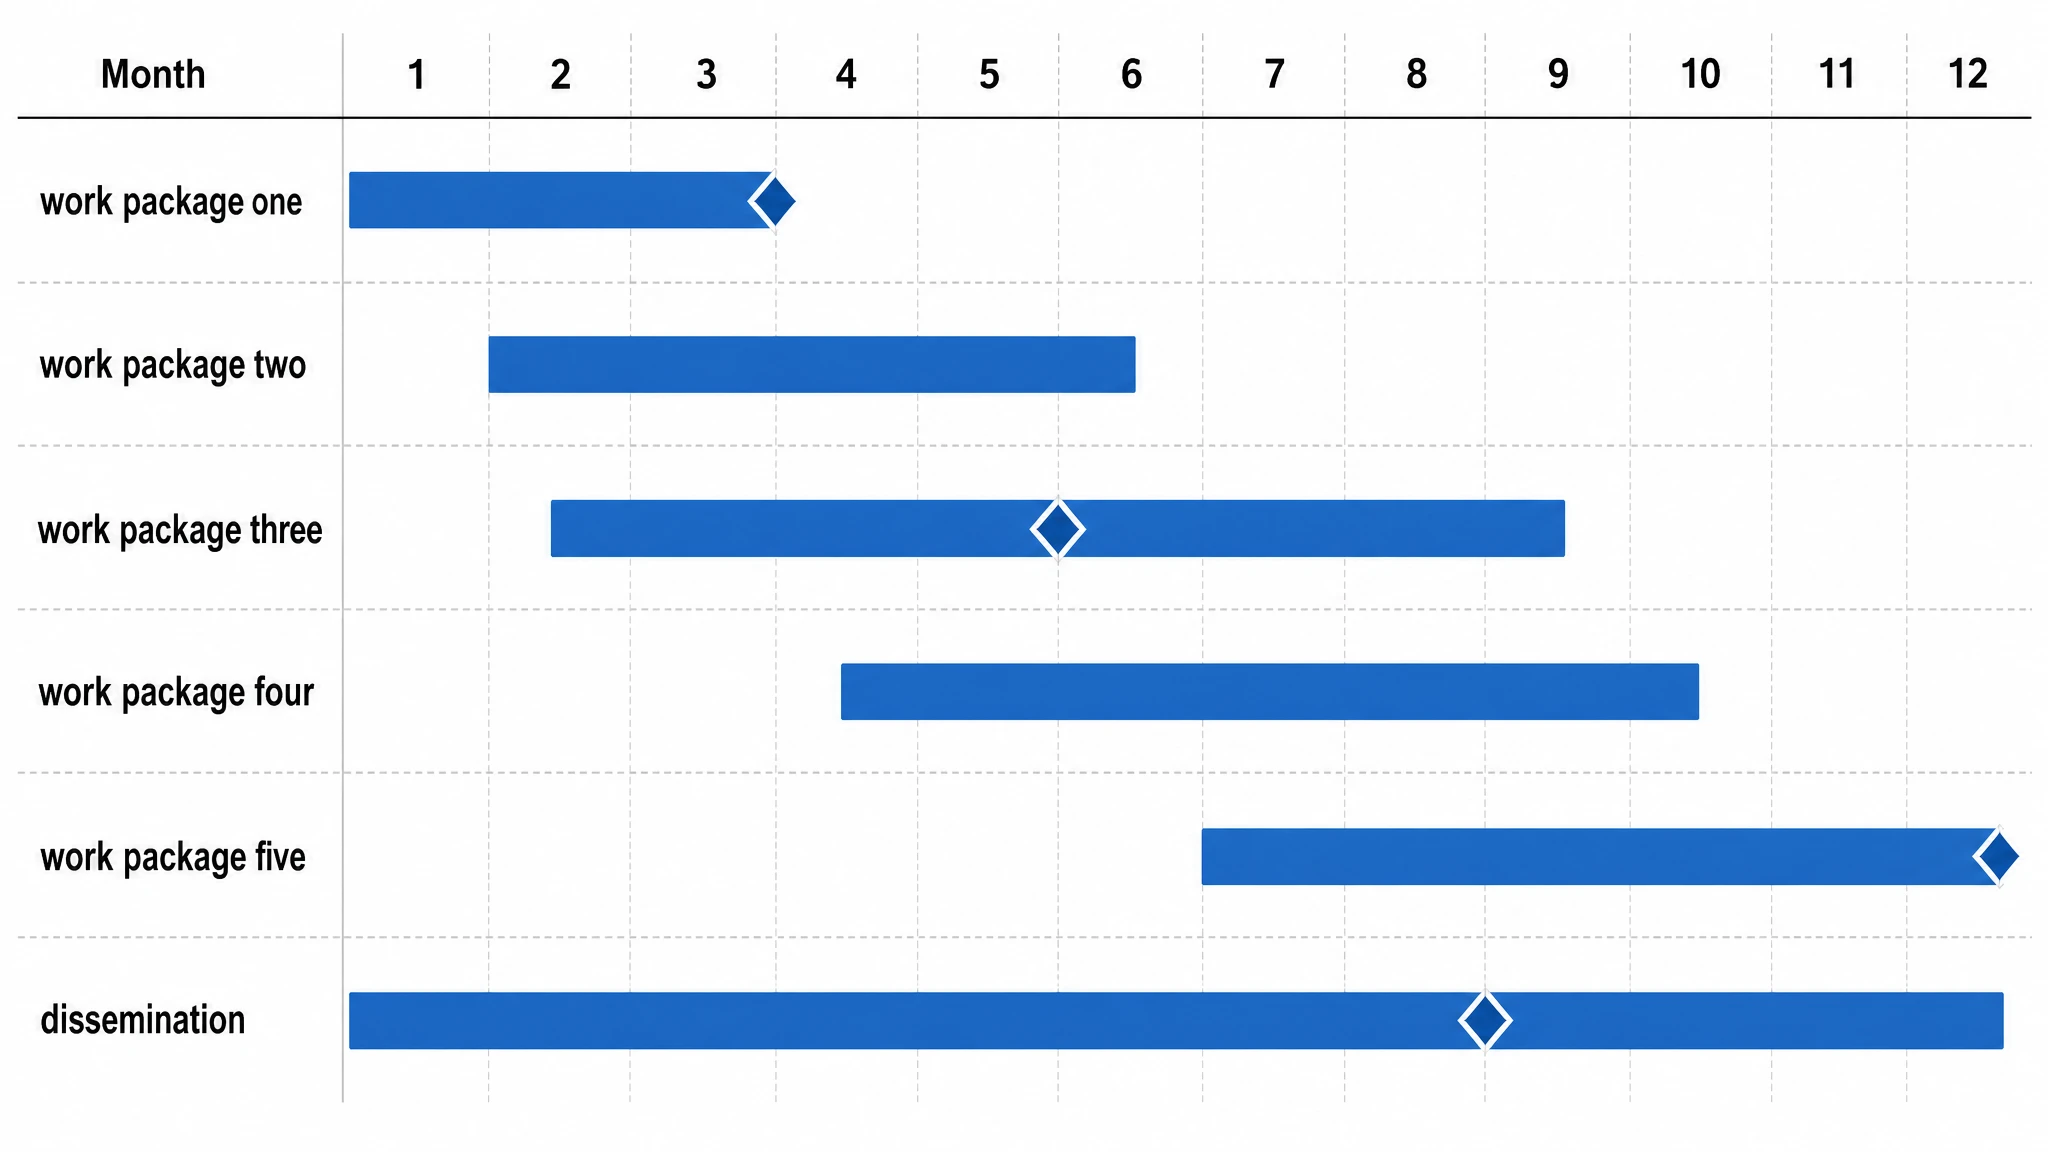
Lay out work packages across a month or quarter axis
Research timelines live or die on readability at page size. SciFig's gantt chart generator stacks each work package as its own labeled row with a bar spanning its months, keeping the calendar axis and row labels legible even when the figure is scaled down to fit a proposal. Used as a gantt diagram generator for multi-year plans, it keeps quarter columns evenly spaced as rows are added.
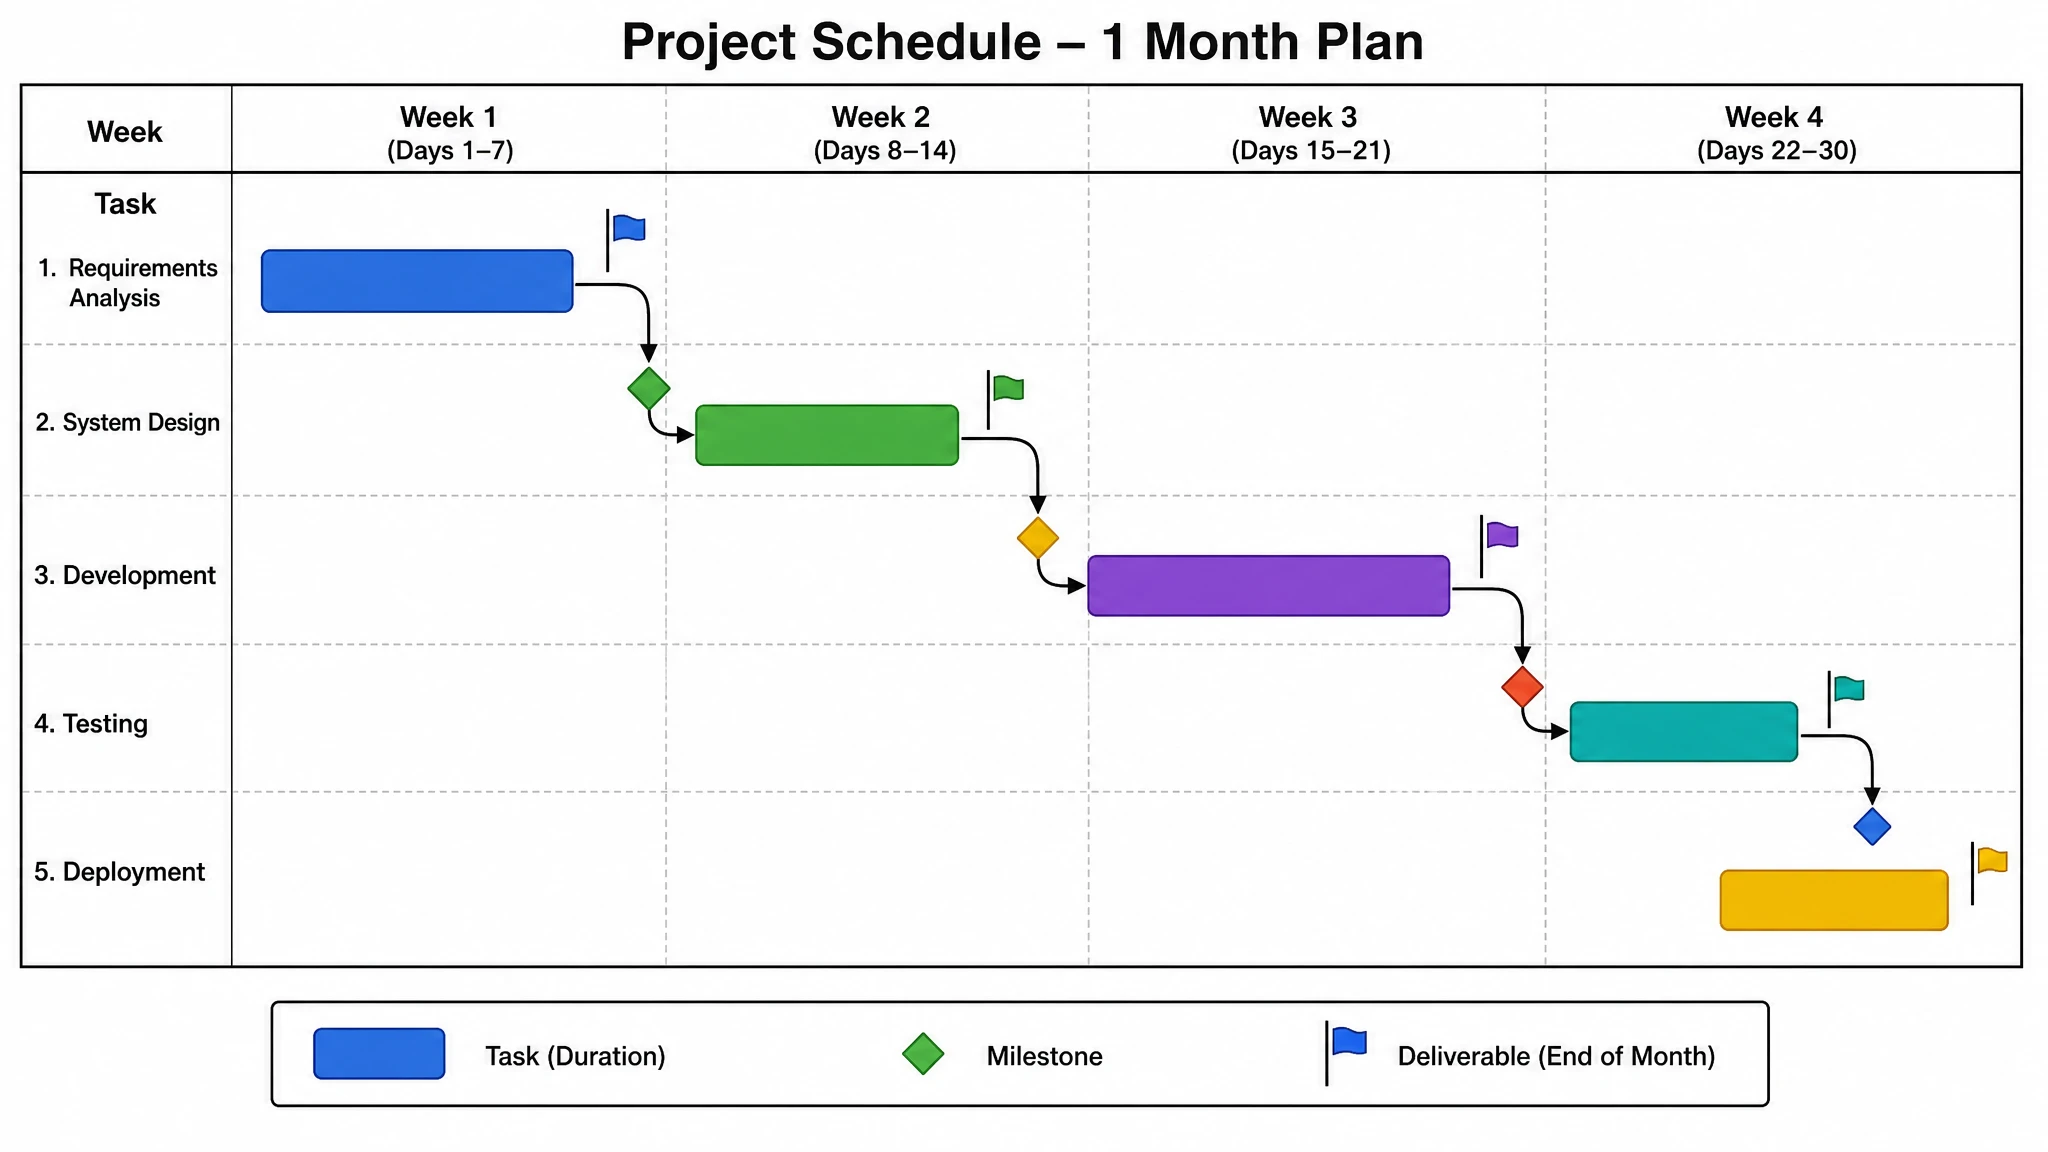
Mark milestones, deliverables, and dependencies
A gantt generator should show more than duration. SciFig draws milestones as diamond markers at their target dates, flags deliverable months, and can add dependency arrows between packages so reviewers see which task has to finish before the next can start.
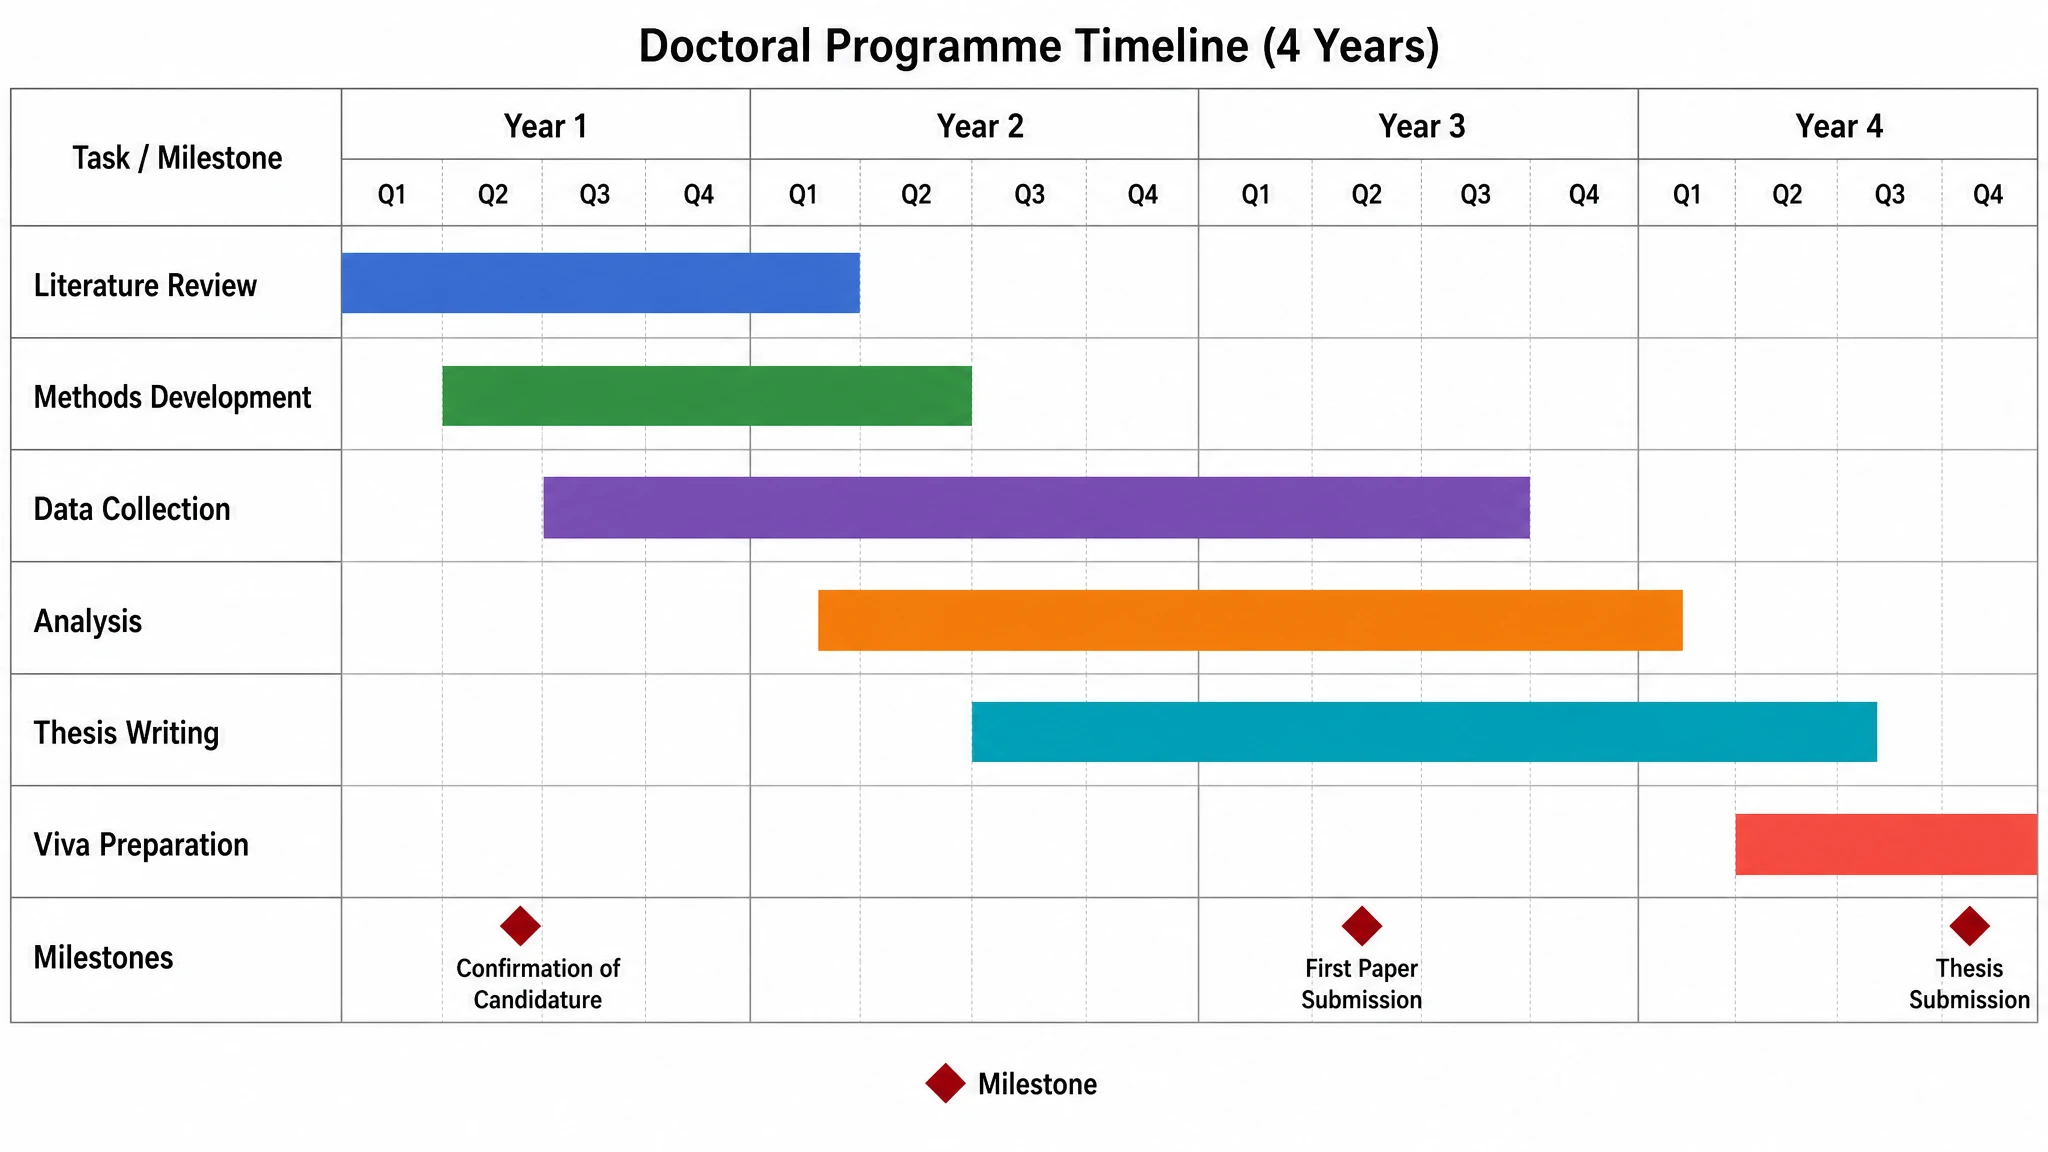
Export timelines for proposals, theses, and reports
Use this online gantt chart maker to produce the figure once, then reuse it as the plan evolves. Exports come out at publication resolution with editable labels, so a shifted deadline means changing one bar rather than rebuilding the whole schedule.
What is a gantt chart?
A Gantt chart is a timeline figure where each task becomes a horizontal bar spanning its start and end date, stacked against a shared calendar axis. In research it is the standard way to show reviewers how work packages, milestones, and deliverables are scheduled across a funded project. With SciFig's gantt chart generator you describe your work packages, durations, and milestones in plain language and get a clean, publication-ready timeline you can edit and export.
Why you need a gantt chart
- Show funders that a project plan is realistic and properly sequenced
- Replace a paragraph of scheduling prose with one figure reviewers can scan
- Make overlaps between concurrent work packages immediately visible
- Tie milestones and deliverables to specific months of the funding period
- Expose scheduling conflicts before they become slipped deadlines
- Meet the timeline or workplan requirement common in grant application forms
Key components of a gantt chart
- Task rows — one labeled line per work package or activity
- Time axis — a calendar scale in months or quarters spanning the project
- Task bars — horizontal bars whose position and length encode start and duration
- Milestones — diamond markers for zero-duration checkpoints and approvals
- Deliverables — flagged points where a report or output is due
- Dependency arrows — links showing which task must finish before another starts
Where gantt charts are used
- Grant proposals and funding applications requiring a workplan figure
- PhD and master's thesis planning across the full registration period
- Clinical trial protocols scheduling recruitment, follow-up, and analysis
- Progress reports comparing planned against actual timelines
- Multi-partner consortium projects coordinating work packages across sites
- Lab project planning and postgraduate supervision meetings
How to make a gantt chart
Describe your gantt chart
Tell SciFig what to draw in plain language — no design tools required.
Generate with SciFig
Get a clean, publication-ready figure that matches your description in seconds.
Edit & export
Vectorize it into editable SVG, relabel everything, and export for your paper, poster, or slides.
Free Gantt Chart Generator — Frequently Asked Questions
Common questions about Free Gantt Chart Generator.
More tools

Circuit Diagram Maker
Draw electronic circuit schematics

Free Body Diagram Generator
Show forces acting on an object

Graphical Abstract Maker
Summarize your study in one panel
SciFig
Free AI Scientific Figure Generator for Illustrations, Images, Charts and Flowcharts
Models
Default to GPT Image 2 for journal papers; switch to Nano Banana Pro for slides and posters; pick Nano Banana 2.1 for routine figure work
Tutorials
Seven short walkthroughs of the AI scientific figure generator
Blog
Tutorials, tool comparisons, and publication tips for researchers.
Inspiration
Explore publication-ready illustrations, charts and flowcharts. Copy a prompt or open any template as the starting point for your own figure.
Pricing
View pricing

Ready to publish?
Make your own gantt chart in minutes.
Start for freeFree to start · No credit card required · Built for researchers