Comparison of the best scientific illustration tools in 2026, including AI tools for scientific diagrams and the strongest websites for figure generation.
SciFig Team
Scientific Illustration Experts
Scientific publishing in 2026 has become unforgiving about visuals. Journals that once accepted hand-drawn schematics now mandate vector-ready, color-profiled figures that survive 600 dpi print reproduction. Reviewers expect pathway diagrams, experimental workflows, and data visualizations to be clear enough to understand at a glance — and editors will desk-reject manuscripts whose figures fall below bar. Meanwhile, research budgets are tighter than ever, postdoc positions come with zero design budget, and submission deadlines have not gotten any more forgiving. The gap between what science demands visually and what most researchers can produce by hand has never been wider.
The good news: the scientific figure tooling landscape has expanded dramatically. Between mature vector editors, biology-specific icon libraries, and a new wave of AI-powered scientific figure generators, there are more ways to produce publication-quality figures than ever before. The hard part is picking the right scientific figure tool for your specific workflow, skill level, and budget.
This guide covers the 10 best scientific illustration tools available in 2026, with honest assessments of who each scientific figure tool is actually built for.
The Scientific Visualization Landscape in 2026
For most of the past decade, scientific illustration tools fell into two rough camps: specialized bio-art software (think BioRender-style drag-and-drop icon libraries) and general-purpose vector editors (Adobe Illustrator, Inkscape) that researchers repurposed for figure work. Both camps required significant time investment — either learning a library's specific icon vocabulary or mastering bezier curves and layer management.
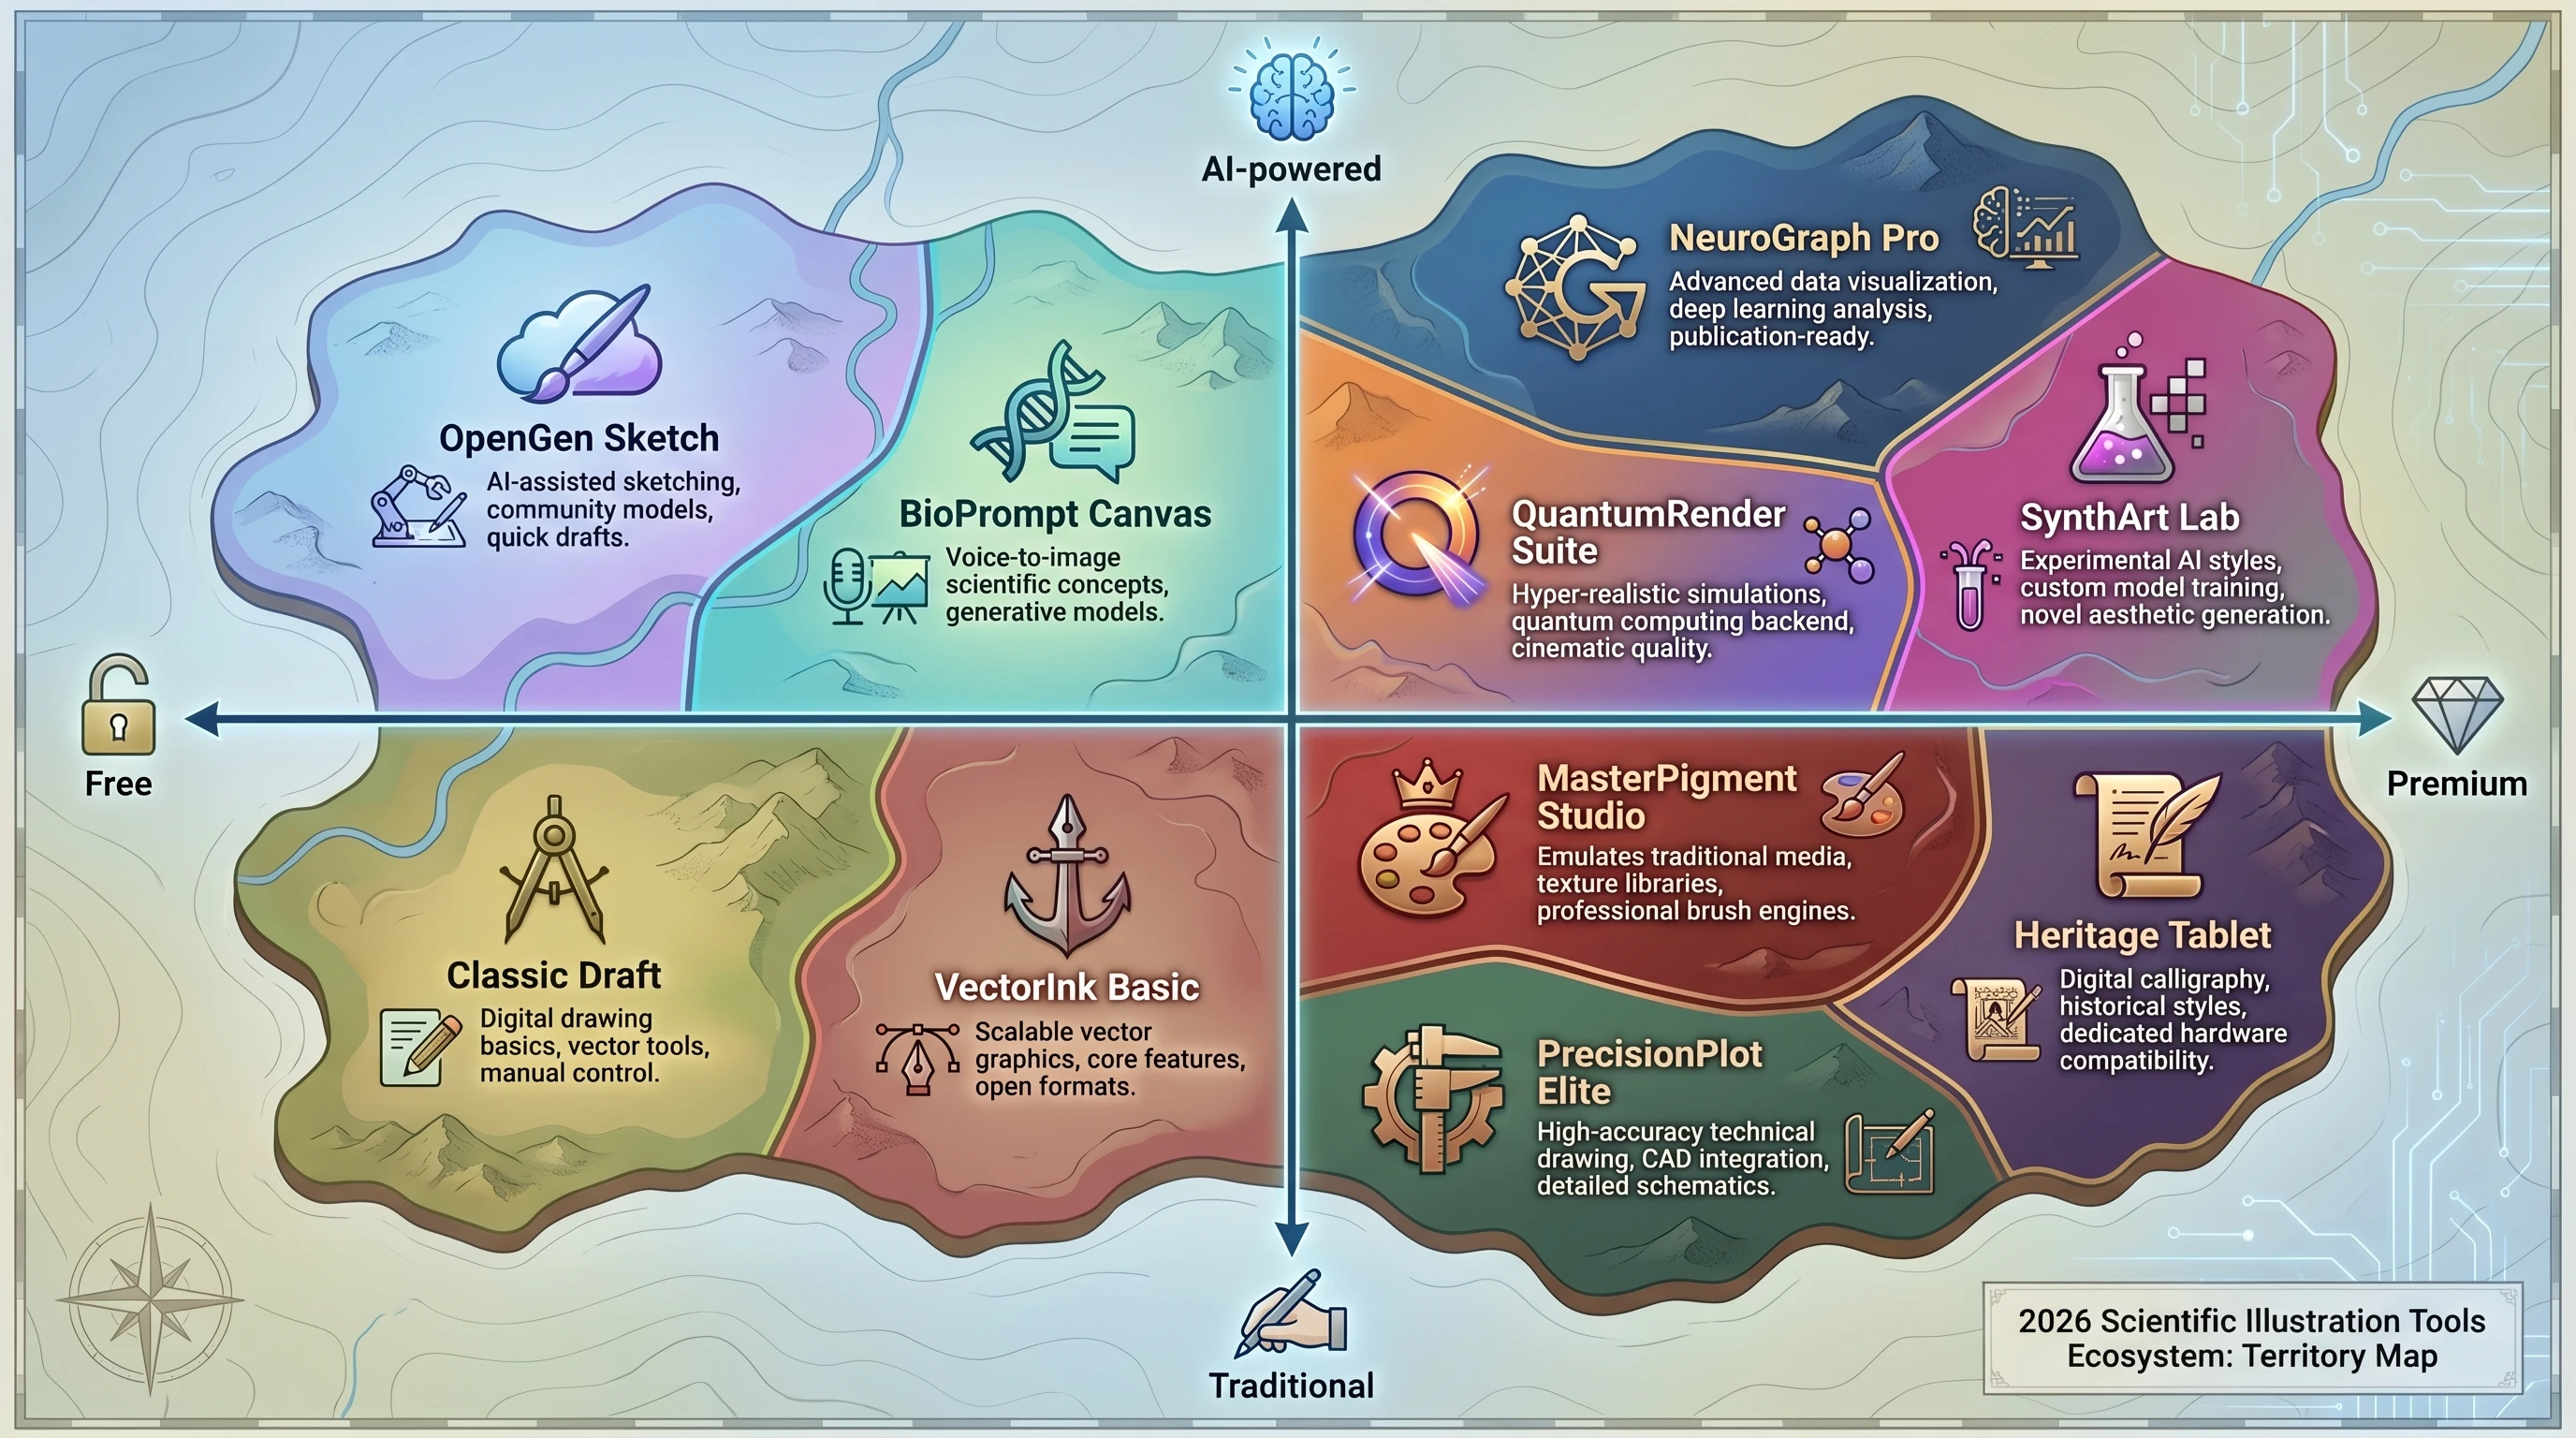
2026 scientific figure tools landscape map: 10 tool territories arranged by axes AI-powered vs Traditional and Free vs Premium (Figure generated with SciFig)
The past two years introduced a genuine third category: AI-native illustration tools that accept natural language descriptions and return complete figures. These are not simple clipart generators; the best ones understand domain-specific terminology, common experimental design conventions, and journal formatting requirements. They have begun to close the gap between "what a researcher can describe" and "what a professional scientific illustrator would produce."
As of 2026, the choice is no longer purely traditional vs. AI — it is about matching the tool's strengths to your specific figure type, deadline, and skill set.
1. BioRender
Best for: Life science researchers who need standardized, professional-looking biological figures quickly.
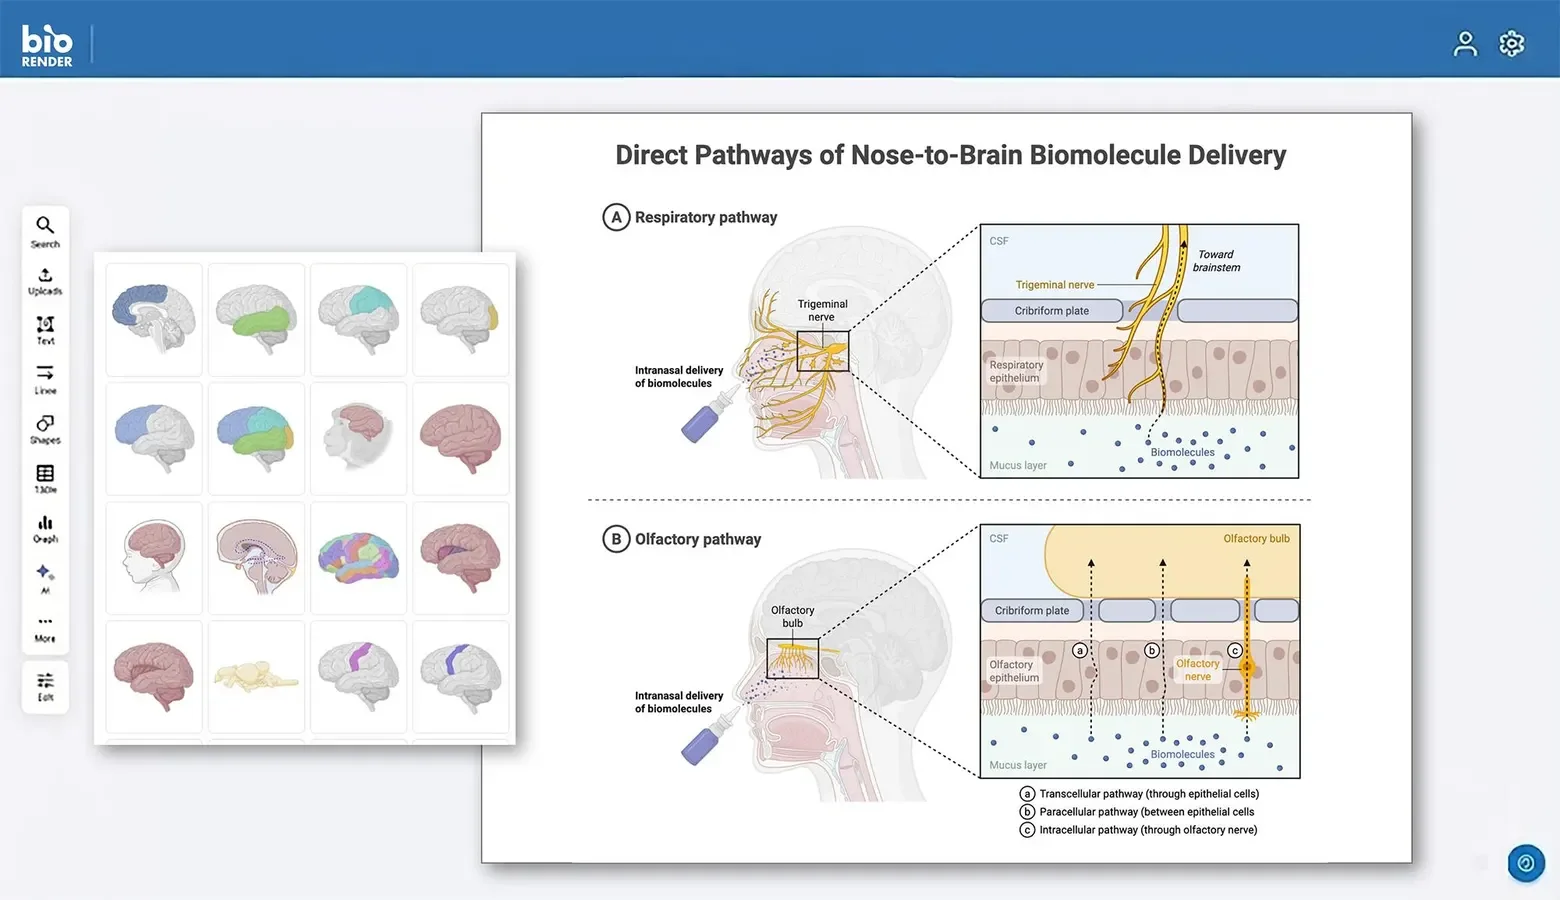
BioRender remains the dominant tool for cell biology, molecular biology, and biomedical scientific figures. Its core value proposition is a curated library of over 50,000 pre-drawn scientific icons — organelles, proteins, cells, lab equipment, model organisms — maintained to a consistent visual style. Researchers drag icons onto a canvas, arrange them into pathways or experimental workflows, and export figures that look professionally made without requiring any drawing skill.
BioRender interface
Pros:
Enormous, well-organized icon library covering most of life science
Consistent visual style across all elements
Built-in publication licensing (important for journal submission)
Active community templates to accelerate common figure types
No design skill required
Cons:
Icons are standardized, which means figures can look generic or interchangeable across papers
Limited to the biology domain — not suited for chemistry, physics, or engineering figures
Subscription required for publication use; free tier is non-commercial only
Customization is constrained to what the icon library supports
Pricing: Academic plans start around $400/year for a single user with publication rights. Institutional licenses are available for labs and departments.
2. Adobe Illustrator
Best for: Researchers or science communicators who need maximum creative control and have time to invest in learning the tool.
Adobe Illustrator is the industry-standard vector editor, used by professional scientific illustrators, graphic designers, and publishers. Every element in an Illustrator file is a mathematically precise vector object — infinitely scalable, print-ready at any resolution, fully editable at the node level. For complex figures that demand custom artwork, precise typography, or non-standard visual styles, Illustrator remains the gold standard.
Pros:
Unmatched precision and creative flexibility
Output is publication-ready at any scale
Extensive ecosystem of plugins, brushes, and scientific drawing resources
Industry-standard file formats (SVG, AI, PDF, EPS) are universally accepted
Powerful typography tools for figure labels and legends
Cons:
Steep learning curve — productive use requires weeks of practice, mastery takes months
Expensive subscription with no perpetual license option
No domain-specific scientific content; you build everything from scratch or from external assets
Overkill for straightforward schematic figures
Pricing: Available as part of Adobe Creative Cloud at approximately $264/year for a single app, or bundled with the full CC suite.
3. SciFig
Best for: Researchers who want to go from a text description to a publication-ready figure without learning any design software.
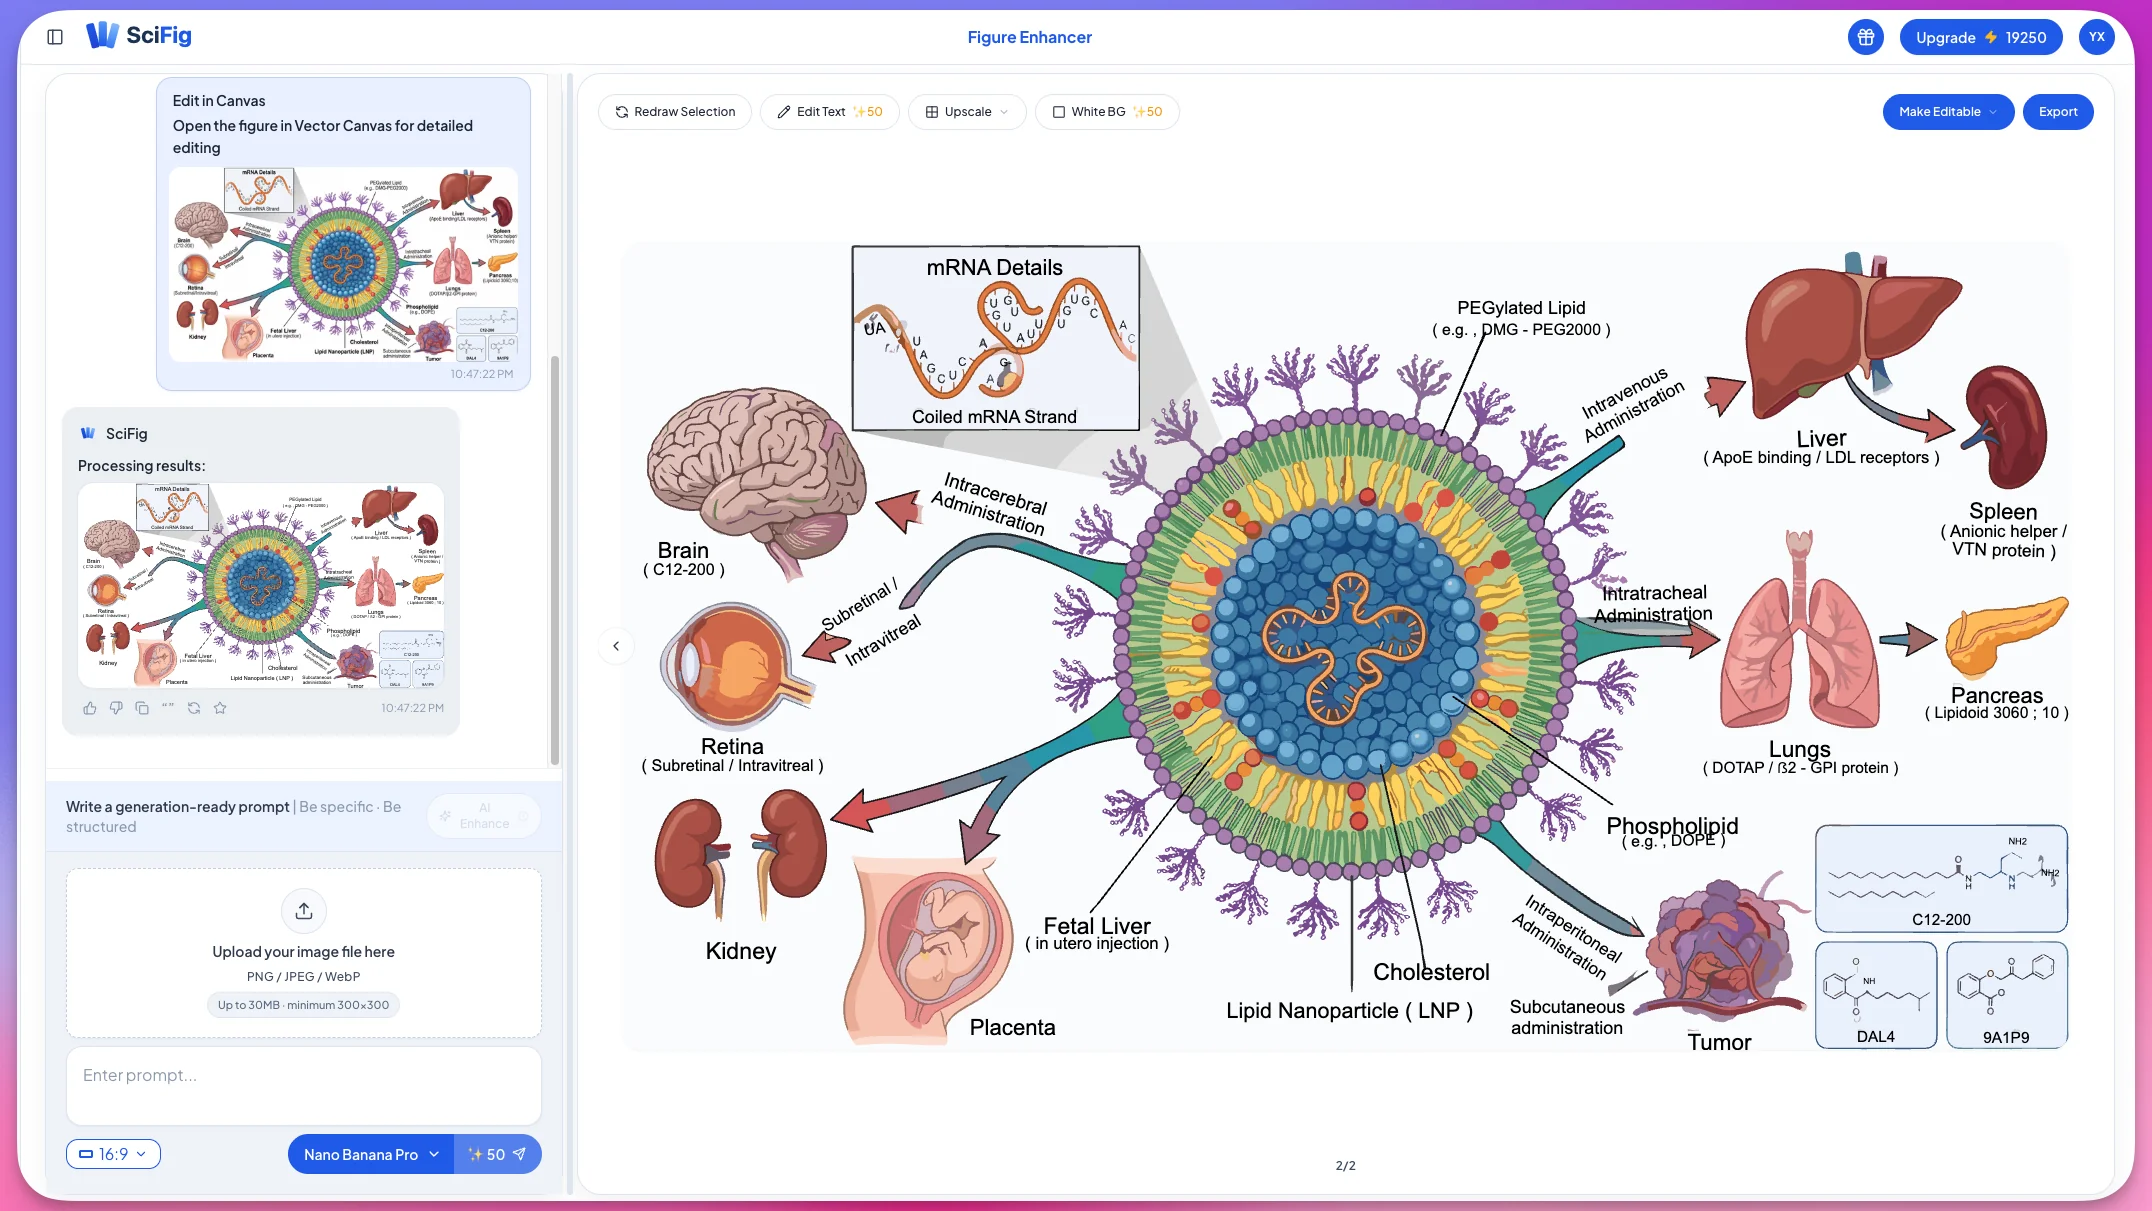
SciFig is an AI-native scientific figure platform built specifically for the research workflow. Rather than dragging icons or manipulating bezier curves, users describe the scientific figure they need in plain language — "a diagram showing CRISPR-Cas9 cutting a DNA double helix with a guide RNA" — and the AI text-to-figure generator produces a complete, domain-accurate illustration. The platform understands scientific terminology across biology, chemistry, physics, and medical research. For a tutorial on generating a specific figure type end-to-end, see our cell signaling pathways walkthrough.
SciFig AI figure generation
Pros:
No design skill required — natural language input produces complete figures
Covers a broad range of scientific domains, not limited to biology
Significantly faster than any drag-and-drop or manual approach for new scientific figures
Free tier available for experimentation
Output is vector-quality and suitable for journal submission
Cons:
AI generation results can vary — complex figures may require iterative refinement
Less suitable for charts and data visualizations (which are better handled by R or Python libraries)
Relatively newer platform compared to established tools; library depth is still growing
Pricing:Free tier available with limited monthly generations. Paid plans unlock higher output limits, advanced editing, and commercial licensing.
See AI Scientific Figure Generation in Action
Watch how researchers create publication-ready scientific figures from text descriptions.
Best for: Researchers creating infographic-style summaries, graphical abstracts, and science communication content.
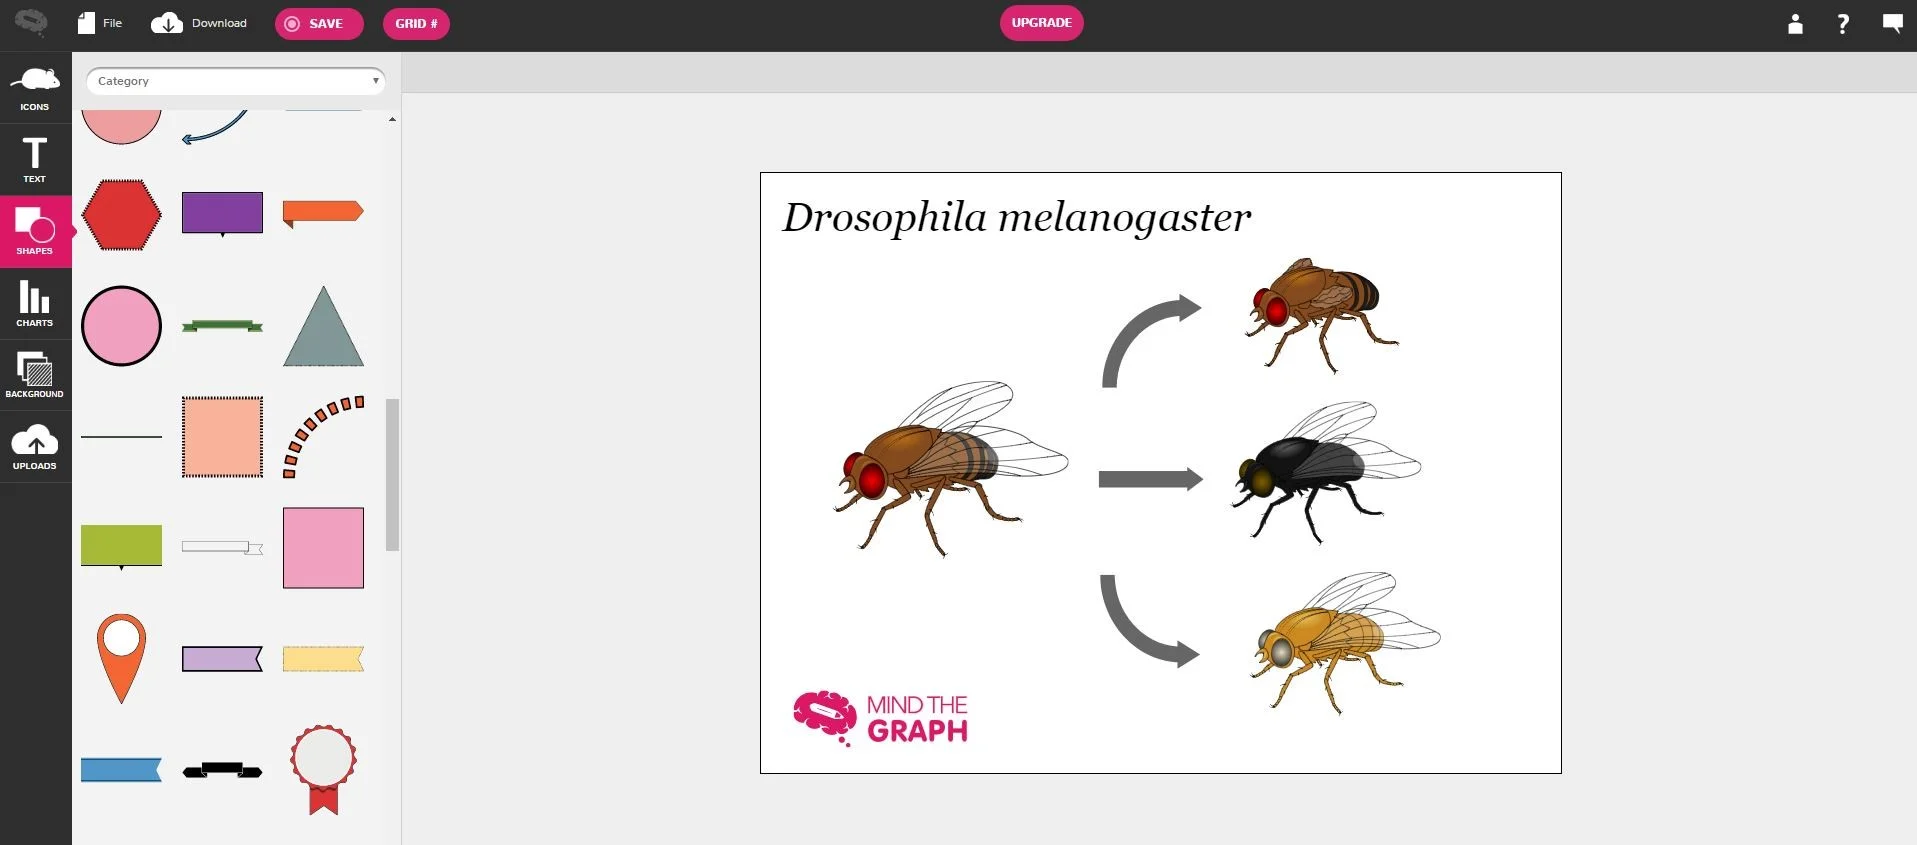
MindTheGraph occupies a niche between BioRender and general infographic tools. It offers a library of illustrated scientific icons combined with a layout system designed specifically for graphical abstracts, poster figures, and visual summaries intended for non-specialist audiences. If your goal is a shareable figure for social media, a conference poster's visual summary, or a journal's graphical abstract requirement, MindTheGraph's templates are well-calibrated for that use case.
MindTheGraph interface
Pros:
Templates designed specifically for graphical abstracts
Good balance between visual polish and ease of use
Icons span multiple scientific domains
Supports team collaboration on figures
Cons:
Less suited to detailed mechanistic or technical diagrams
The infographic aesthetic may not match all journal figure conventions
Free tier is limited; the full icon library requires a paid subscription
Pricing: Free tier available; paid plans start around $49/month or are available annually at a discount.
5. PowerPoint
Best for: Quick schematic figures, presentation slides, and researchers who need zero onboarding.
PowerPoint deserves an honest place on this list because a significant portion of figures in published papers are made with it — and for good reason. Its shape tools, SmartArt diagrams, and basic drawing capabilities are sufficient for flow charts, simple pathway schematics, and experimental design overviews. Every researcher already has it. There is no onboarding curve. For figures that are primarily boxes, arrows, and text labels, PowerPoint is often the fastest option.
Pros:
Zero learning curve for most researchers
Already installed and licensed for most academic users
Sufficient for flow charts, simple schematics, and process diagrams
Easy to iterate and share with collaborators
Cons:
Raster export at low default DPI — requires careful settings for print-quality output
Not a true vector editor; complex figures degrade when scaled
Limited precision for detailed illustrations
Figures often have a visually generic "PowerPoint look" that reviewers may notice
Pricing: Included in Microsoft 365, which most academic institutions provide free or at low cost.
6. SciDraw
Best for: Researchers on a tight budget who need specific, reusable scientific figure components.
SciDraw is a community-maintained repository of free, publication-quality SVG illustrations covering neuroscience, biology, chemistry, and related fields. Rather than generating figures, it provides a library of peer-contributed vector assets that researchers can download, customize, and incorporate into their figures. The quality is high because contributors are typically researchers themselves, and SVG files are fully editable in any vector editor.
SciDraw repository
Pros:
Completely free, with open licensing for most assets
High-quality SVG files editable in Illustrator, Inkscape, or any vector editor
Community contributions mean the library grows organically
Good coverage of neuroscience and systems biology imagery
Cons:
Requires a secondary vector editor to assemble complete figures
Coverage is uneven — some domains are well-represented, others have few assets
No drag-and-drop canvas; SciDraw is a source library, not a scientific figure-building platform
Pricing:Free. Open access, no subscription required.
Create Scientific Figures Now
Describe your scientific figure in natural language — get publication-ready illustrations in minutes.
Best for: Researchers who want full vector editing power without the Adobe Illustrator price tag.
Inkscape is the leading open-source vector graphics editor, and in 2026 it has matured into a genuinely capable tool for scientific figure work. It supports the full SVG standard, handles complex path operations, and can import and export to most formats that journals require. For researchers comfortable with a learning curve but unwilling to pay for Adobe software, Inkscape offers a compelling alternative — particularly when combined with free asset sources like SciDraw.
Pros:
Completely free and open source
Full-featured vector editor with support for complex path operations
Excellent SVG support — outputs are standards-compliant and editable
Active community with scientific figure-focused tutorials
Cross-platform (Windows, Mac, Linux)
Cons:
Steeper learning curve than drag-and-drop tools
Performance can lag on very complex files
Some advanced features (e.g., typography control) are less polished than Illustrator
No built-in scientific content library
Pricing:Free. Open source, no subscription required.
8. Illustrae
Best for: Researchers who want BioRender-style ease of use at a lower price point.
Illustrae is a newer entrant in the scientific figure space, positioning itself as an affordable drag-and-drop alternative to BioRender. It offers a growing icon library, a canvas-based interface similar to BioRender, and pricing structured to be accessible for individual researchers and smaller labs. The platform has been adding new scientific domains beyond biology, making it relevant for a broader range of researchers.
Pros:
More affordable than BioRender for comparable drag-and-drop functionality
Reasonable icon library for life sciences
Low barrier to entry for non-designers
Web-based, requires no software installation
Cons:
Smaller icon library than BioRender — gaps are more common in less-mainstream domains
Less established community and template ecosystem
Feature set is still maturing compared to longer-standing tools
Pricing: Paid plans available at lower price points than BioRender, with a free trial tier. Exact pricing varies — check their site for current rates.
9. BioDraws
Best for: R users who want to generate biological illustrations programmatically within their analysis workflow.
BioDraws is an R package that generates pre-built biological illustration templates programmatically, making it uniquely suited for researchers who already work in R for data analysis. Rather than a GUI canvas, figures are produced via R function calls — which means they can be integrated directly into R Markdown documents, Quarto reports, and reproducible research workflows. It covers common cell biology and molecular biology components.
BioDraws templates
Pros:
Fully integrates with R-based research workflows and reproducible documents
Programmatic generation means figures are version-controlled alongside code
Free and open source
Useful for automating figure generation across multiple experiments
Cons:
Limited to R users — not accessible without programming knowledge
Template library is smaller than GUI-based tools
Less suitable for complex, highly customized figures
Requires combining with other R graphics packages for complete figure layouts
Pricing:Free. Available on CRAN and GitHub.
10. ChemDraw
Best for: Chemists and biochemists who need accurate chemical structure drawings.
ChemDraw is the undisputed standard for chemical structure illustration in chemistry, biochemistry, and pharmaceutical research. It handles 2D and 3D molecular structures, reaction schemes, and stereochemistry with accuracy that general-purpose design tools cannot replicate. For any figure that involves chemical structures — from simple molecules to complex synthesis pathways — ChemDraw's output is journal-expected and reproducible from structure data.
Pros:
Industry-standard for chemical structure representation
Integrates with databases and molecular modeling tools
Long-standing tool with wide institutional licensing
Cons:
Domain-specific — only valuable for chemistry-focused figures
Expensive without institutional access
Not a general-purpose figure tool; needs to be combined with other software for complete figures
Pricing: Individual licenses are expensive (several hundred dollars); most academic researchers access it through institutional site licenses provided by their institution.
Comparison Table
The following table summarizes the key attributes of each tool to support quick decision-making:
Quick comparison table of 10 scientific figure tools across price, learning curve, AI capability, and best use case (Figure generated with SciFig)
Tool
Type
Best For
Pricing
AI-Powered?
BioRender
Icon library / drag-and-drop
Life science figures
~$400/yr (academic)
No
Adobe Illustrator
Vector editor
Complex custom artwork
~$264/yr
No
SciFig
AI generator
Text-to-figure, all domains
Free tier + paid
Yes
MindTheGraph
Infographic builder
Graphical abstracts
From ~$49/mo
No
PowerPoint
Presentation software
Quick schematics
Included in M365
No
SciDraw
SVG asset library
Free reusable components
Free
No
Inkscape
Vector editor
Free vector editing
Free
No
Illustrae
Icon library / drag-and-drop
Affordable BioRender alternative
Paid (lower than BioRender)
No
BioDraws
R package
Programmatic R workflows
Free
No
ChemDraw
Chemistry-specific
Chemical structures and reactions
Institutional / expensive
No
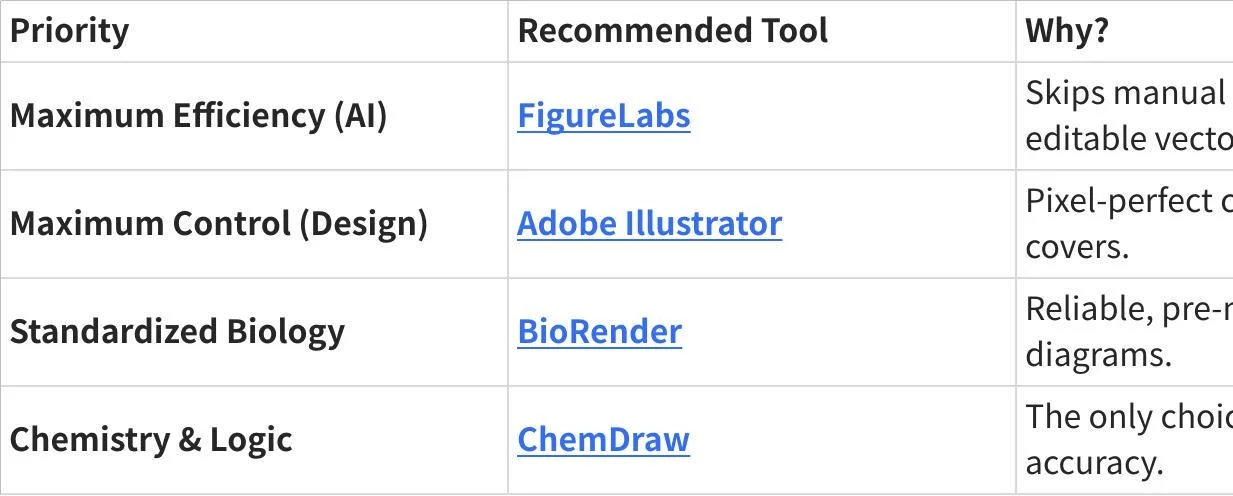
Which Scientific Illustration Tool Should You Choose?
Picking the right scientific figure tool depends on three factors: your domain, your design skill level, and your time budget.
If you are a life scientist building standard pathway or experimental design figures, BioRender remains the most polished option. Its icon library and consistent visual style will produce professional results faster than learning a vector editor. The cost is justified if you publish regularly.
If you need figures outside the biology domain — or if you want to go from a description to a complete figure without learning any interface — SciFig's AI generation covers the widest range of scientific subjects with the lowest time investment. It is especially useful for researchers who know what they want to show but lack the design hours to build it manually.
If you need maximum creative control and publish complex, highly customized figures, invest the time in Adobe Illustrator. No other tool matches its precision, and the skill compounds across every future figure you make.
If budget is the primary constraint, the combination of Inkscape + SciDraw provides a capable, fully free stack for vector-quality output. Add BioDraws if your workflow is R-based and reproducibility is a priority. For a full two-phase workflow that combines AI generation with free refinement tools, see our Nature-level figures on a budget guide.
For graphical abstracts and science communication content, MindTheGraph's templates are purpose-built for that use case and will save meaningful time over assembling layouts from scratch.
For chemistry-specific figures, ChemDraw is not optional — it is the standard, and most institutions provide access. Use it in combination with a general-purpose vector editor for complete figures.
The scientific figure tools that serve most researchers best are not necessarily the most expensive or the most technically capable — they are the ones that match your actual workflow, get out of your way, and let you spend your time on the science.
If you want to move from comparison to action, SciFig's text-to-figure, sketch-to-figure, and vector-canvas cover the strongest AI-native workflow on this list. If you prefer a flatter, search-style entry point first, the AI scientific image generator is the fastest way to test whether a figure-generator workflow fits your research style.
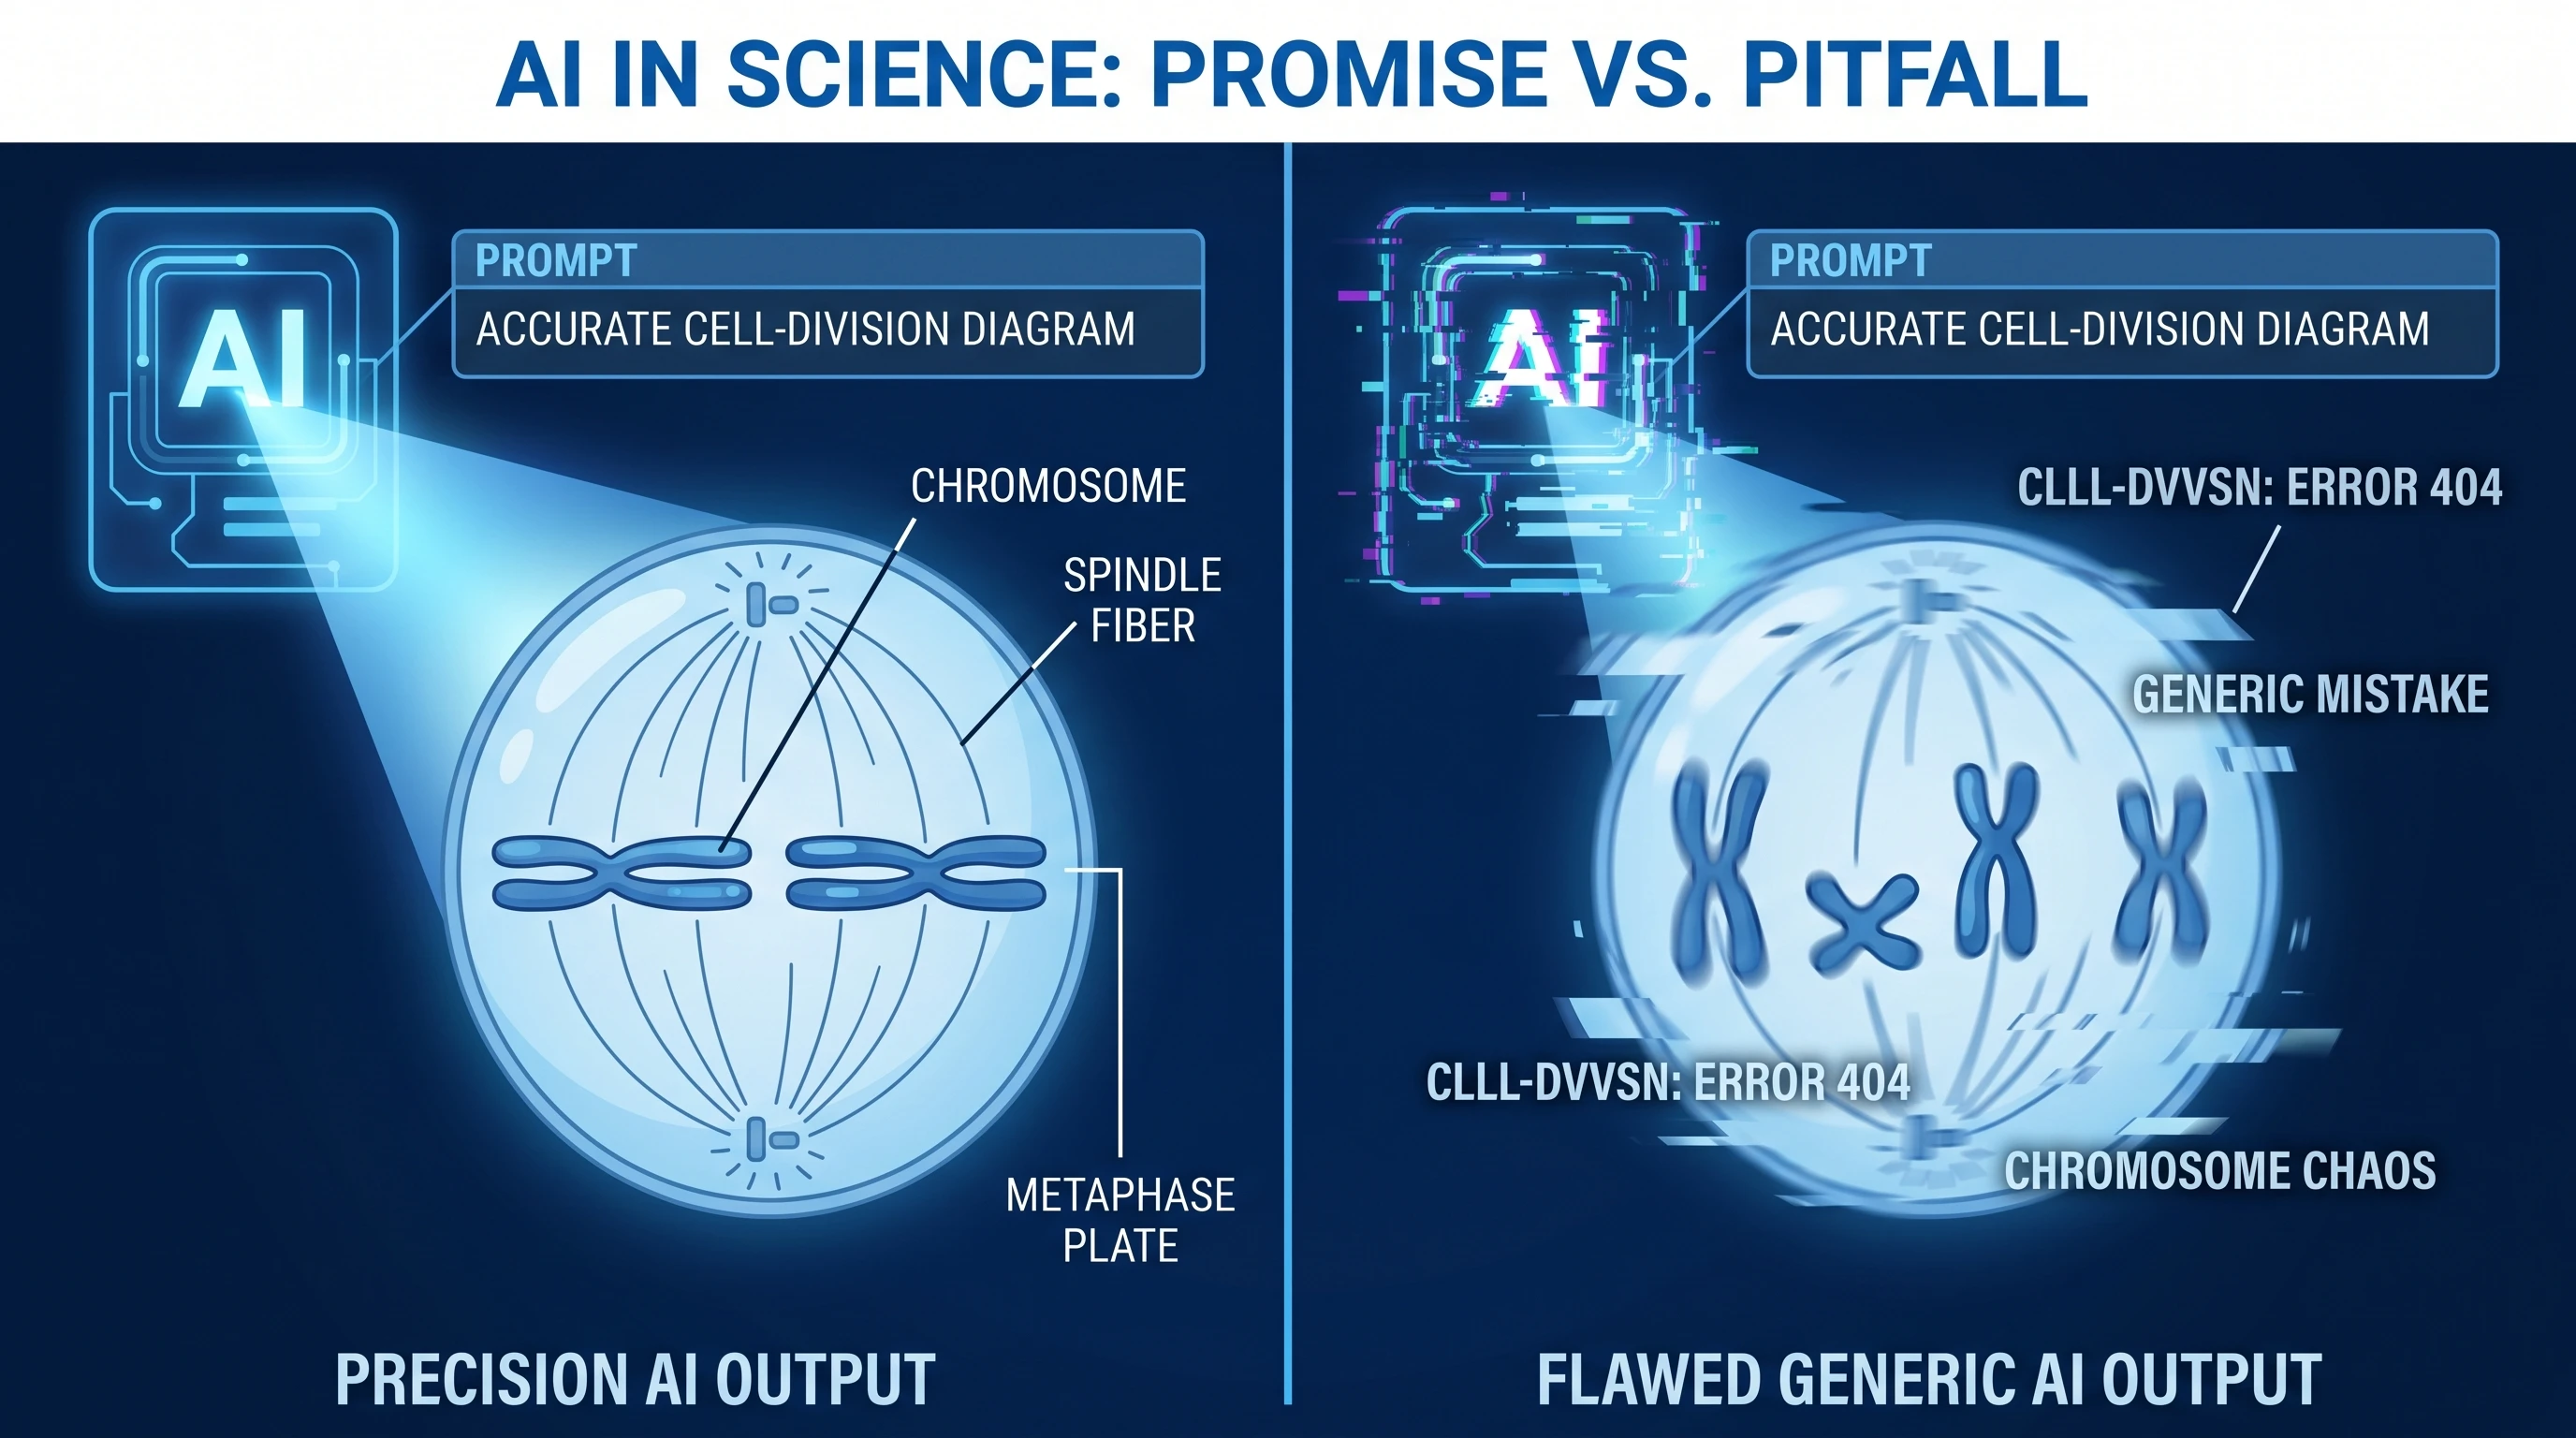
Best AI for Scientific Diagrams vs Best Traditional Tool
One useful way to read this ranking is to separate “best overall scientific figure tool” from best AI for scientific diagrams. The overall winner depends on workflow maturity, figure type, and existing licenses. The AI winner depends on something narrower: how well a tool turns a rough research description into a correct first draft and how easily that draft can be fixed.
If your diagrams are standard and repetitive, a traditional library tool can still be the best value. If your diagrams are novel, niche, or mechanism-heavy, AI-native tools rise quickly because they remove the catalog ceiling. That is why the more practical question in 2026 is often not just “which software is best?” but “which workflow gets me to a reviewer-safe scientific diagram fastest?”
Frequently Asked Questions
For free options, Inkscape (full-featured vector editor) and SciDraw (community SVG library) are the strongest combination. SciFig also offers a free tier for AI-generated figures. BioDraws is free for R users. The best free tool depends on your domain and whether you prefer GUI or programmatic workflows. For a complete free workflow walkthrough, see our Nature-level figures on a budget guide.
Yes, with the right tool and some iterative refinement. AI-native platforms like SciFig are designed specifically for scientific domains and understand terminology, experimental conventions, and figure structure. The output quality for conceptual illustrations, pathway diagrams, and process figures has reached publication-ready levels for many use cases. Charts and data visualizations are still better handled by R or Python libraries.
For life scientists who regularly produce figures for publications, BioRender's ~$400/year cost is typically justified. The time saved over manual illustration, combined with the professional quality of the output, often exceeds the subscription cost when measured against researcher hourly rates. For researchers who only occasionally need figures, the free tier of AI tools or SciDraw may be more cost-effective.
Biology-specific tools (BioRender, BioDraws) have limited value outside their domain. SciFig is designed for broad scientific coverage including chemistry, physics, neuroscience, and medicine. Adobe Illustrator and Inkscape are domain-agnostic but require design skill. ChemDraw is the standard for chemistry specifically.
This depends on the tool and the journal. BioRender requires a citation in figure legends for published work (e.g., "Created with BioRender.com"). Most journals have accepted this as standard practice. AI-generated figures from platforms like SciFig should be disclosed according to the journal's AI content policy — which varies by publisher. Always check the specific journal's author guidelines before submission.
The best AI for scientific diagrams is usually the tool that balances accuracy, editability, and speed. It needs to do more than render attractive science-shaped art — it must preserve structure, support label correction, and fit into a paper or poster workflow. For most research use, the best AI tool is the one with the strongest correction loop, not just the strongest first image.
The best website for a scientific figure generator is the one that makes the whole workflow coherent: prompt input, revision, export, and scientific credibility. Researchers need more than a gallery of outputs; they need a place where figures can be generated, fixed, and reused. Website quality in this category depends on workflow depth, not on surface design alone.
Recommended next
Related scientific figure resources
Go deeper with the most relevant SciFig pages for this article.