PPT Text To Visual Converter
Turn your ppt text, bullet points, and research notes into clear professional visuals — SciFig's text to visual converter generates editable diagrams for your slides in seconds.
Figure prompt
Core Subject (e.g., Cas9 protein cutting DNA)
Action / Details (e.g., Double strand break, detailed molecular view)
Start with 100 free credits|No credit card required
Get up to 300 free credits on day one when you join through an invite.
Reviewed by SciFig TeamUpdated
PPT Text To Visual Converter— templates & examples
Everything you need to convert ppt text into visuals
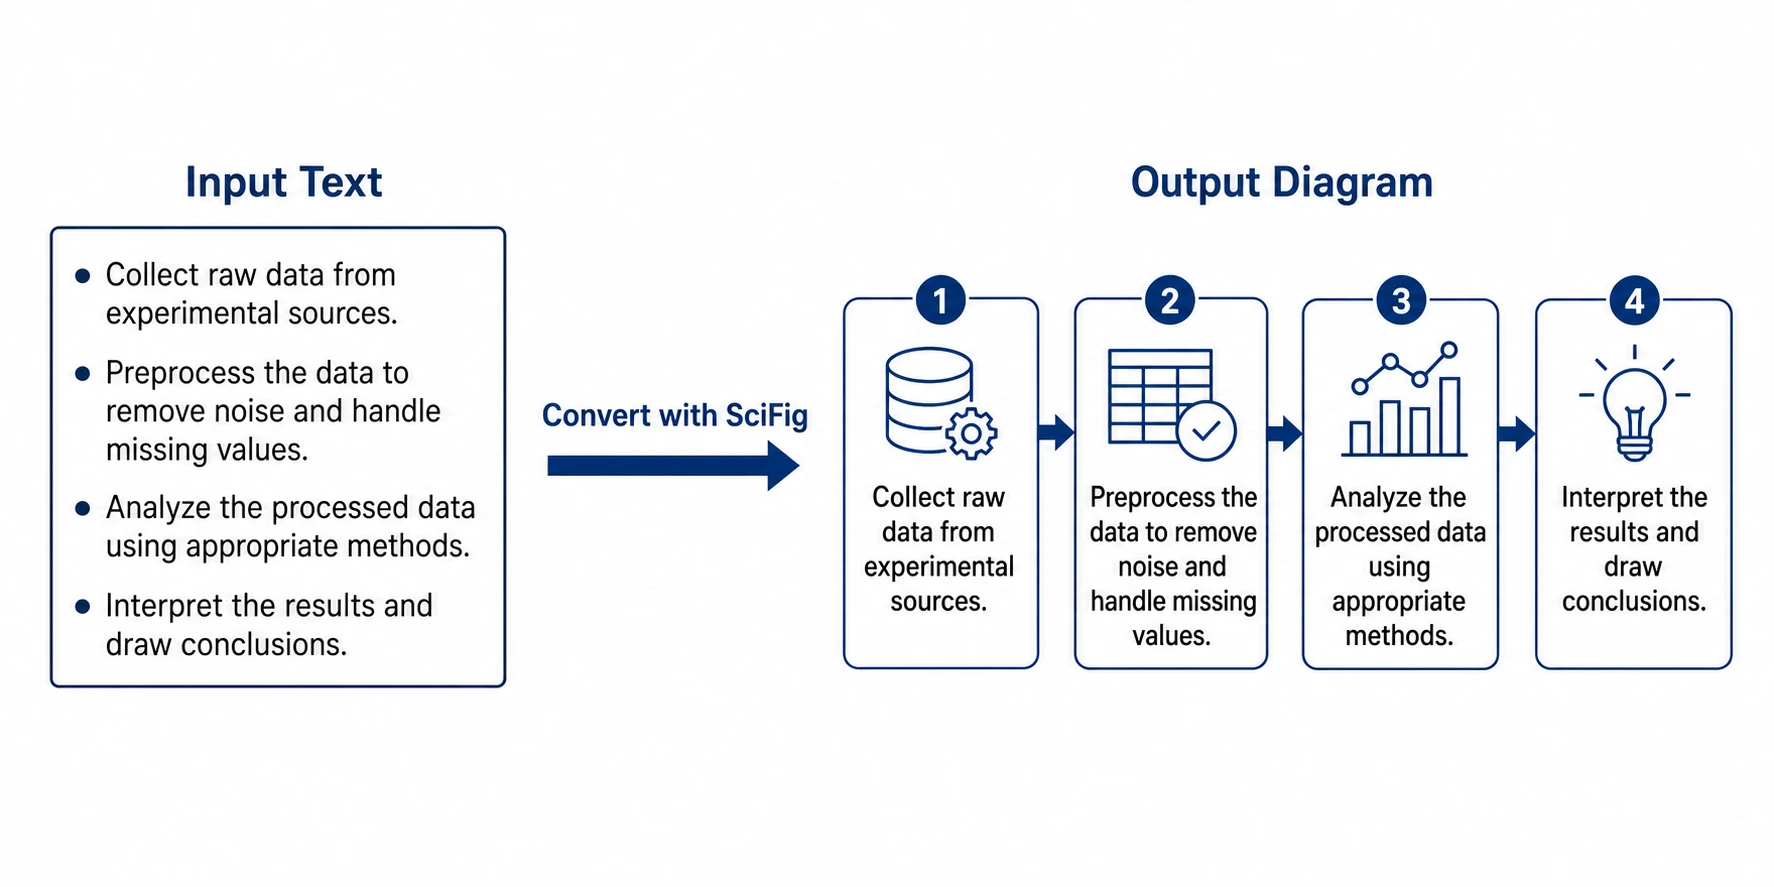
Paste your ppt text, get a professional visual instantly
Dense bullet points and long text blocks lose audiences in presentations. SciFig's text to visual converter takes your ppt content — research steps, comparison lists, hierarchical outlines, or process descriptions — and converts it into a clean, labeled diagram or figure in seconds. No design skills required. Just paste your text, specify the visual type, and download a publication-ready figure for your slide. It is the fastest ai to convert text into diagram for ppt that researchers and educators can use without leaving their workflow.
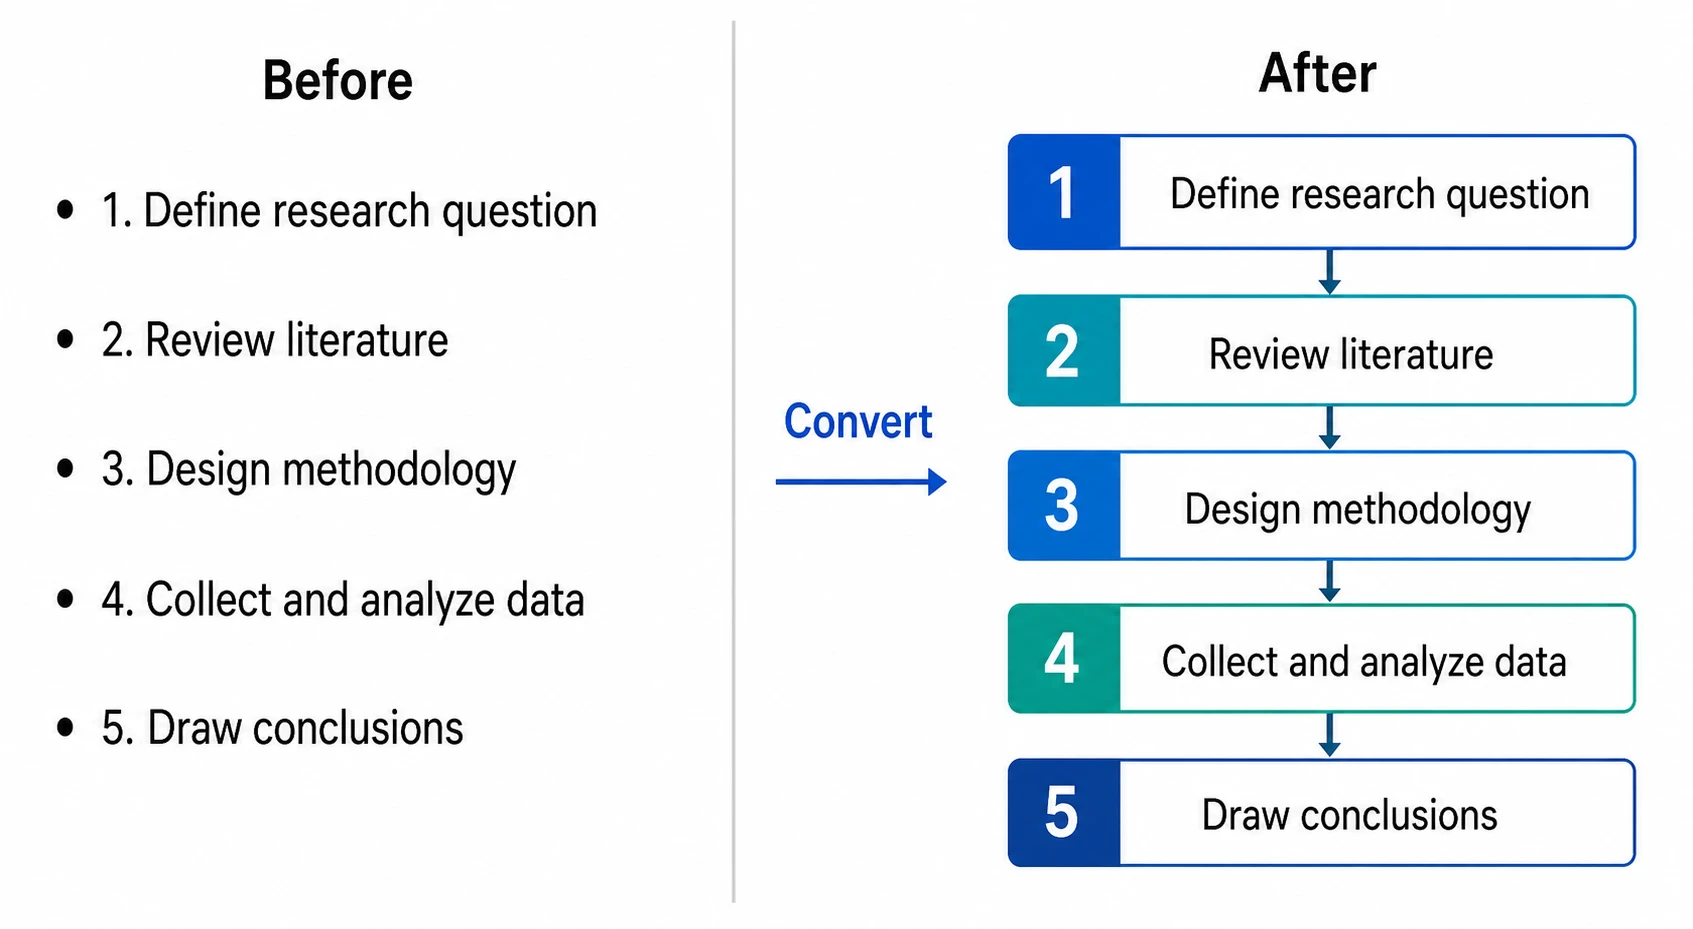
Convert any text structure into the right diagram type
Not all ppt text should become the same kind of visual. SciFig's text to visuals AI for ppt content reads the structure of your input and suggests or generates the most appropriate figure: sequential steps become flowcharts, parallel alternatives become comparison figures, nested categories become tree diagrams, and mixed concepts become concept maps. The tool adapts to your content, so you never have to manually pick a template or drag shapes into position.
Edit and export ppt visuals at presentation resolution
Generated visuals are fully editable — rename nodes, adjust colors to match your slide theme, resize elements for single-column or full-slide layouts, and add or remove components as your ppt content evolves. Export at screen resolution for slide decks or at print resolution for conference posters and handouts. Every visual is a fresh, original figure you own completely.
What is a visual?
A text to visual converter transforms written content — bullet points, process descriptions, or research notes — into a structured visual such as a diagram, flowchart, or concept map. For researchers preparing presentations, turning ppt text into a clear visual is time-consuming. With SciFig you paste your ppt content, describe the visual type, and receive a publication-ready figure in seconds — fully editable and free from copyright restrictions.
Why you need a text to visual converter for your PPT
- Audiences absorb visual information faster than text-heavy bullet point slides
- Converting ppt text to a diagram reduces cognitive load and increases recall
- Manually designing slides from text is time-consuming and requires design expertise
- Academic and technical presentations require clean, accurate figures — not clip art
- Letting the AI handle layout means you spend your time on the content, not on dragging shapes
- Publication-ready visuals elevate the perceived quality of your ppt presentation
What SciFig's text to visual converter can generate
- Flowcharts — sequential steps and decision points for process descriptions
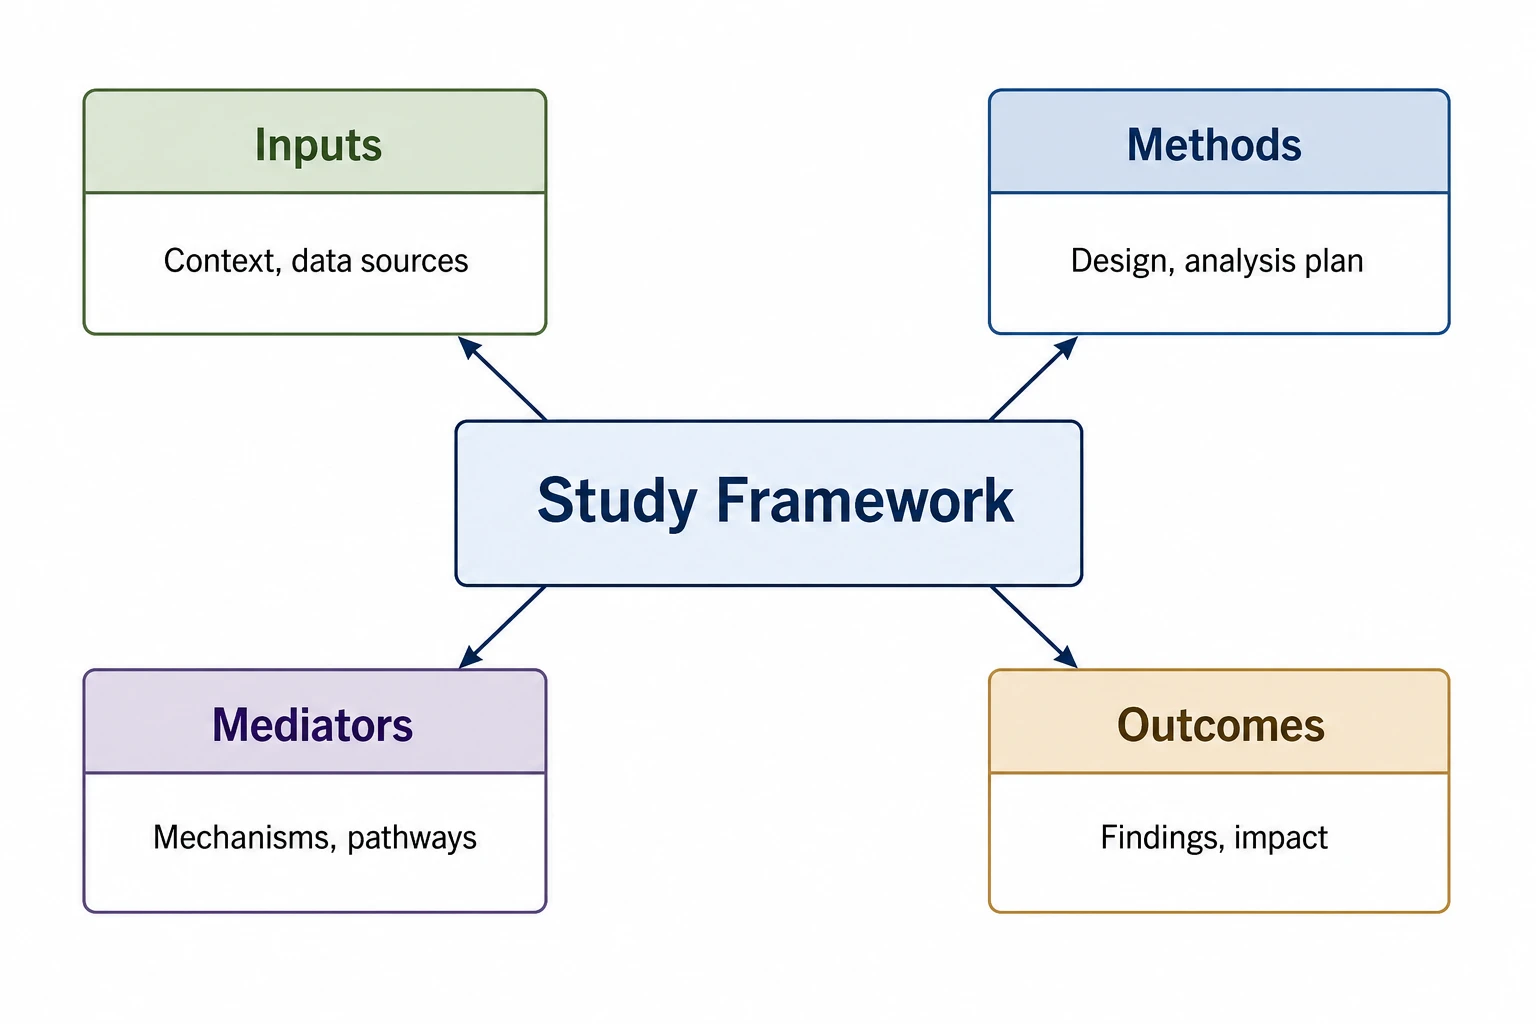
- Concept maps — nodes and relationships showing how ideas connect in your research
- Comparison figures — side-by-side tables or Venn diagrams for contrasting items
- Tree diagrams and hierarchies — nested categories and parent-child relationships
- Timelines — chronological sequences for historical context or study phases
- Mind maps — radial diagrams branching from a central concept for brainstorming slides
Where the ppt text to visual converter is used
- Academic conference presentations converting research findings into slide figures
- University lecture slides transforming dense content into visual explanations
- Research grant presentations where clear visuals communicate complex proposals
- Technical training materials turning written procedures into flowchart visuals
- Thesis defense slides converting literature review notes into concept maps
- Corporate and scientific team presentations replacing bullet-point walls with clear diagrams
How to make a visual
Describe your visual
Tell SciFig what to draw in plain language — no design tools required.
Generate with SciFig
Get a clean, publication-ready figure that matches your description in seconds.
Edit & export
Vectorize it into editable SVG, relabel everything, and export for your paper, poster, or slides.
PPT Text To Visual Converter — Frequently Asked Questions
Common questions about PPT Text To Visual Converter.
More tools

Conceptual Framework Generator
Create professional conceptual framework diagrams showing variable relationships, hypotheses, and theoretical models for your research.

Free Body Diagram Generator
Create accurate, publication-ready free body diagrams with labeled force vectors for weight, normal force, friction, and tension in seconds.

Bell Curve Generator
Generate a precise, fully labeled bell curve showing mean, standard deviations, and percentile regions — ready to export for your paper, thesis, or classroom.
Related links
Home
Turn text, sketches, references, PDFs, and photos into Scientific Figures
Text-to-Figure
Generate a figure from a plain-language description
Models
Default to GPT Image 2 for journal papers; switch to Nano Banana Pro for slides and posters; pick Nano Banana 2 for routine figure work
Tutorials
Seven short walkthroughs of the AI scientific figure generator
Blog
Tutorials, tool comparisons, and publication tips for researchers.
Inspiration
Explore publication-ready scientific figure examples, copy the prompts, and use them as starting points for your own work.

Ready to publish?
Make your own visual in minutes.
Start for freeFree to start · No credit card required · Built for researchers