Ends Dec 1, PT
SciFig
Get Started Free

Turn your process into a flowchart

free and fully editable

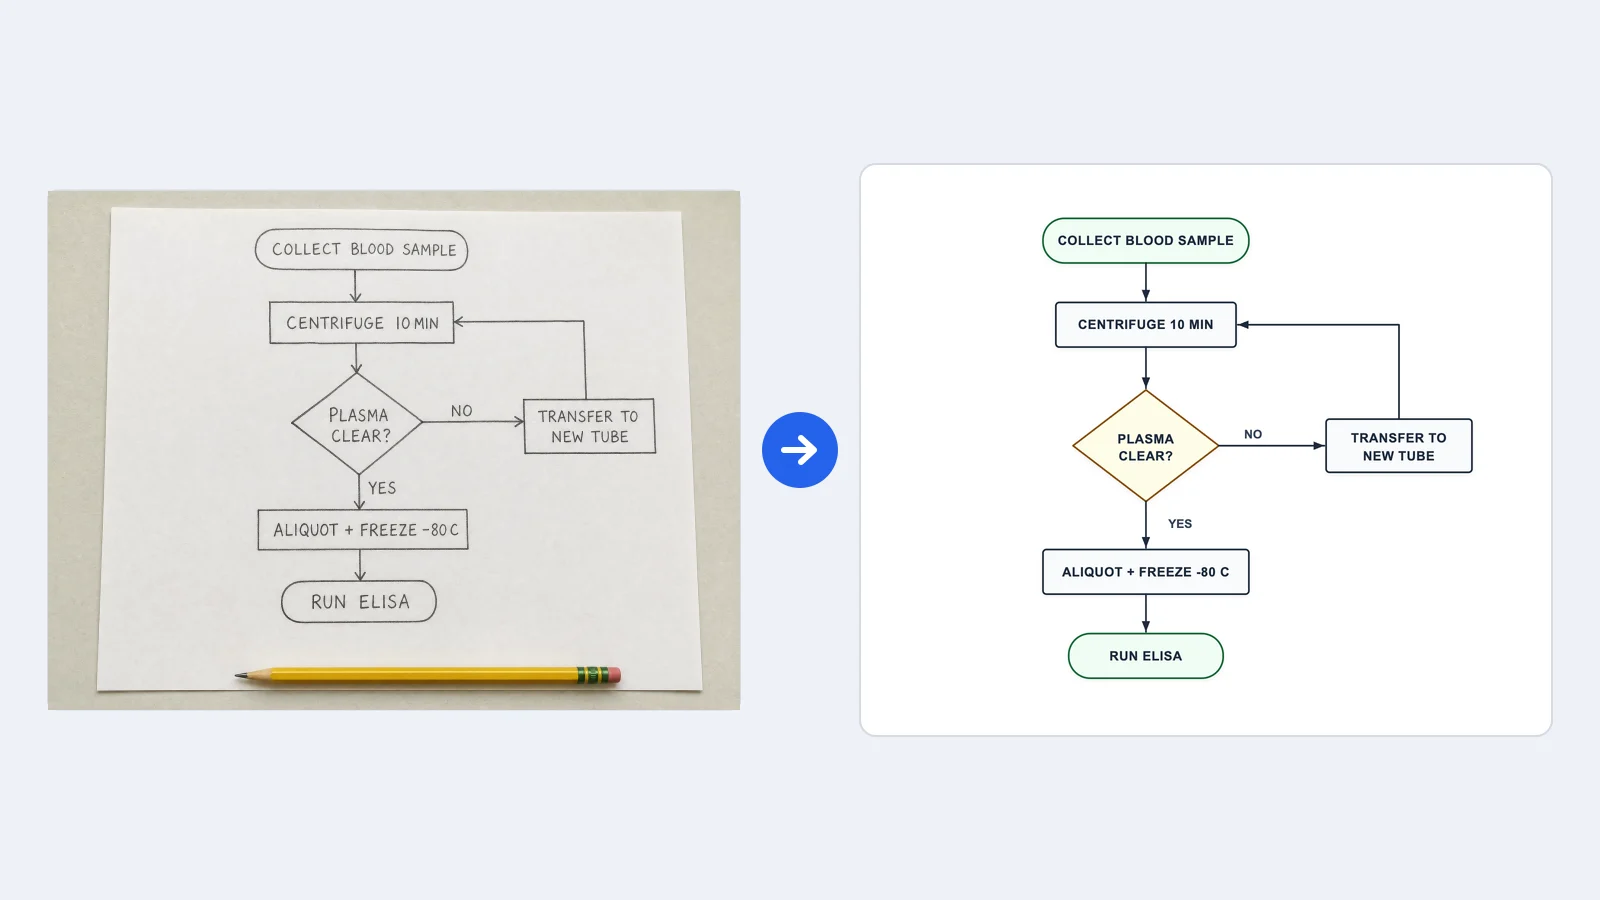
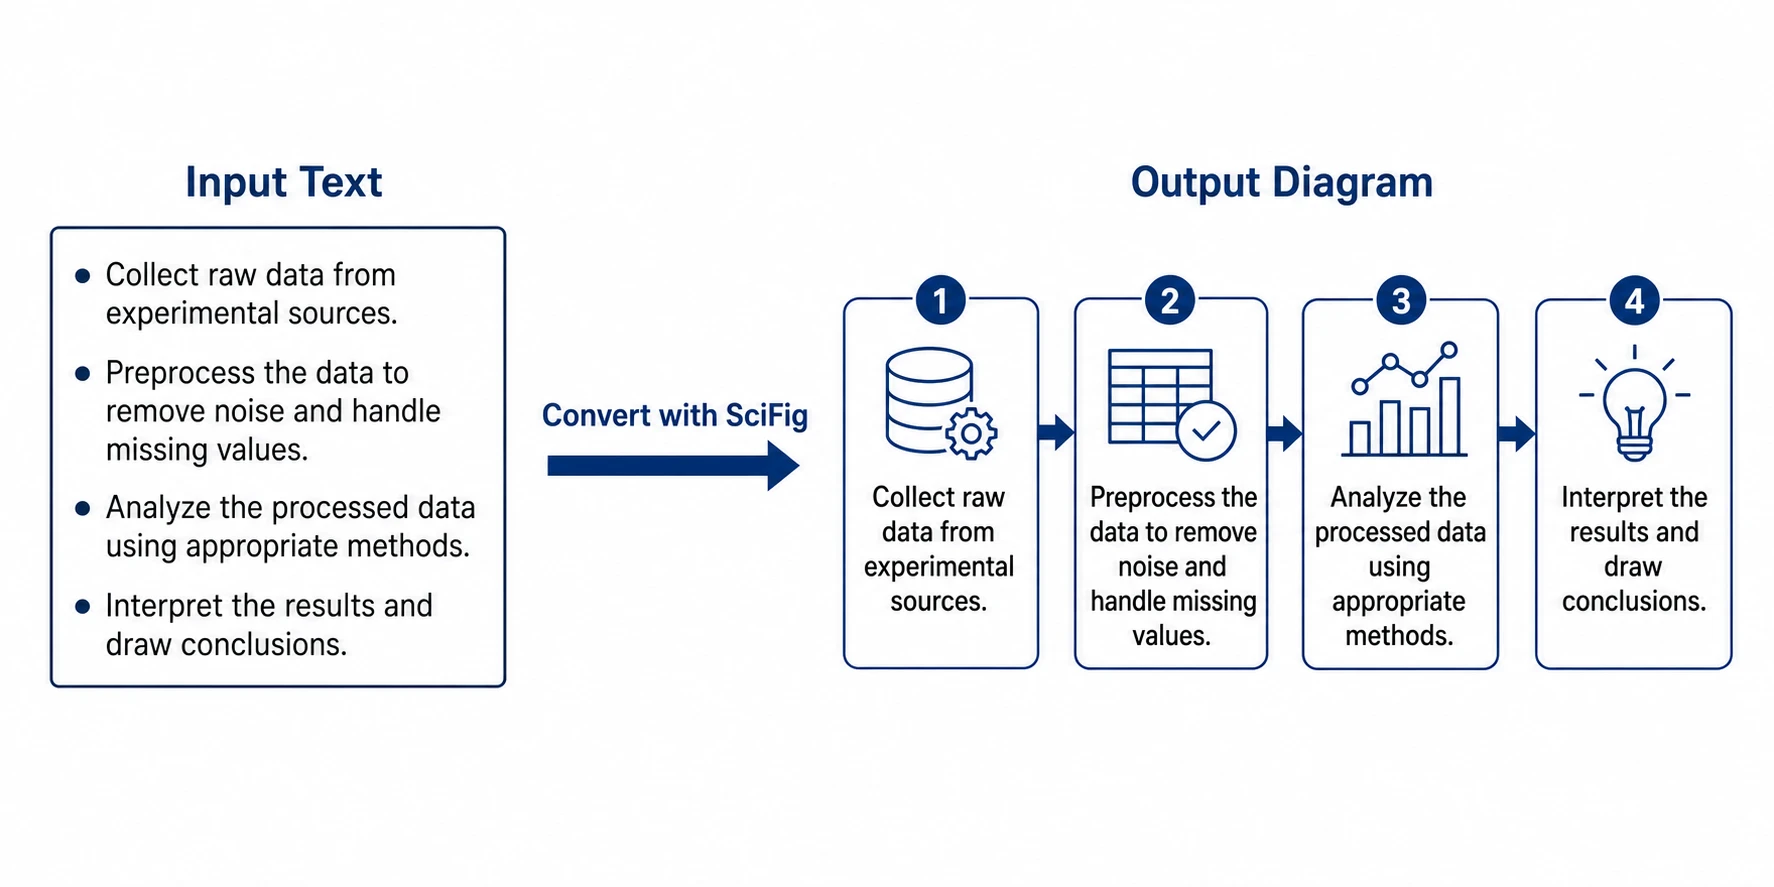
Describe your methods or upload a PDF, Word file, or image — edit every node and arrow, export to SVG or PPTX.

Describe what you need in the box above.

Start with up to 150 free credits|No credit card required

Get up to 250 free credits on day one when you join through an invite.

3 figure engines · 500+ templatesEvery label editable · 60+ color schemesEditable PPTX · Layered SVG · 8K PNG / JPG

Flowchart Templates

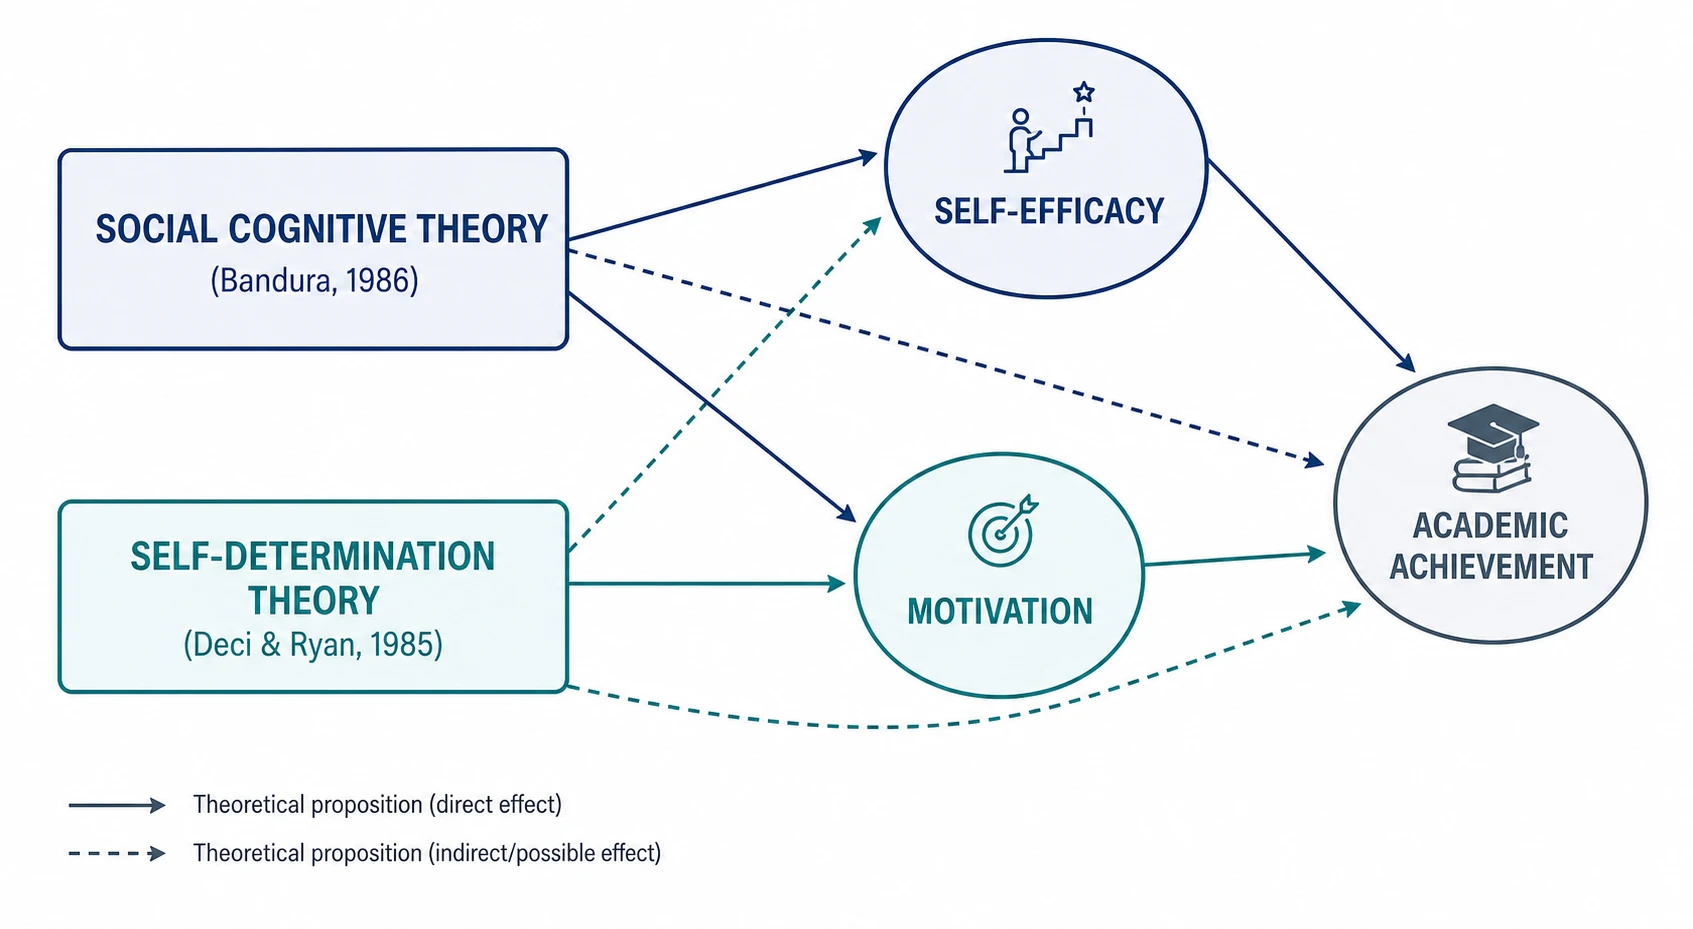
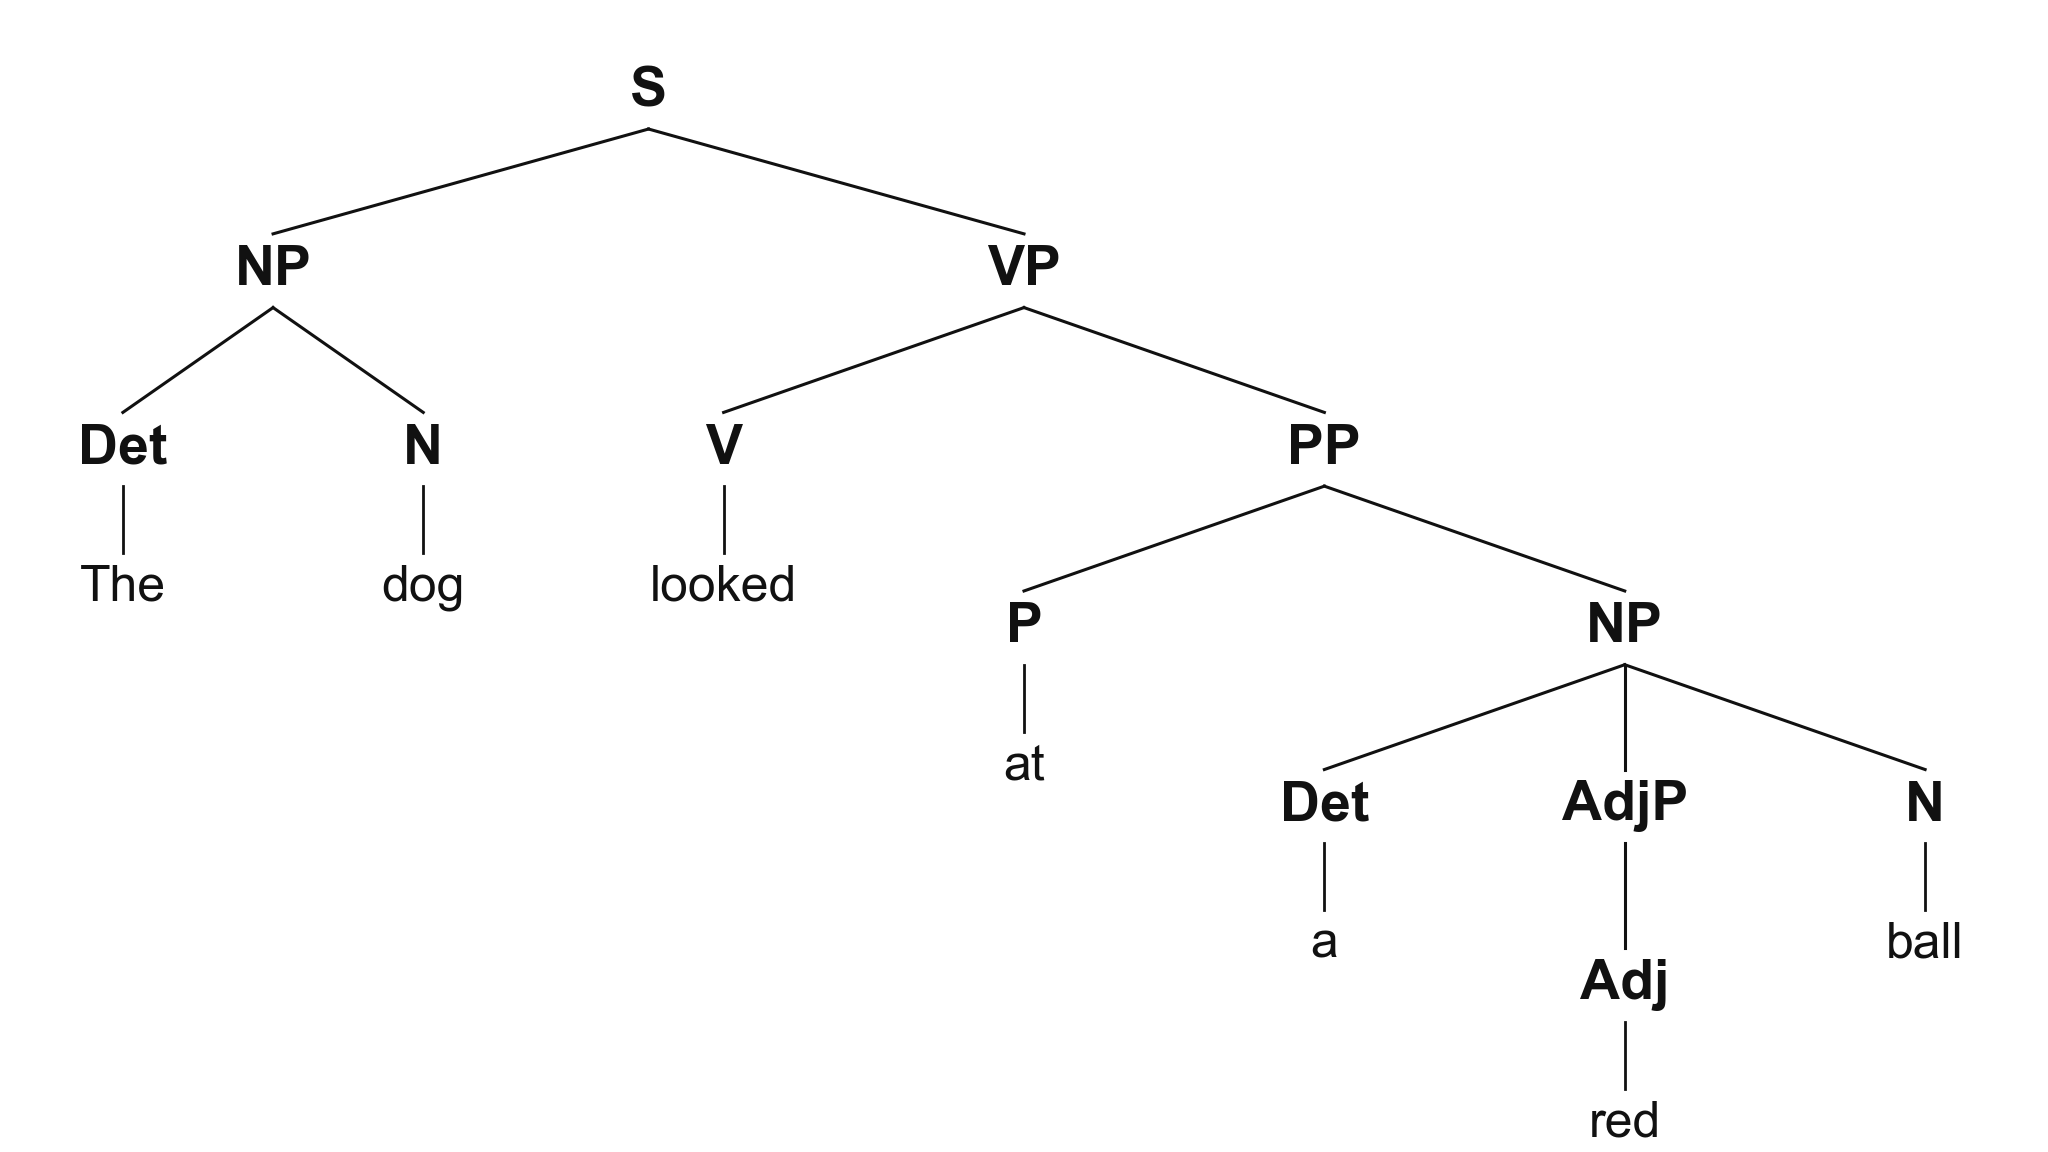
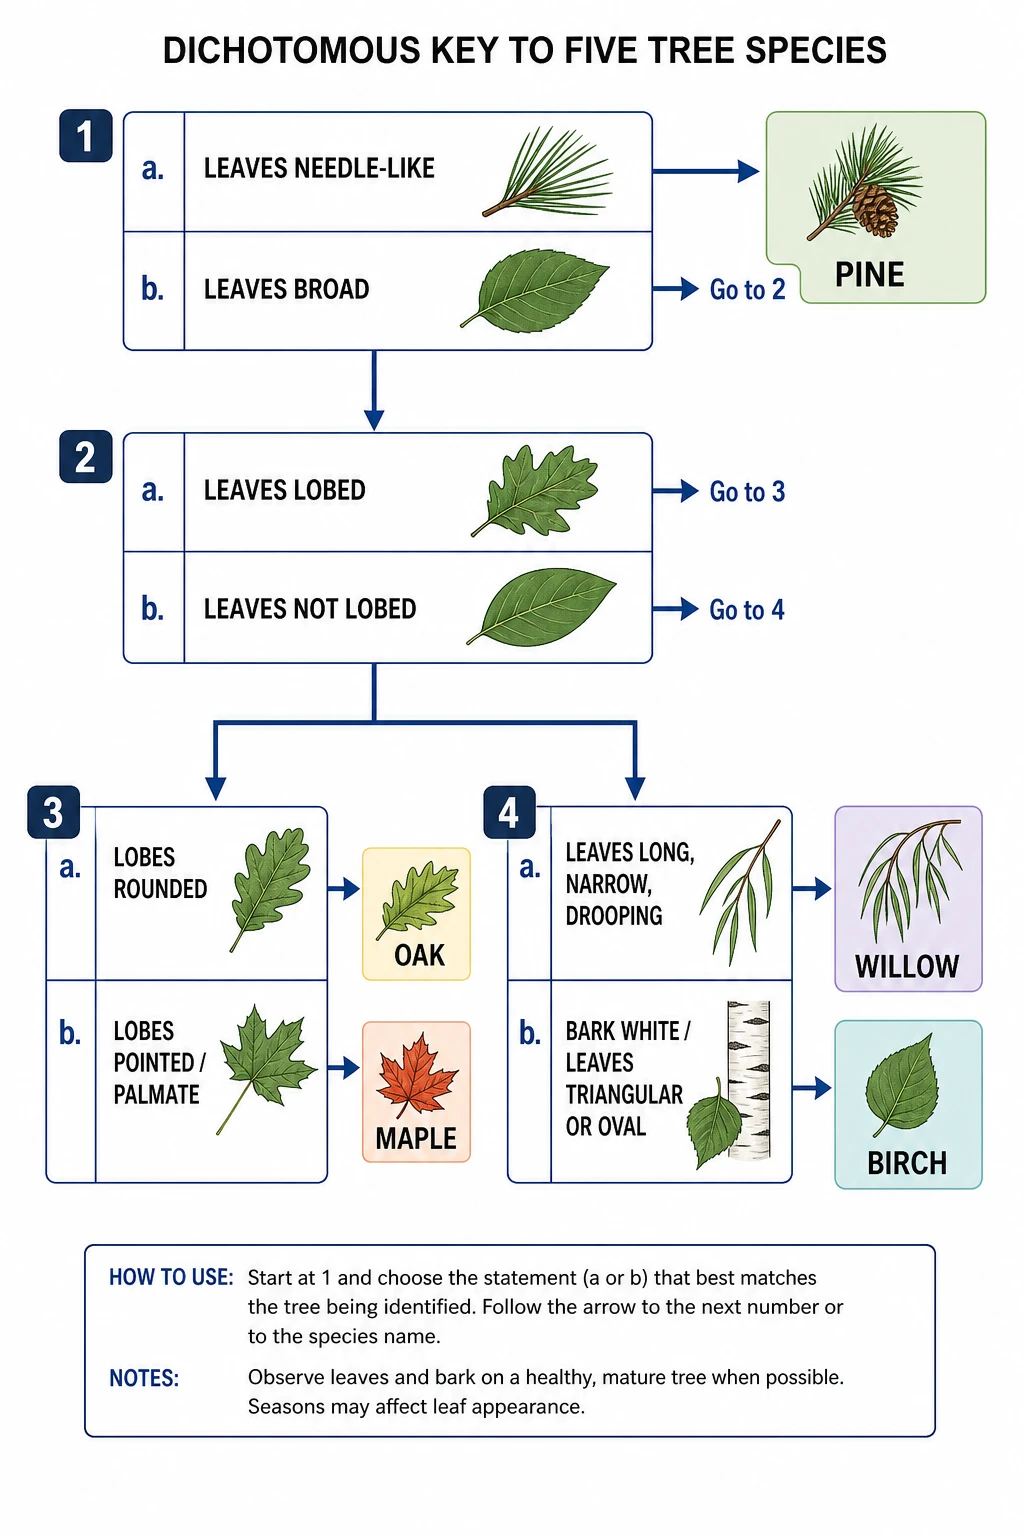
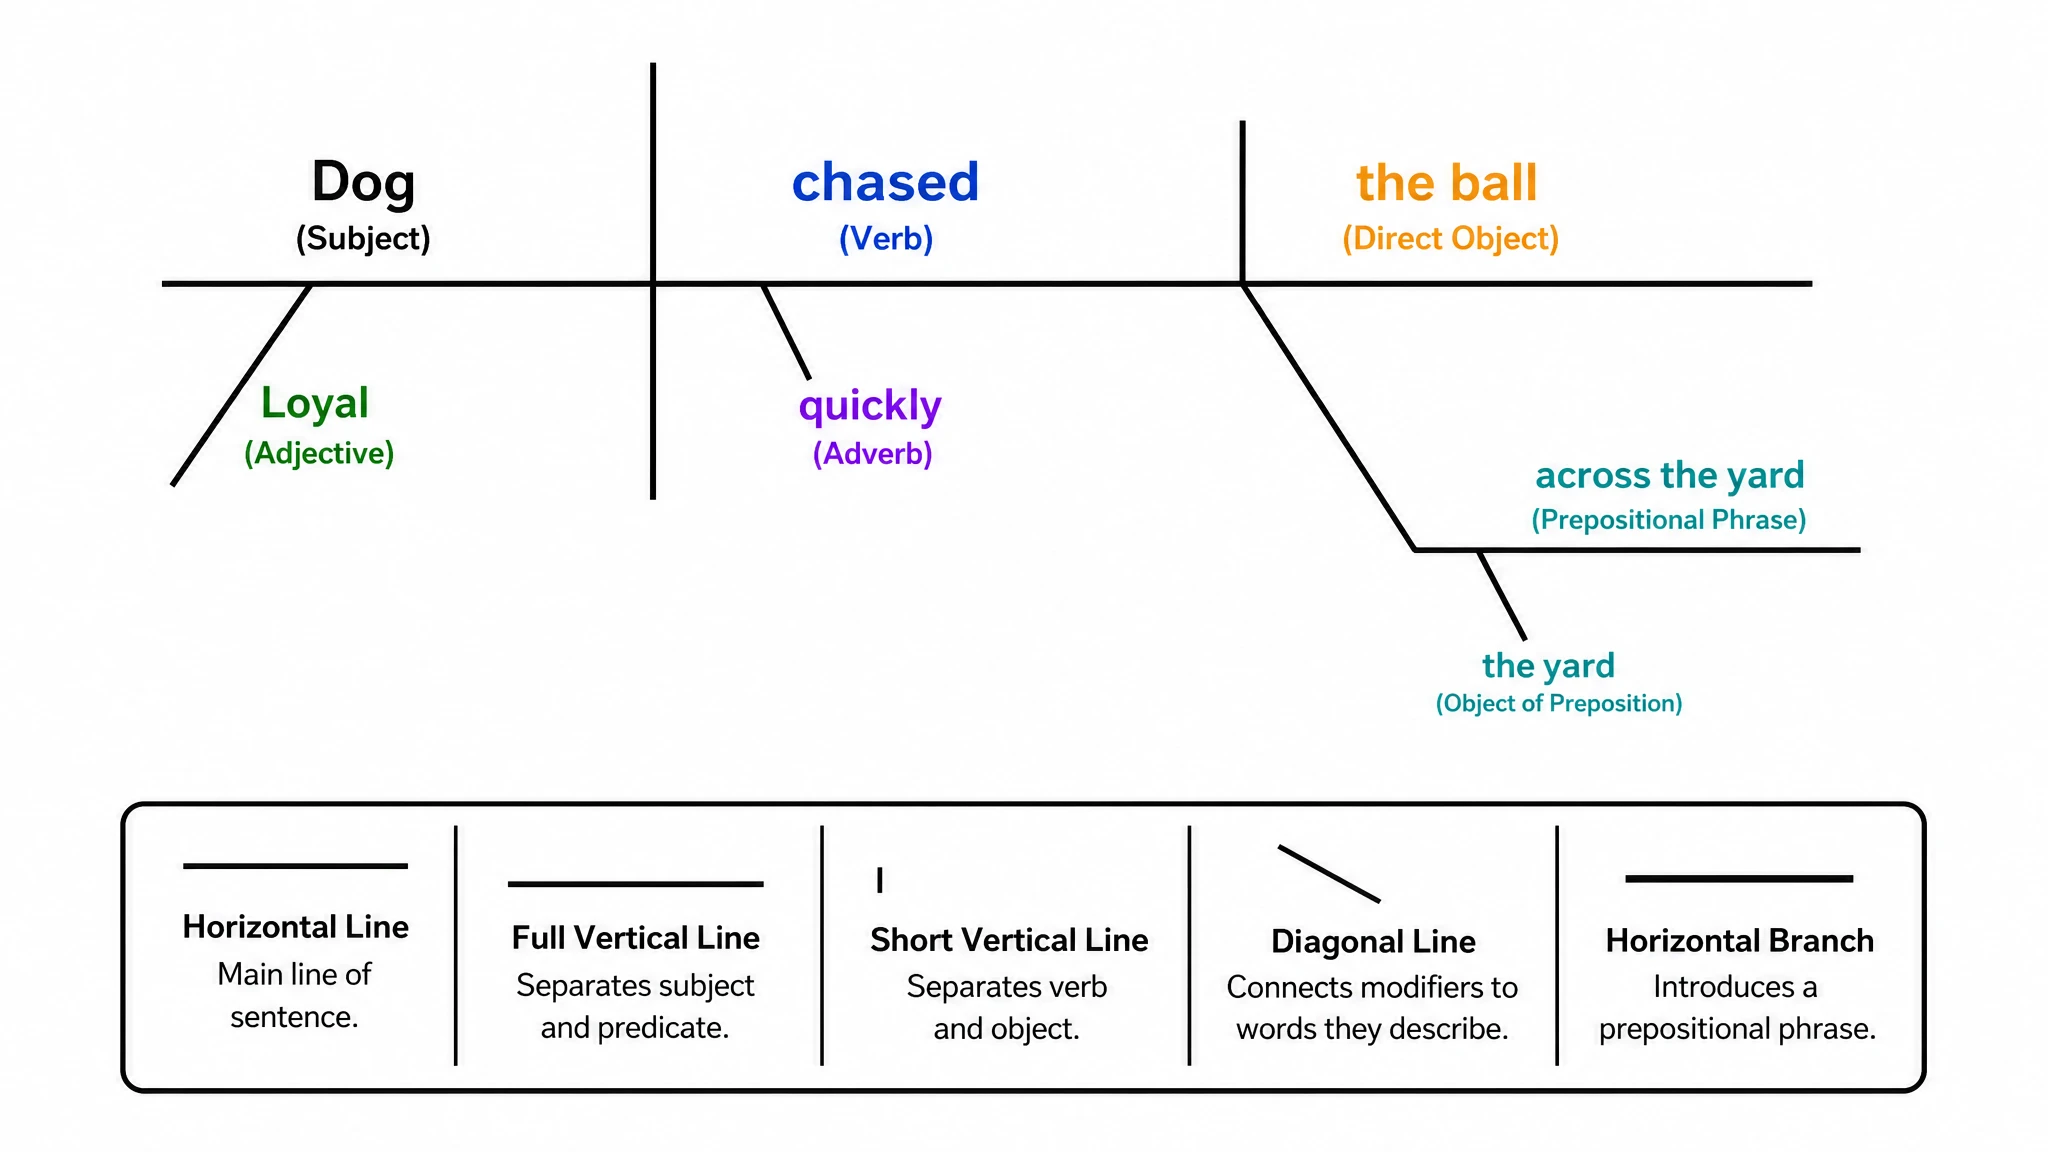
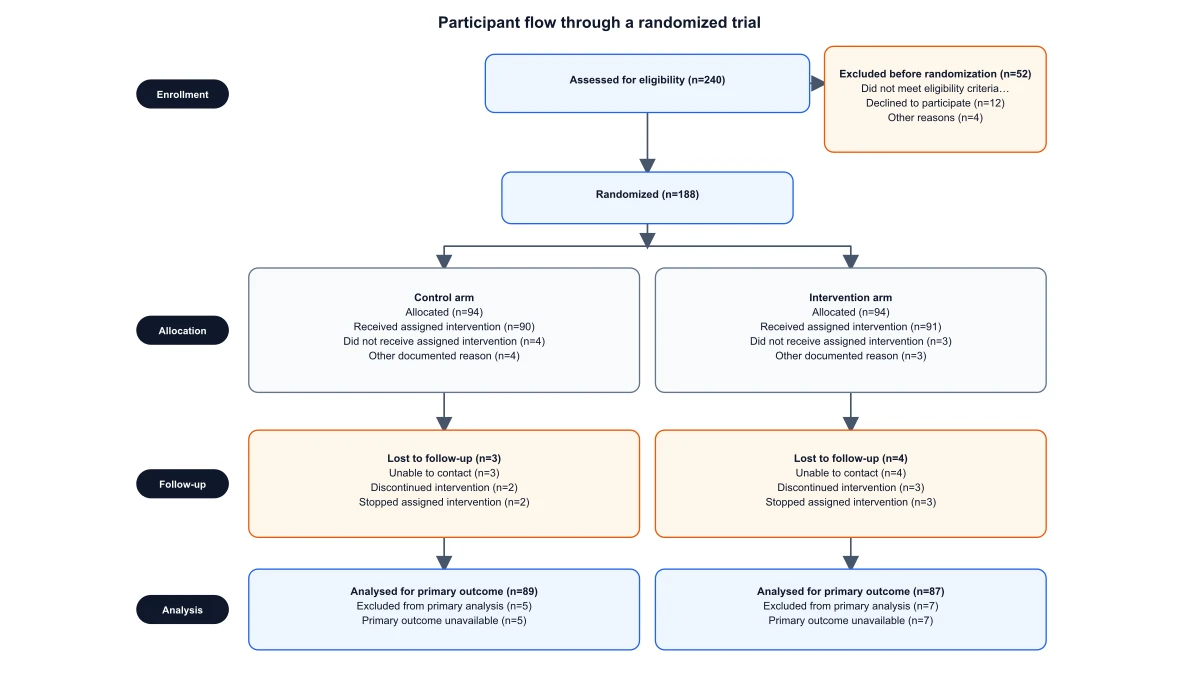
FC-001 · CONSORT Enrollment Flow
MA-001 · GAN Training Loop
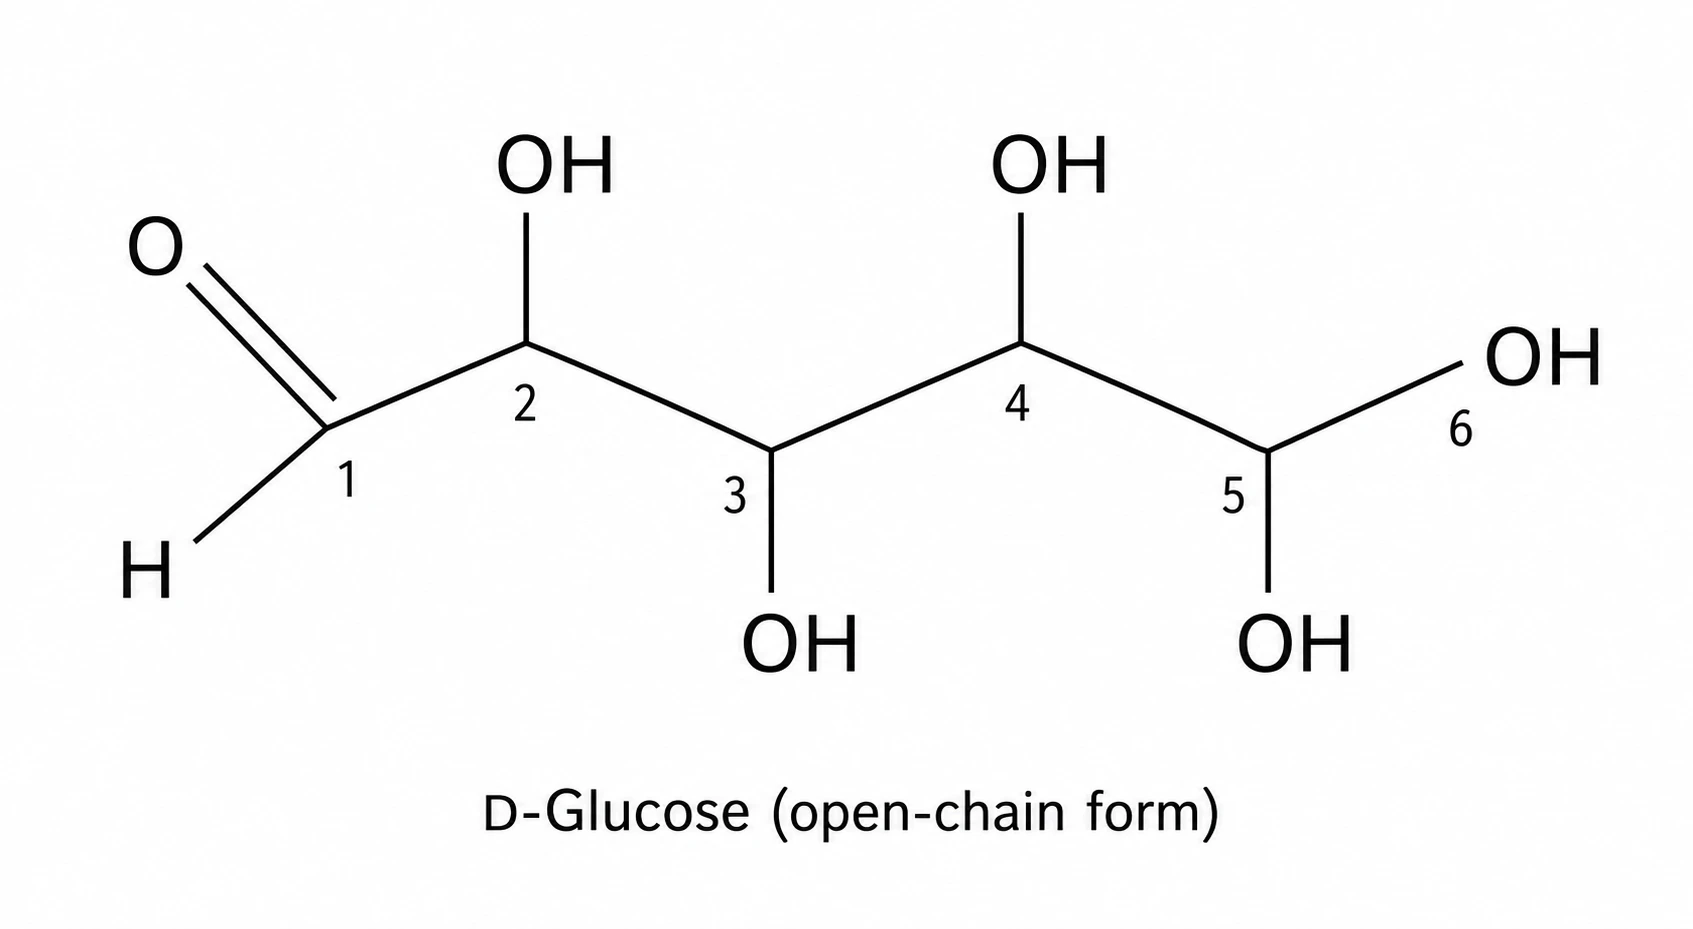
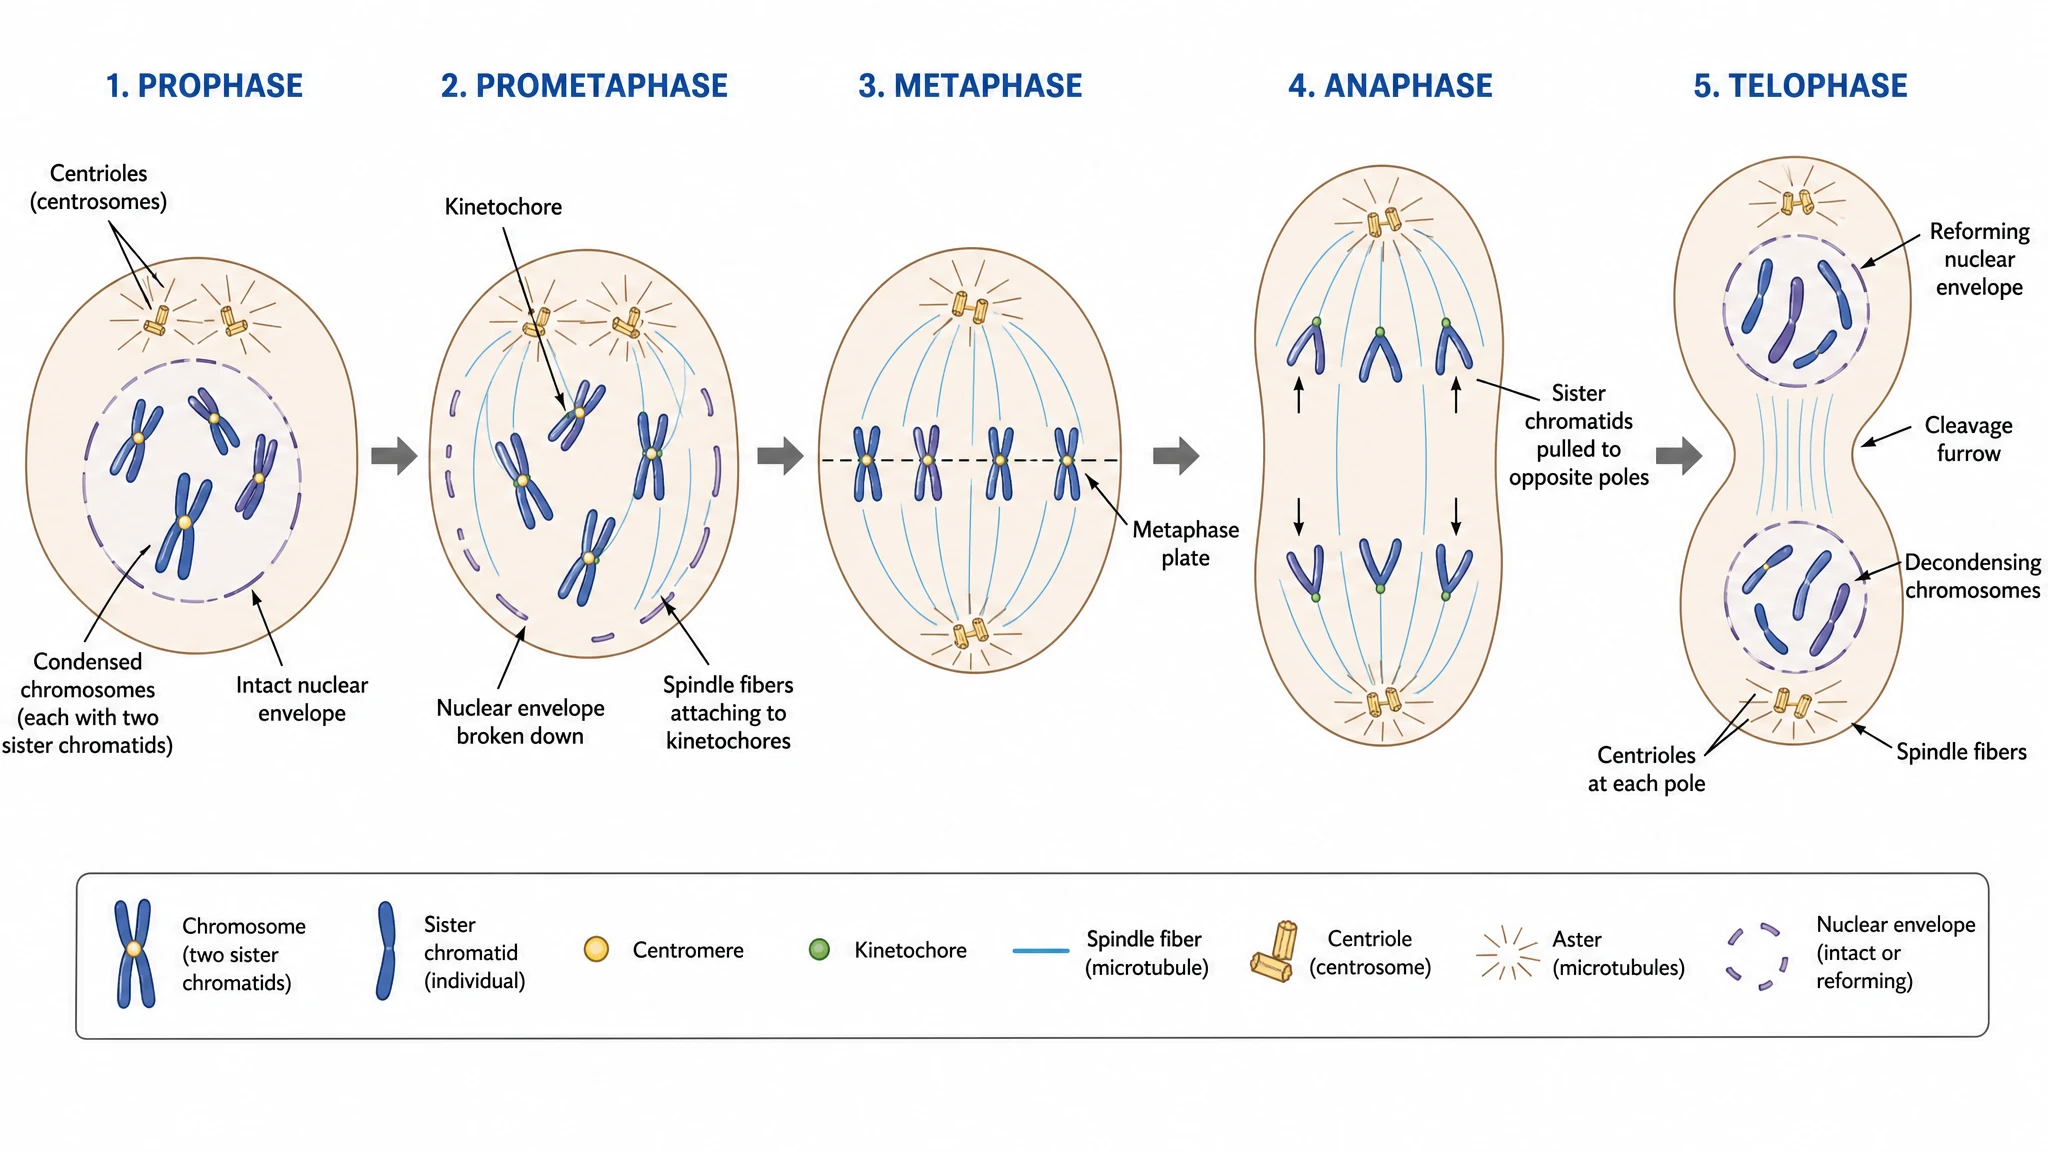
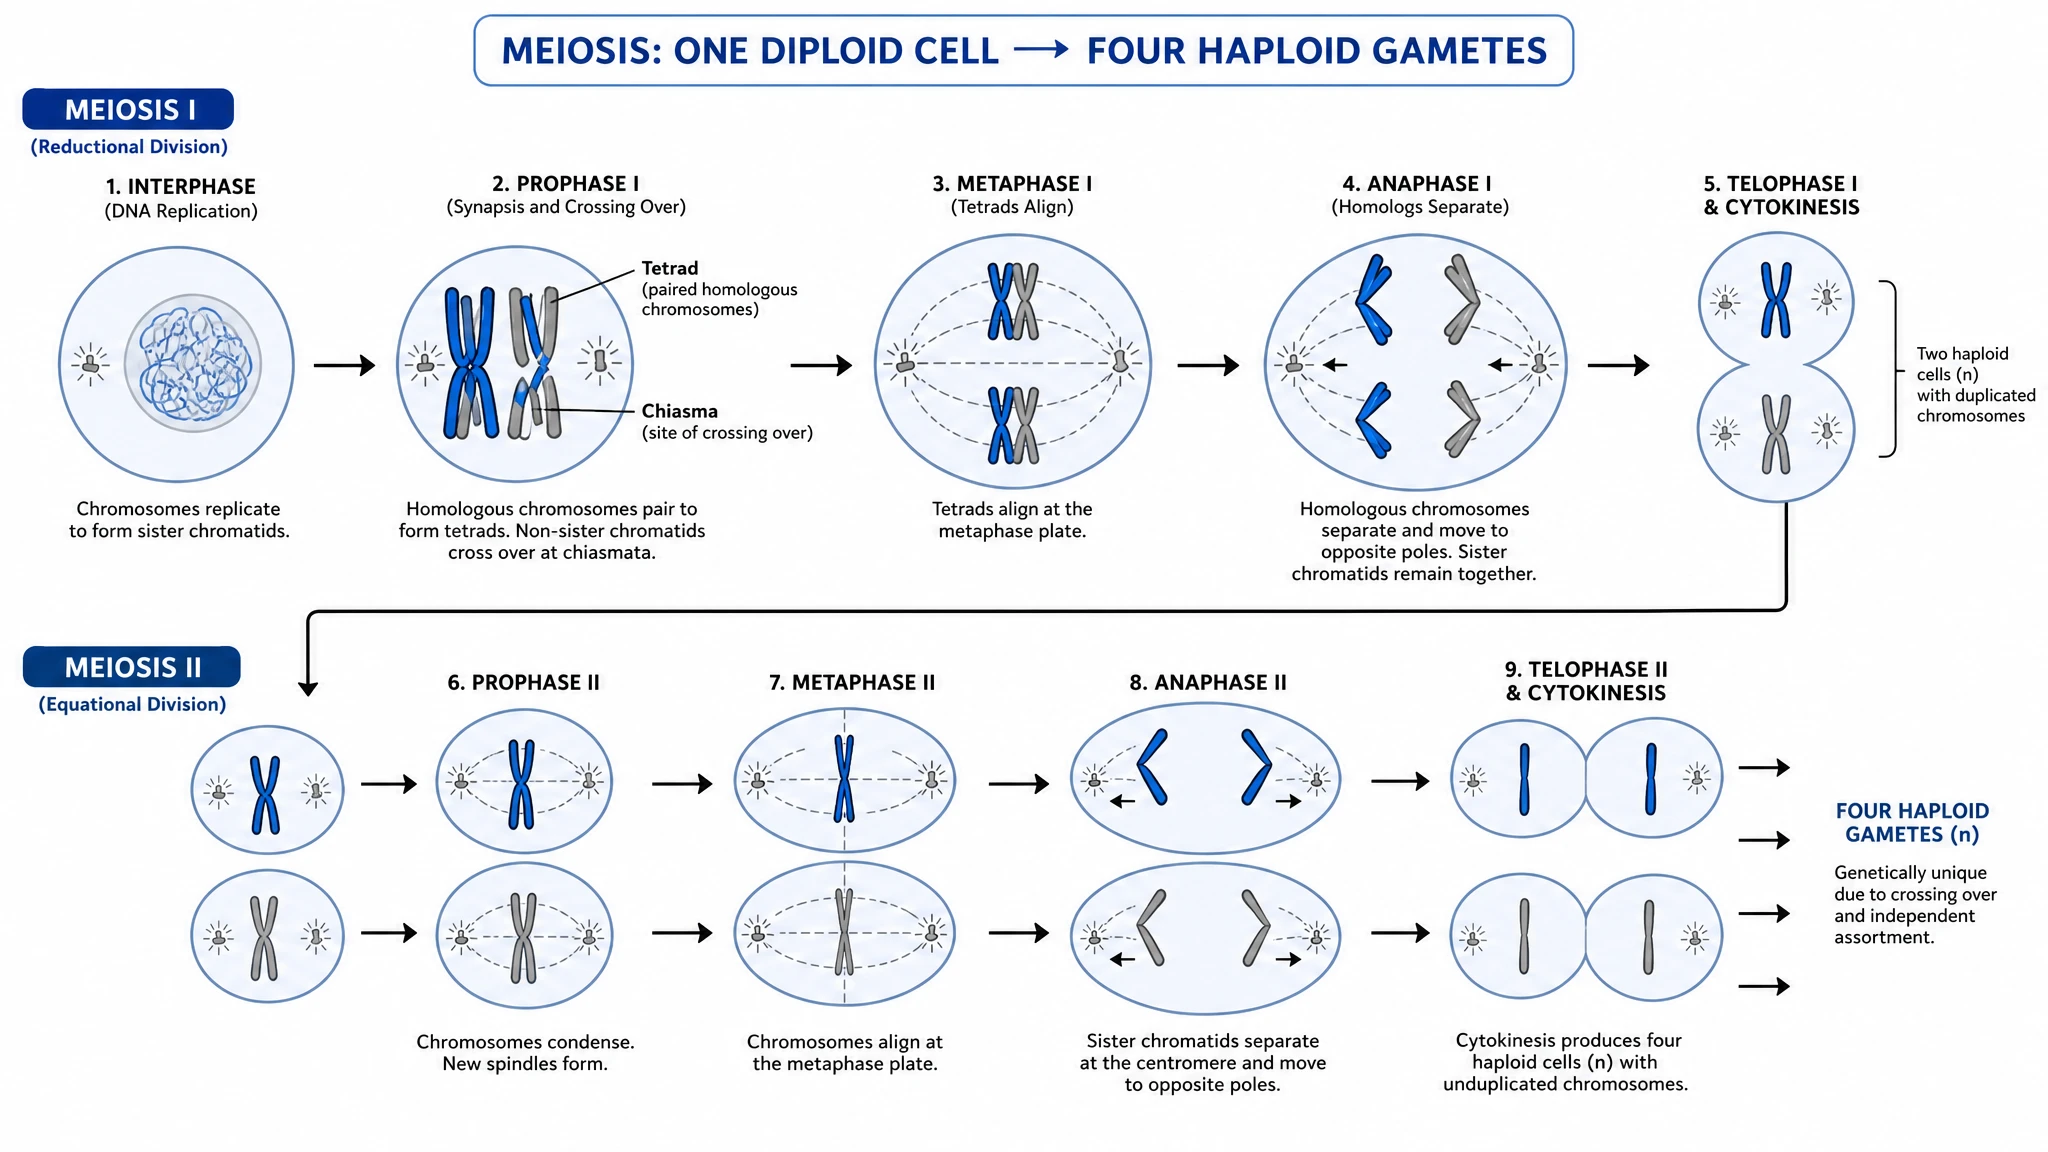
CY-001 · Mitosis Stages
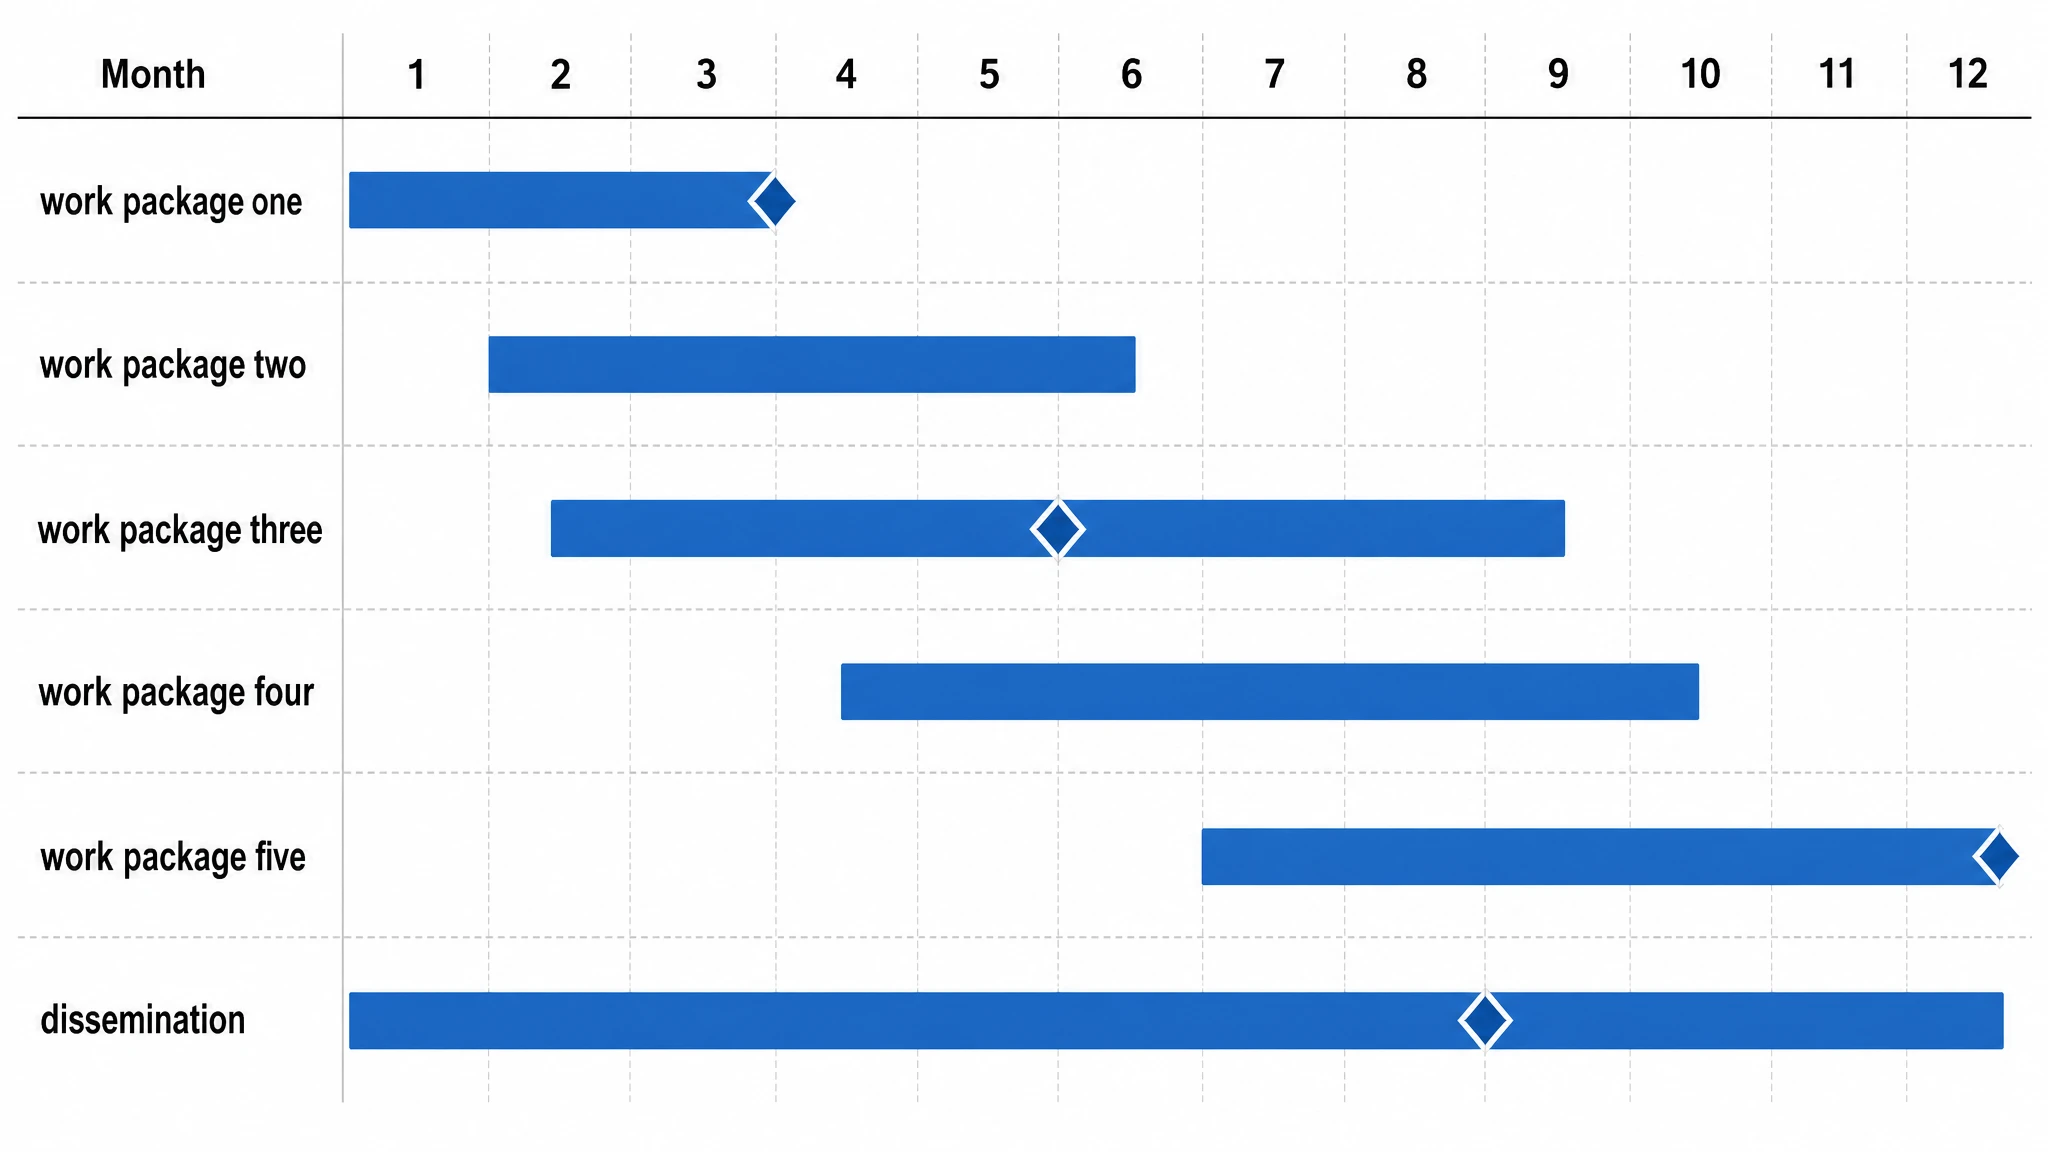
TL-001 · Study Milestone Timeline

Processes into editable diagrams

Free AI Flowchart Maker from Text and Templates

Turn connected steps and decisions into a diagram you can explain, edit and reuse.

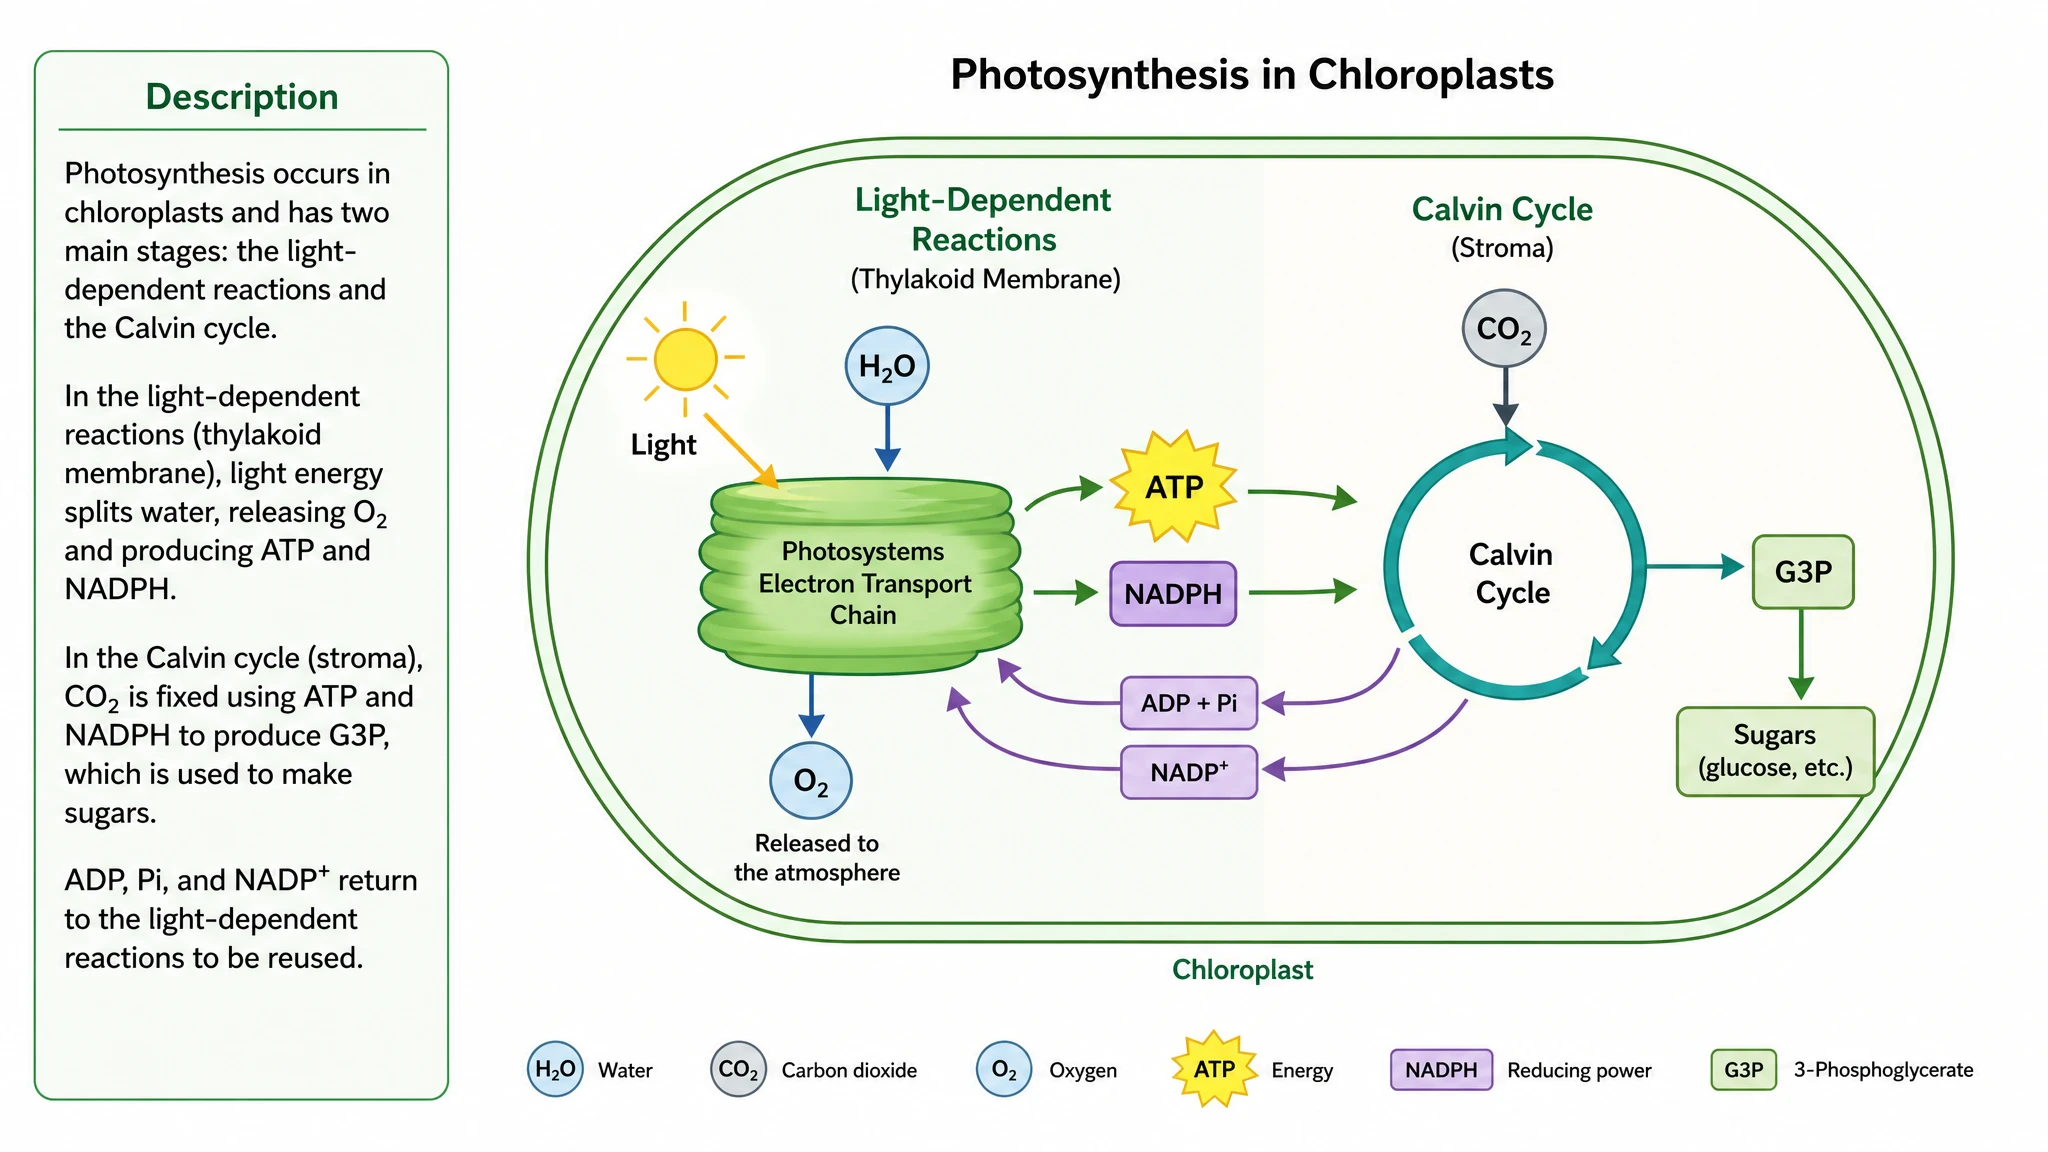
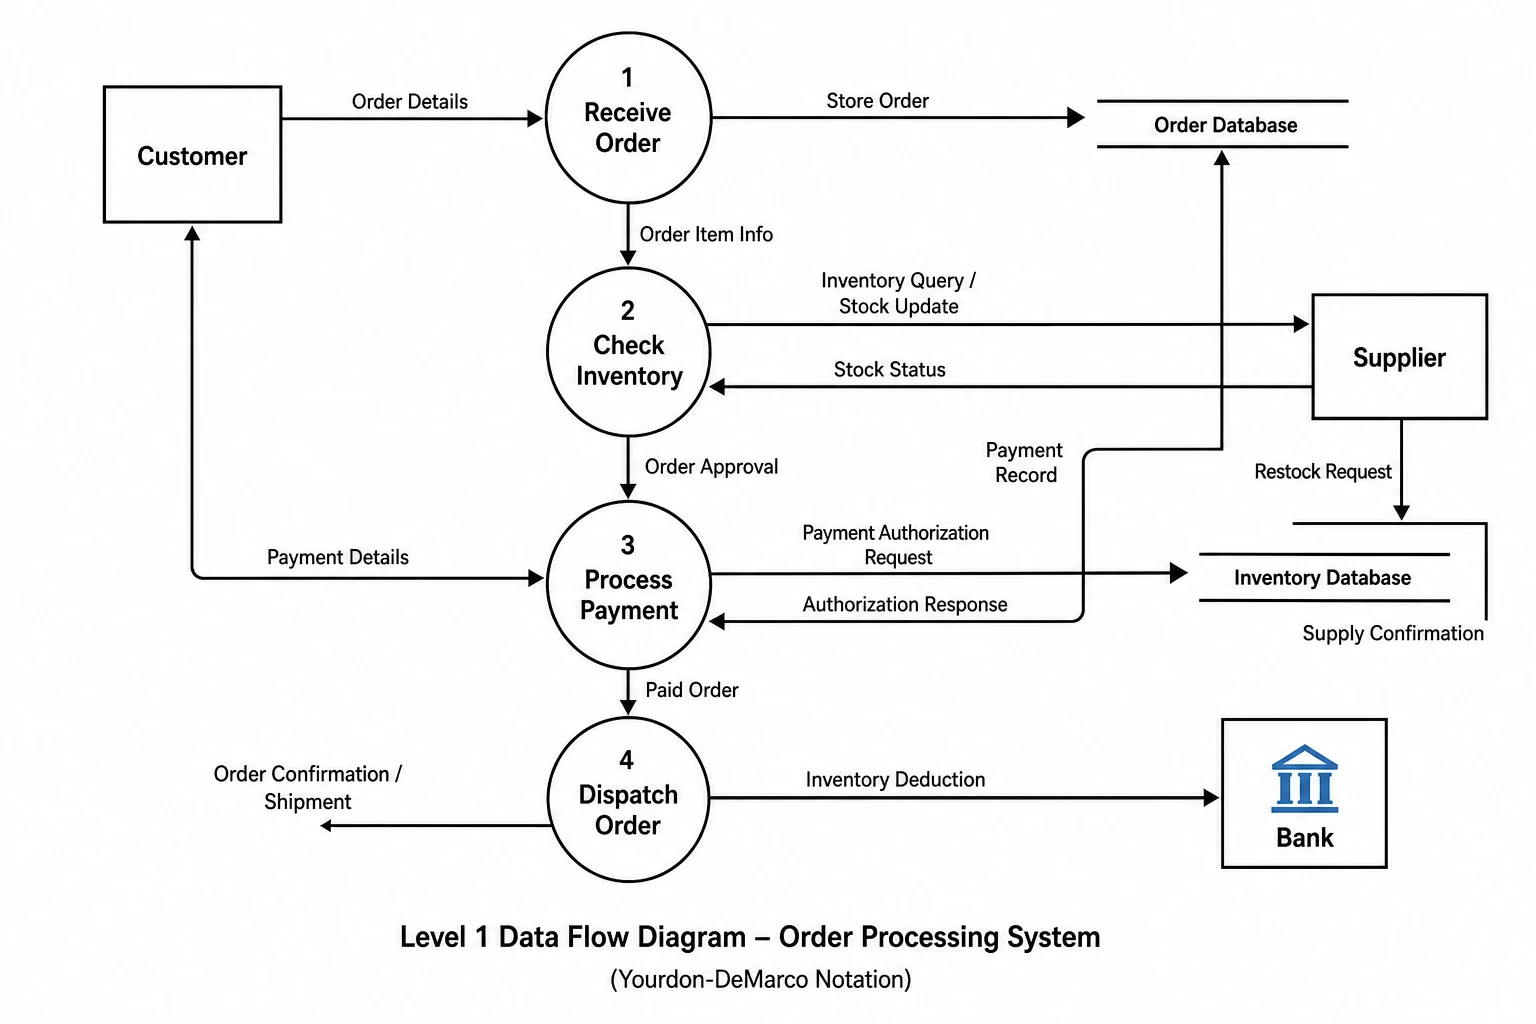
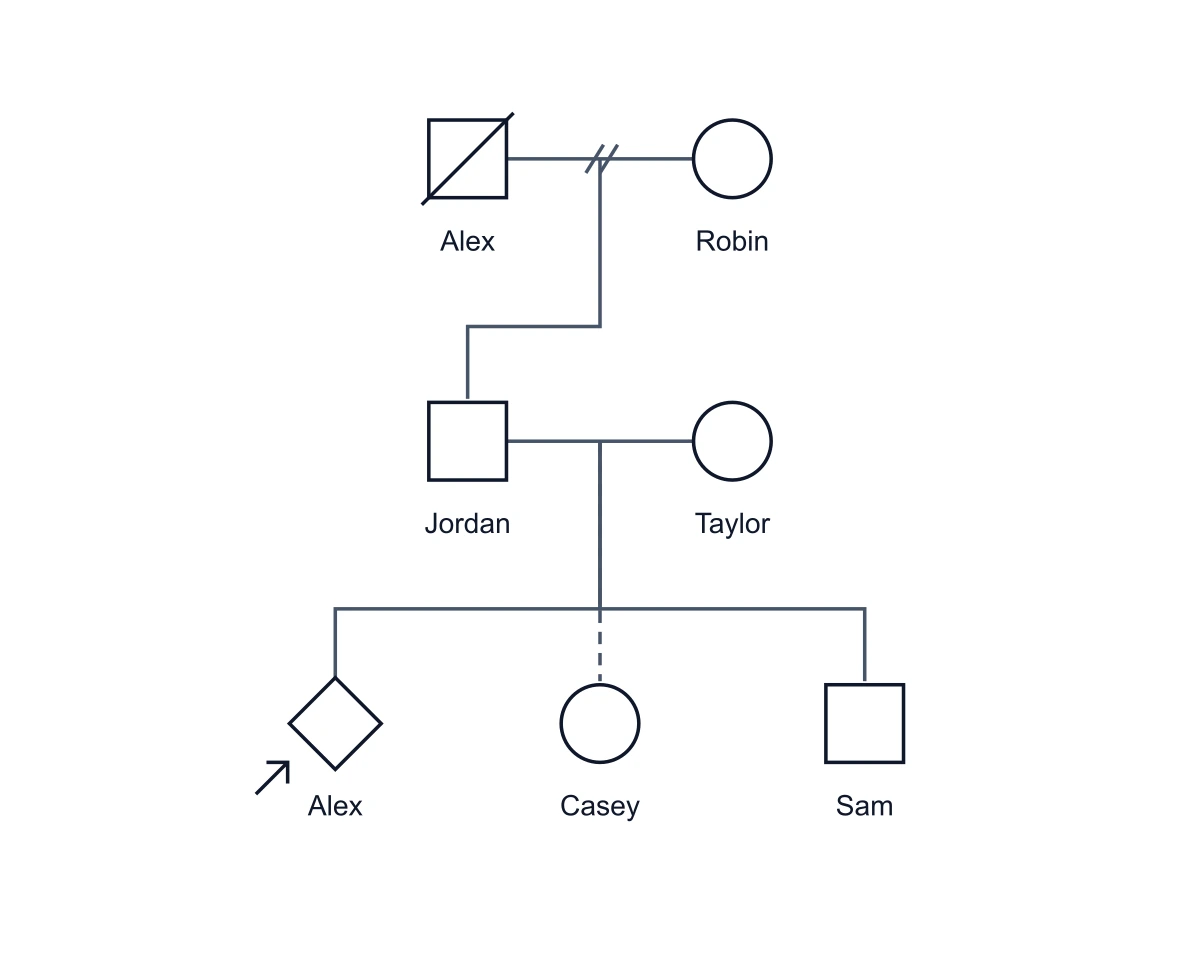
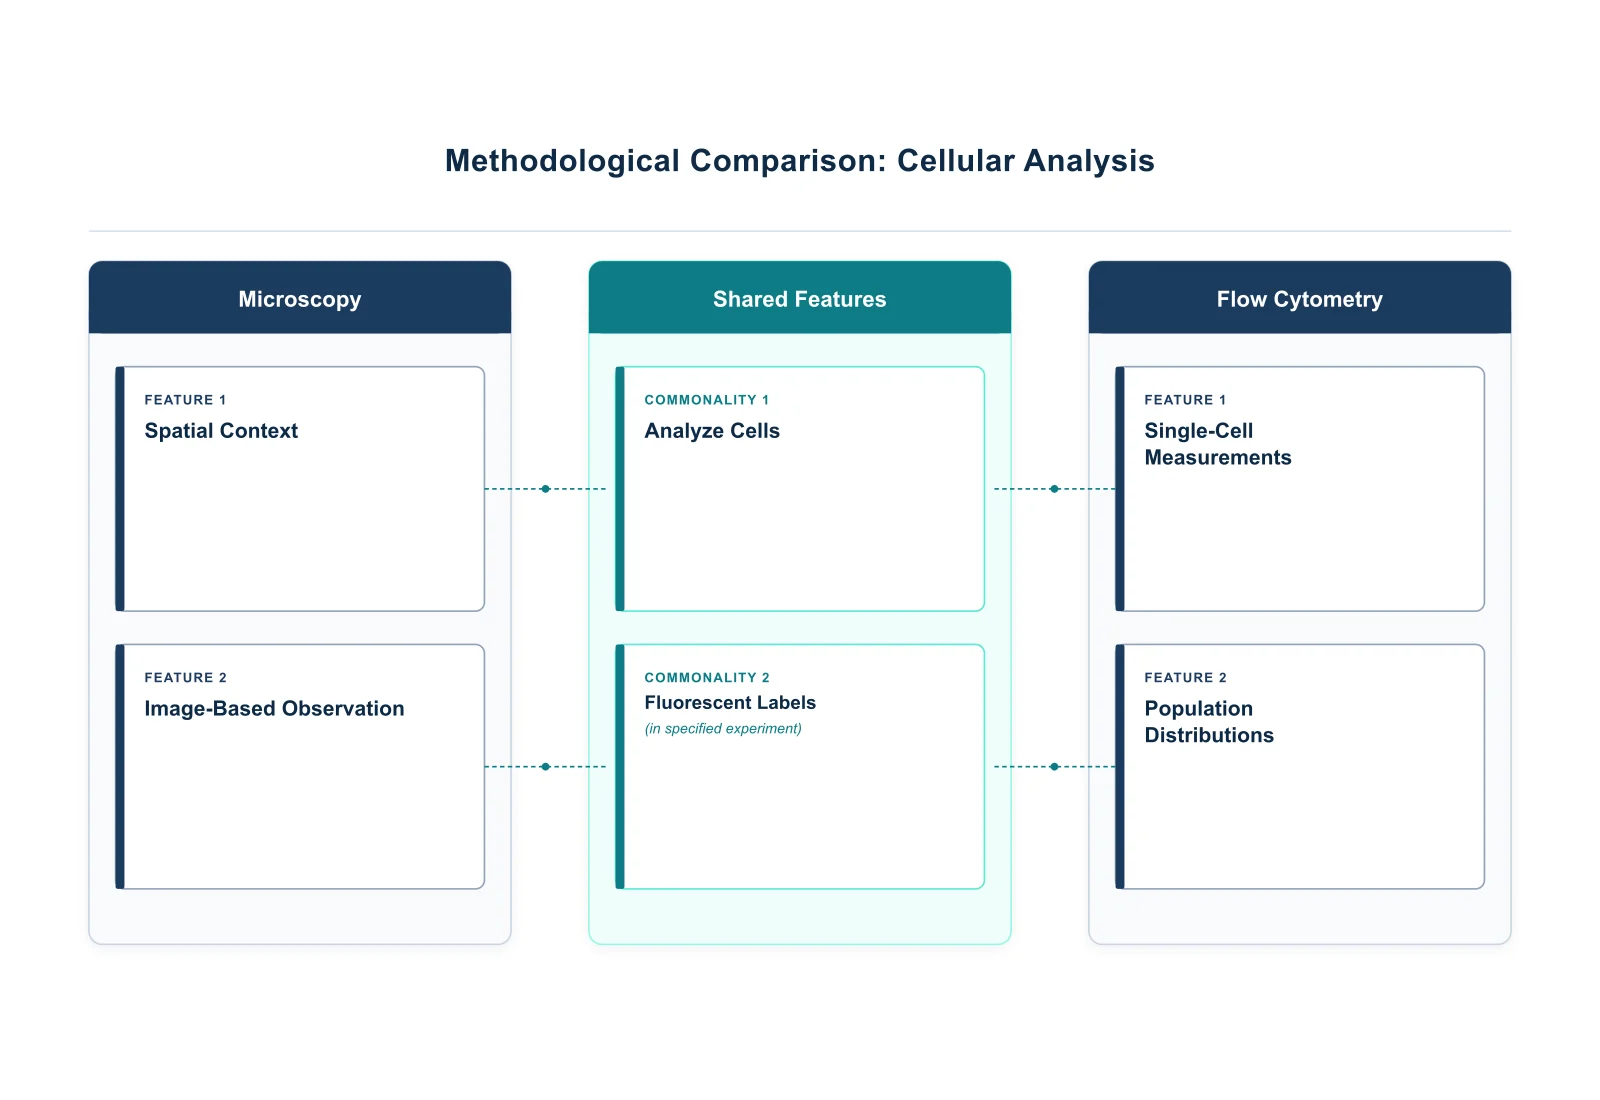
A flowchart maker represents steps, decisions and connections as a diagram. FlowChart uses your written process brief and relevant templates to generate a native SVG flowchart, then lets you refine every node, arrow and style. Use it for a linear procedure, branching decision or research flow — your description determines the logic — and place the editable diagram in a methods section, teaching handout or presentation.

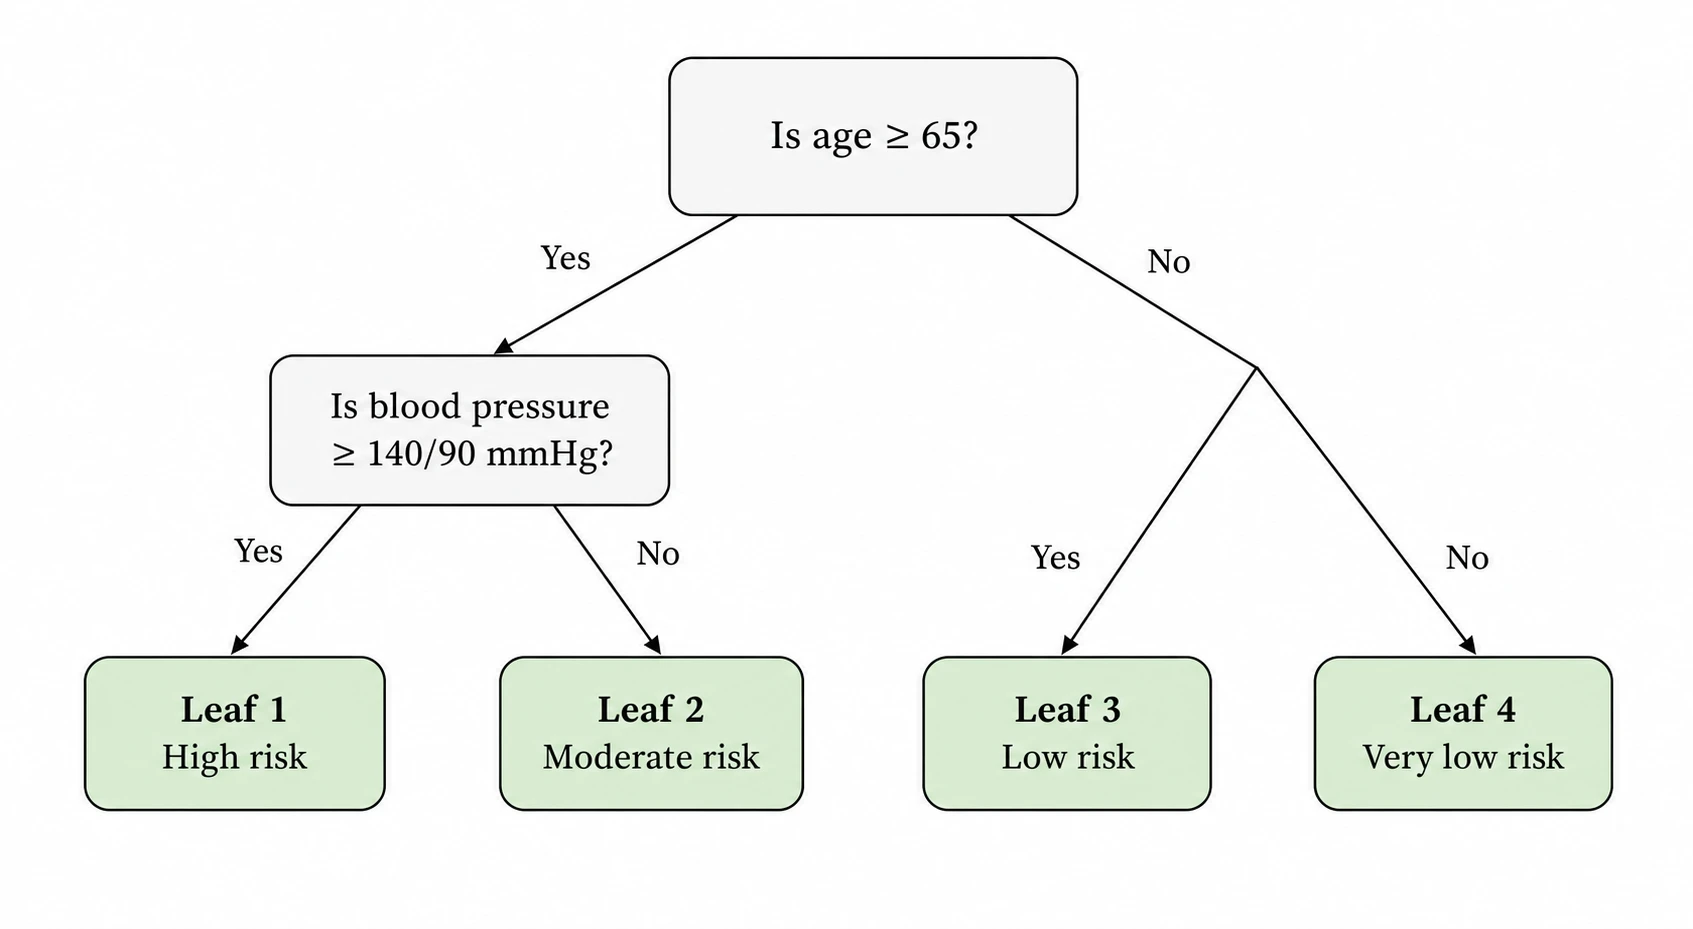
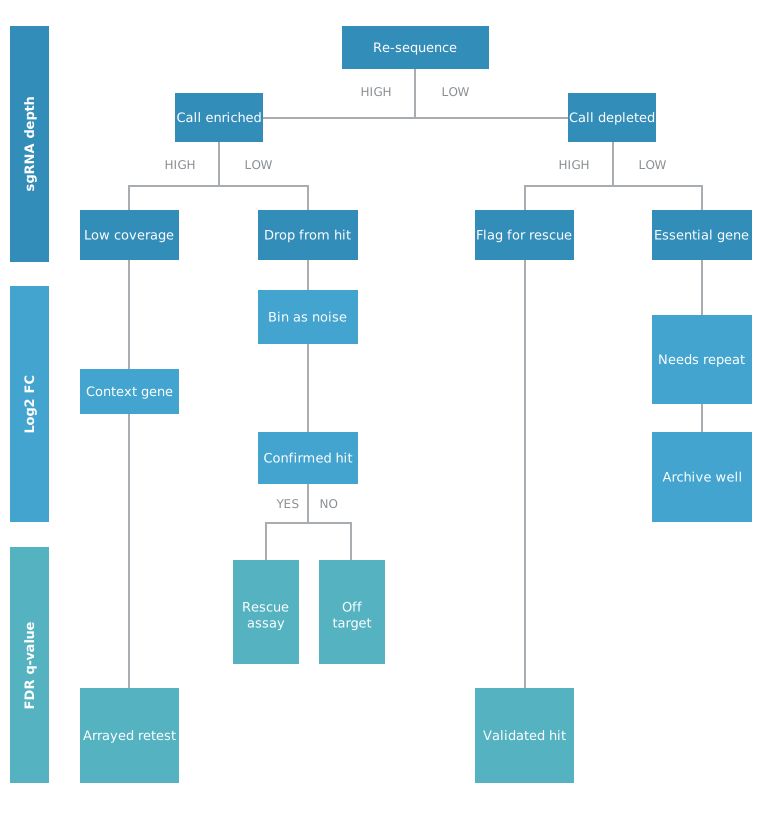
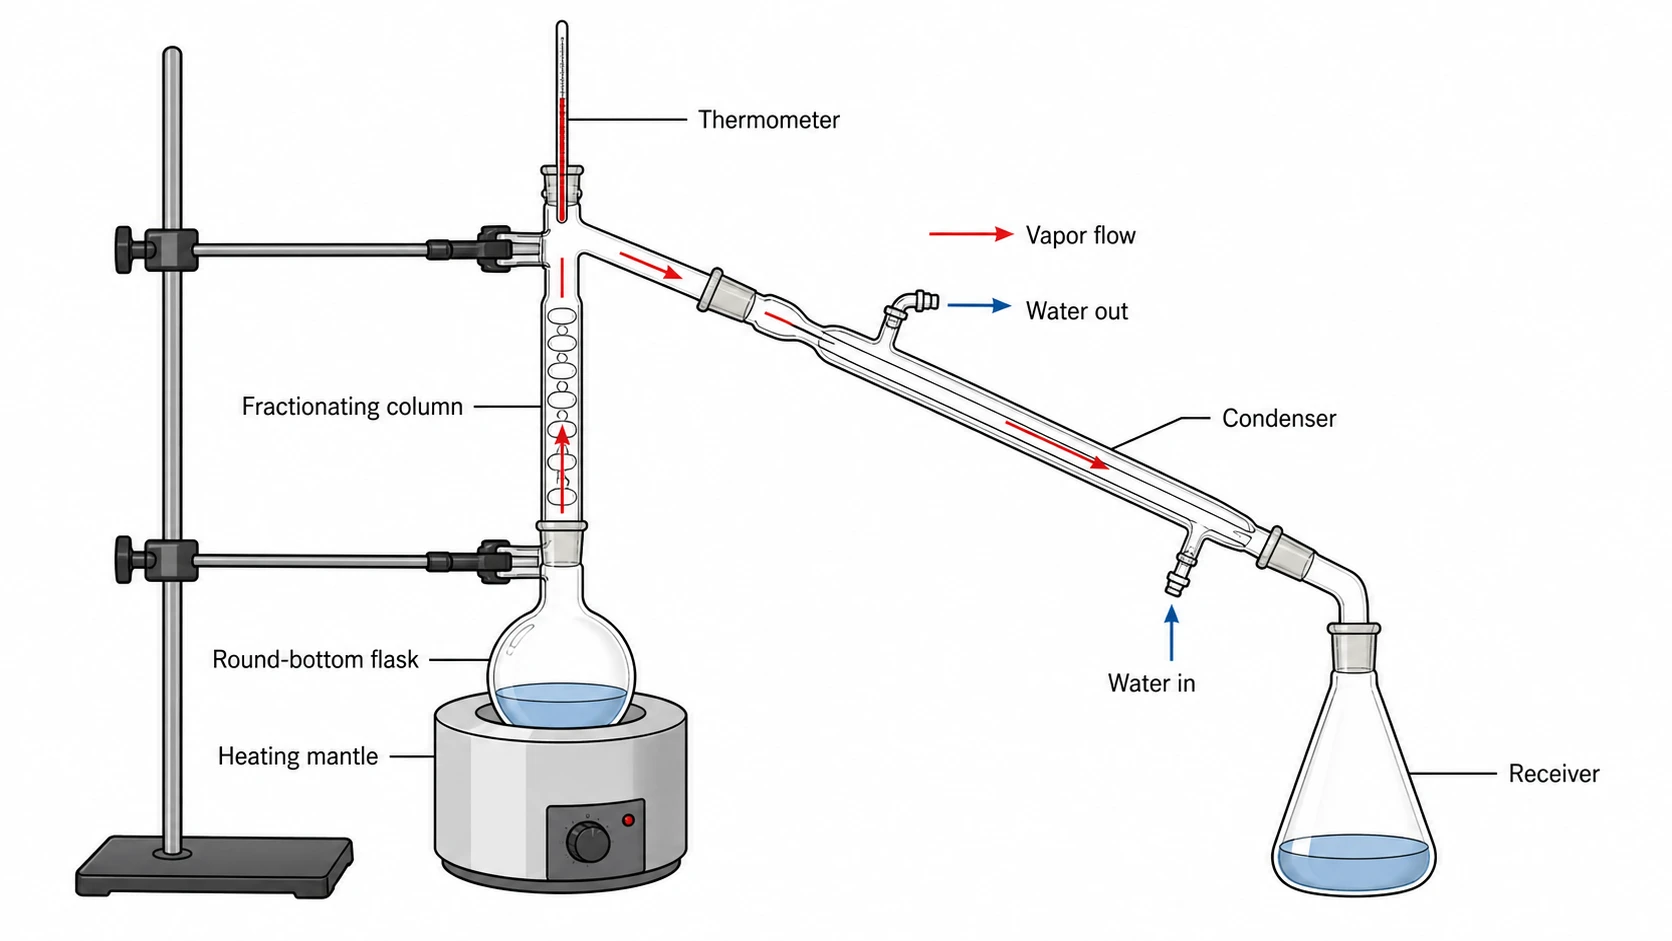
CRISPR screen hit-triage diagram with labeled decision branches
  • Text briefs and diagram templates
  • Editable SVG text, shapes and connectors
  • AI revisions and manual canvas editing
  • SVG, PNG, JPG and PPTX for your documents

AI Flowchart Maker Features

Turn a written process into an editable diagram, then refine the steps and connections for your audience.

Turn a Written Process into a Diagram

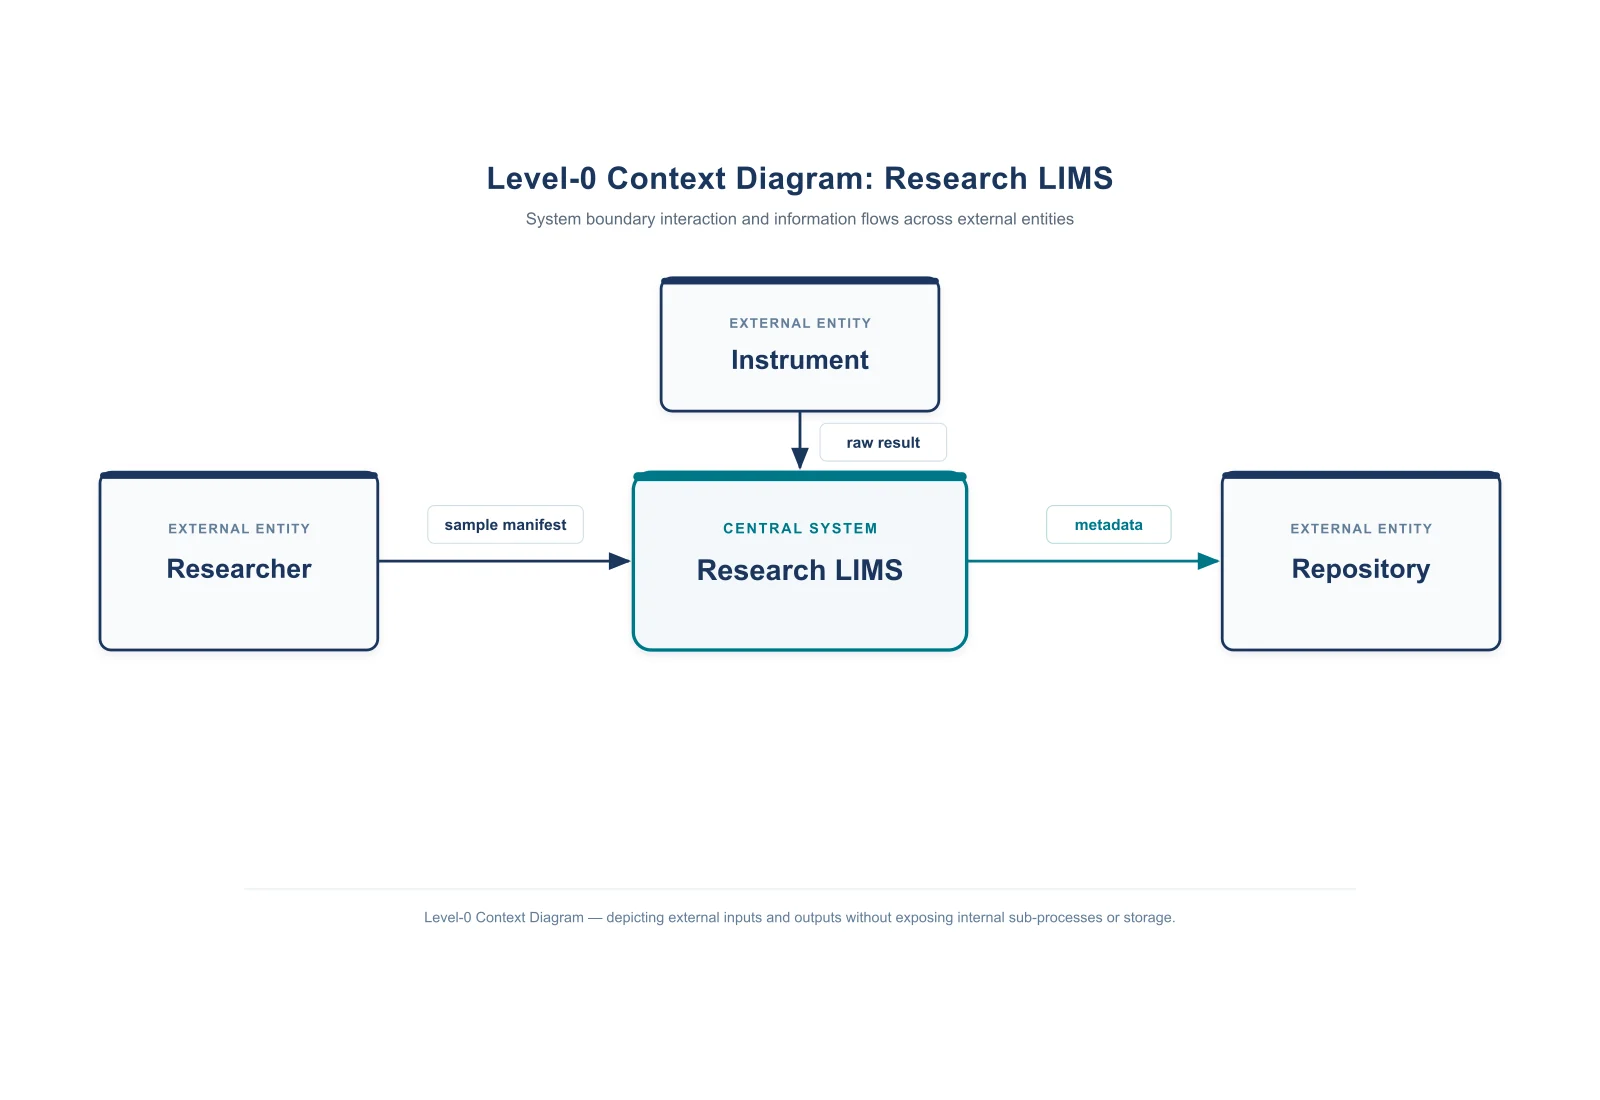
Describe the steps, decisions and destinations in plain language, then develop a diagram from those relationships. FlowChart brings a process into view without starting from empty boxes. Use the diagram to explain research methods, a branching procedure or a connected system, with every node and arrow following your description.

  • Describe ordered steps and the endpoints.
  • State the condition and destination of each branch.
  • Turn the description into a visual explanation of the process.
Describe Your Process

Start with a Structure That Fits

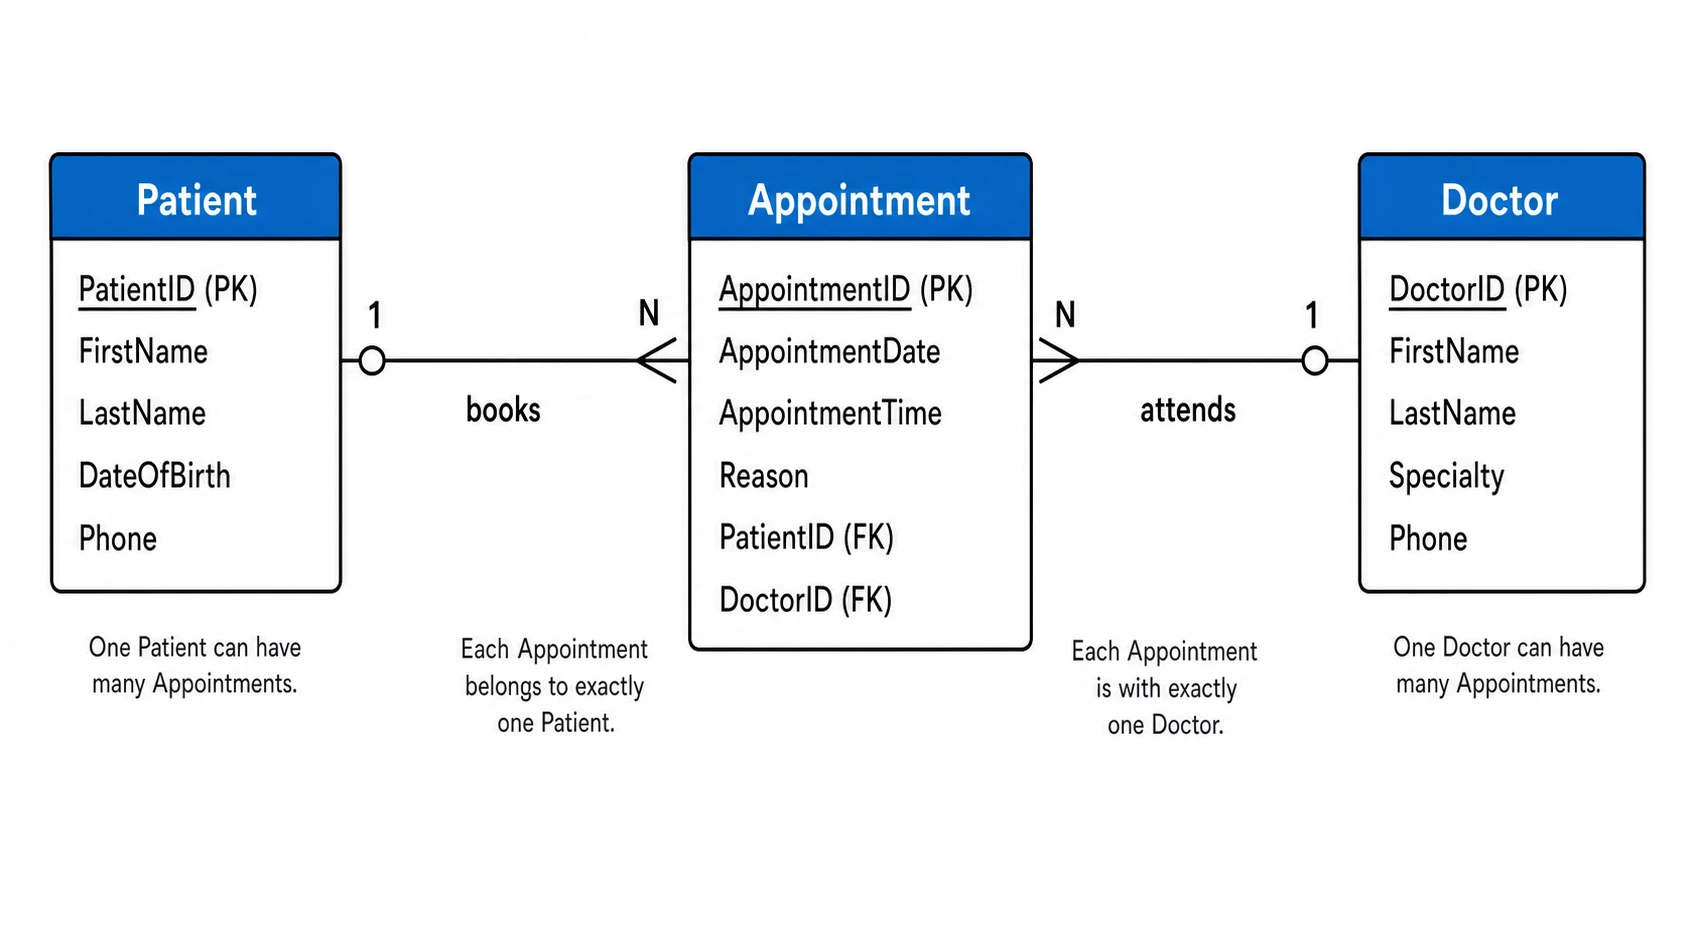
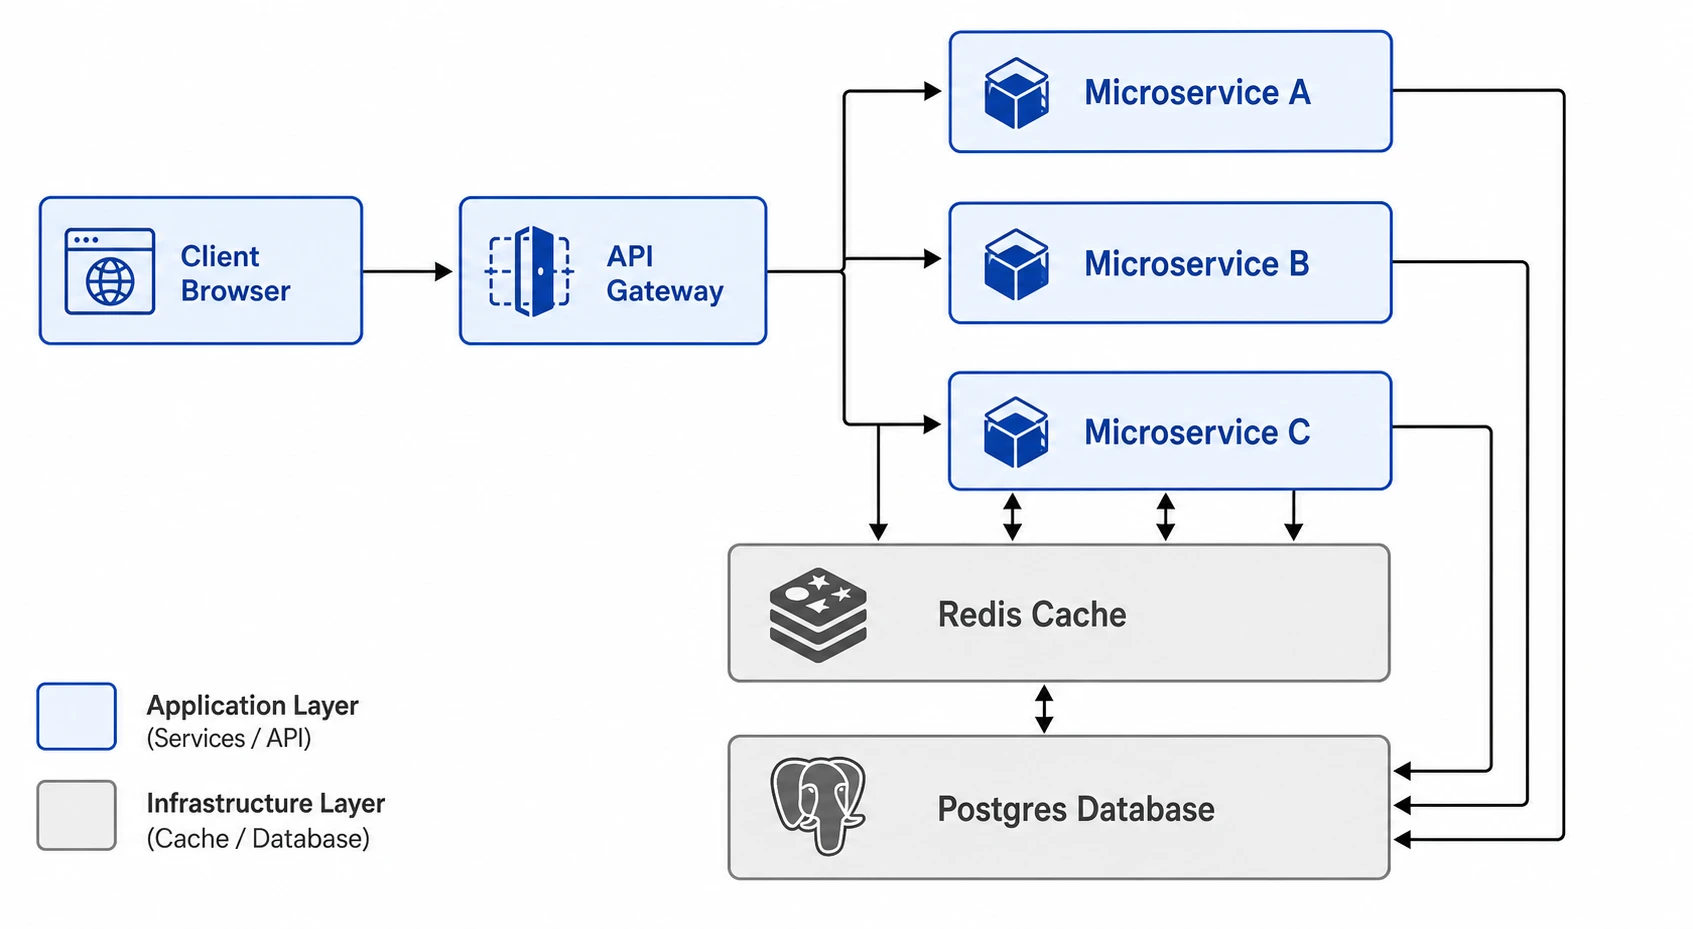
Explore templates for research flows, scientific cycles, model architectures and timelines. A relevant example helps communicate the shape of the diagram, while your brief supplies the actual stages, component names and counts. Develop the structure around the task instead of adapting the process to a convenient generic layout.

  • Explore examples of flows, cycles and connected systems.
  • Replace template labels and counts with your own details.
  • Choose a structure that represents the intended relationships.
Explore Flowchart Templates

Edit Nodes and Connections as Plans Change

Move nodes, rewrite labels and adjust connections directly on the native SVG canvas. You can reshape a decision branch or update a process stage without rebuilding the entire flowchart. Changes to text, shapes, connectors and appearance stay in the editable diagram, making it easier to develop a process with colleagues.

  • Move, duplicate or remove nodes on the canvas.
  • Edit text, shapes and connectors directly.
  • Adjust appearance and use undo or redo as you revise.
Start an Editable Flowchart

Bring Flowcharts into Papers and Presentations

Take a flowchart from a process discussion into a paper, handout or presentation. SVG keeps the diagram available for vector work, PNG and JPG provide image copies, and PPTX brings it into slides. Retain the source and project so a revised method or model can use the same visual structure.

  • Export SVG and source SVG for vector workflows.
  • Choose PNG, JPG or PPTX for documents and slides.
  • Reopen the project when stages or connections change.
Create a Presentation Diagram

How to Use an AI Flowchart Maker

Describe the steps, generate a native SVG flowchart, then edit any node or connection.

  1. Write the Steps and Branch Conditions

    Name the start and endpoints, list the stages in order and describe each decision’s outcomes. If a loop returns to an earlier step, say where it reconnects. This gives the AI flowchart maker the relationships it needs before visual styling is chosen.

  2. Choose a Relevant Starting Structure

    Browse a template for the task, or use your own process description. Replace example labels and counts with the actual details. A study-selection flow, scientific cycle and model architecture need different structures even when they use similar nodes and arrows.

  3. Generate the Native SVG Diagram

    Generate the flowchart from the process description and selected structure. FlowChart draws each branch from its starting point to the stated outcome as native SVG, making the sequence, decisions and loops visible before you adjust the presentation.

  4. Edit and Export the Diagram

    Edit node wording, move shapes and reconnect arrows on the canvas. Adjust the appearance for the report or presentation, then export SVG, PNG, JPG, PPTX or the SVG source. Keep the editable project so later process changes can use the same diagram.

Research and Process Flowchart Use Cases

Use flowcharts to explain research processes, decisions and connected structures clearly.

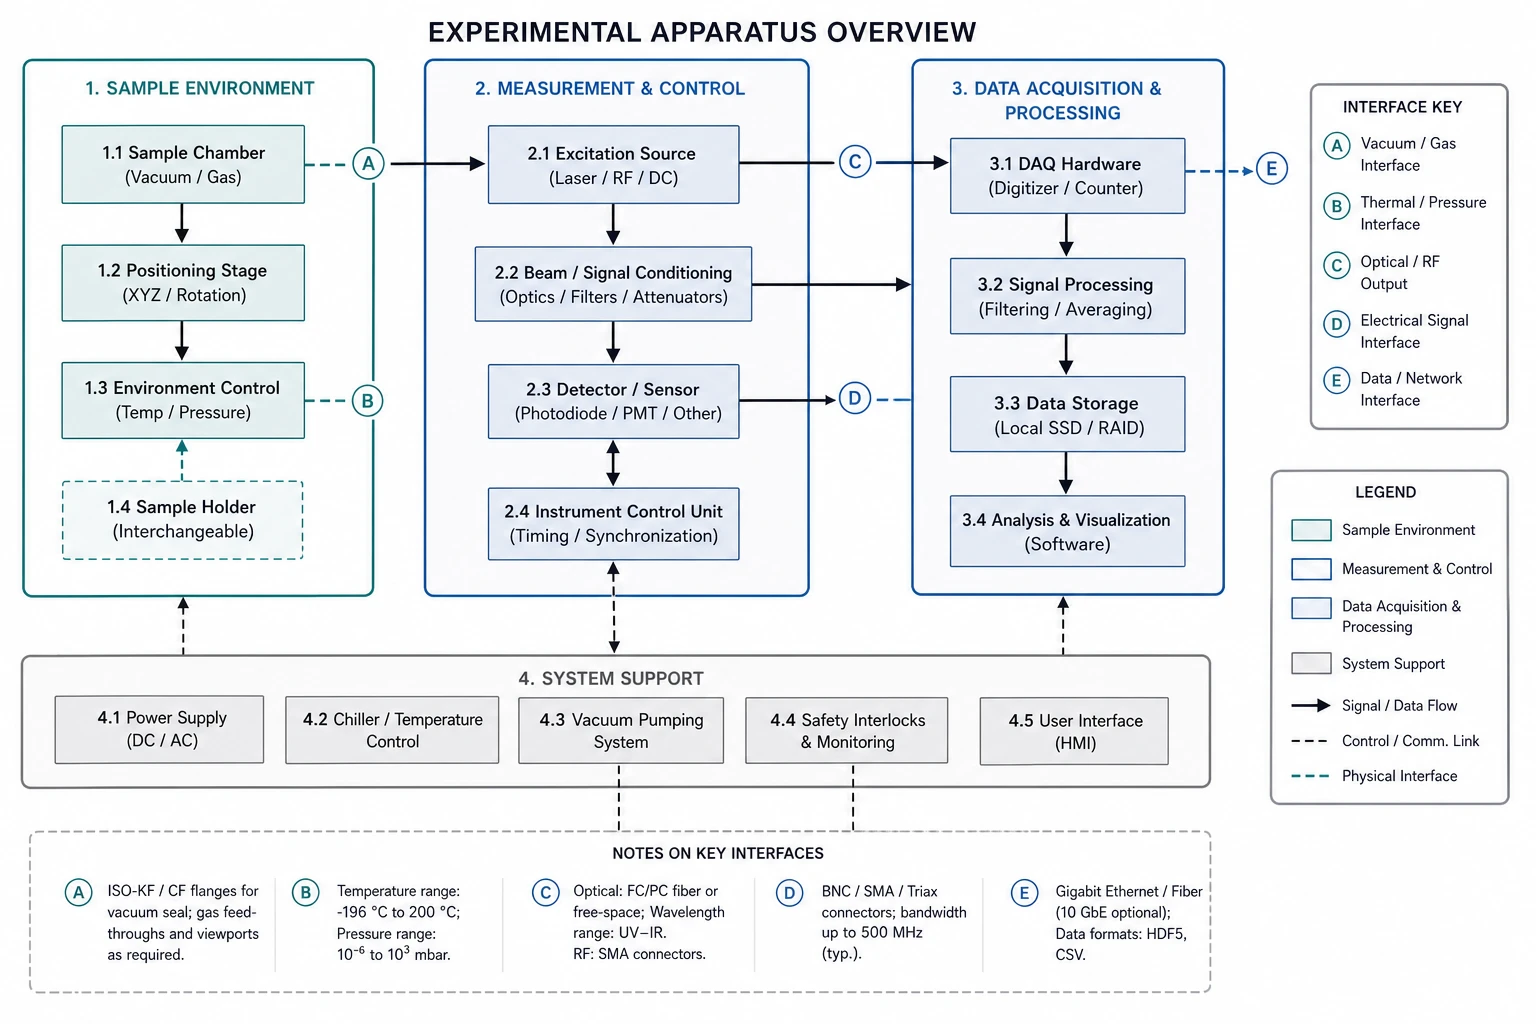
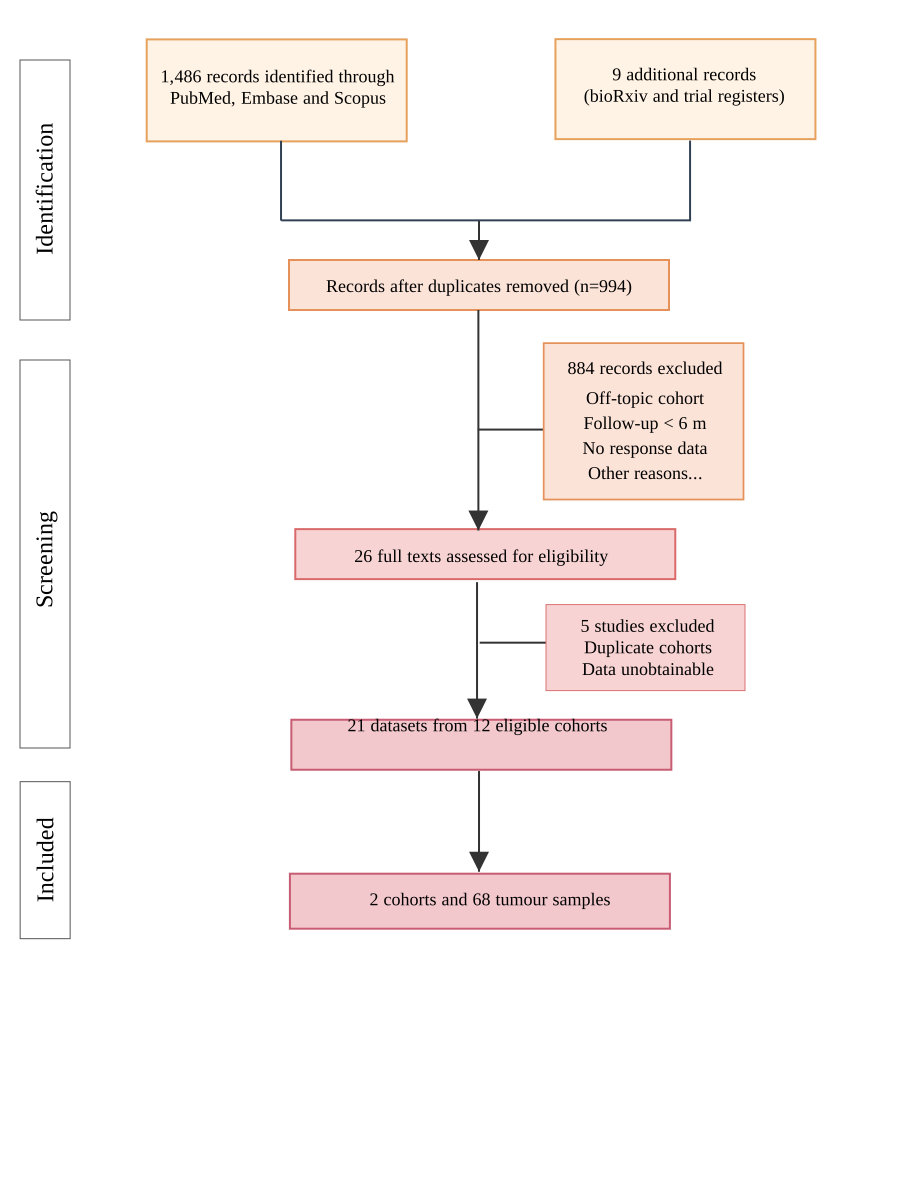
PRISMA literature-screening flow diagram

Research and Experimental Workflows

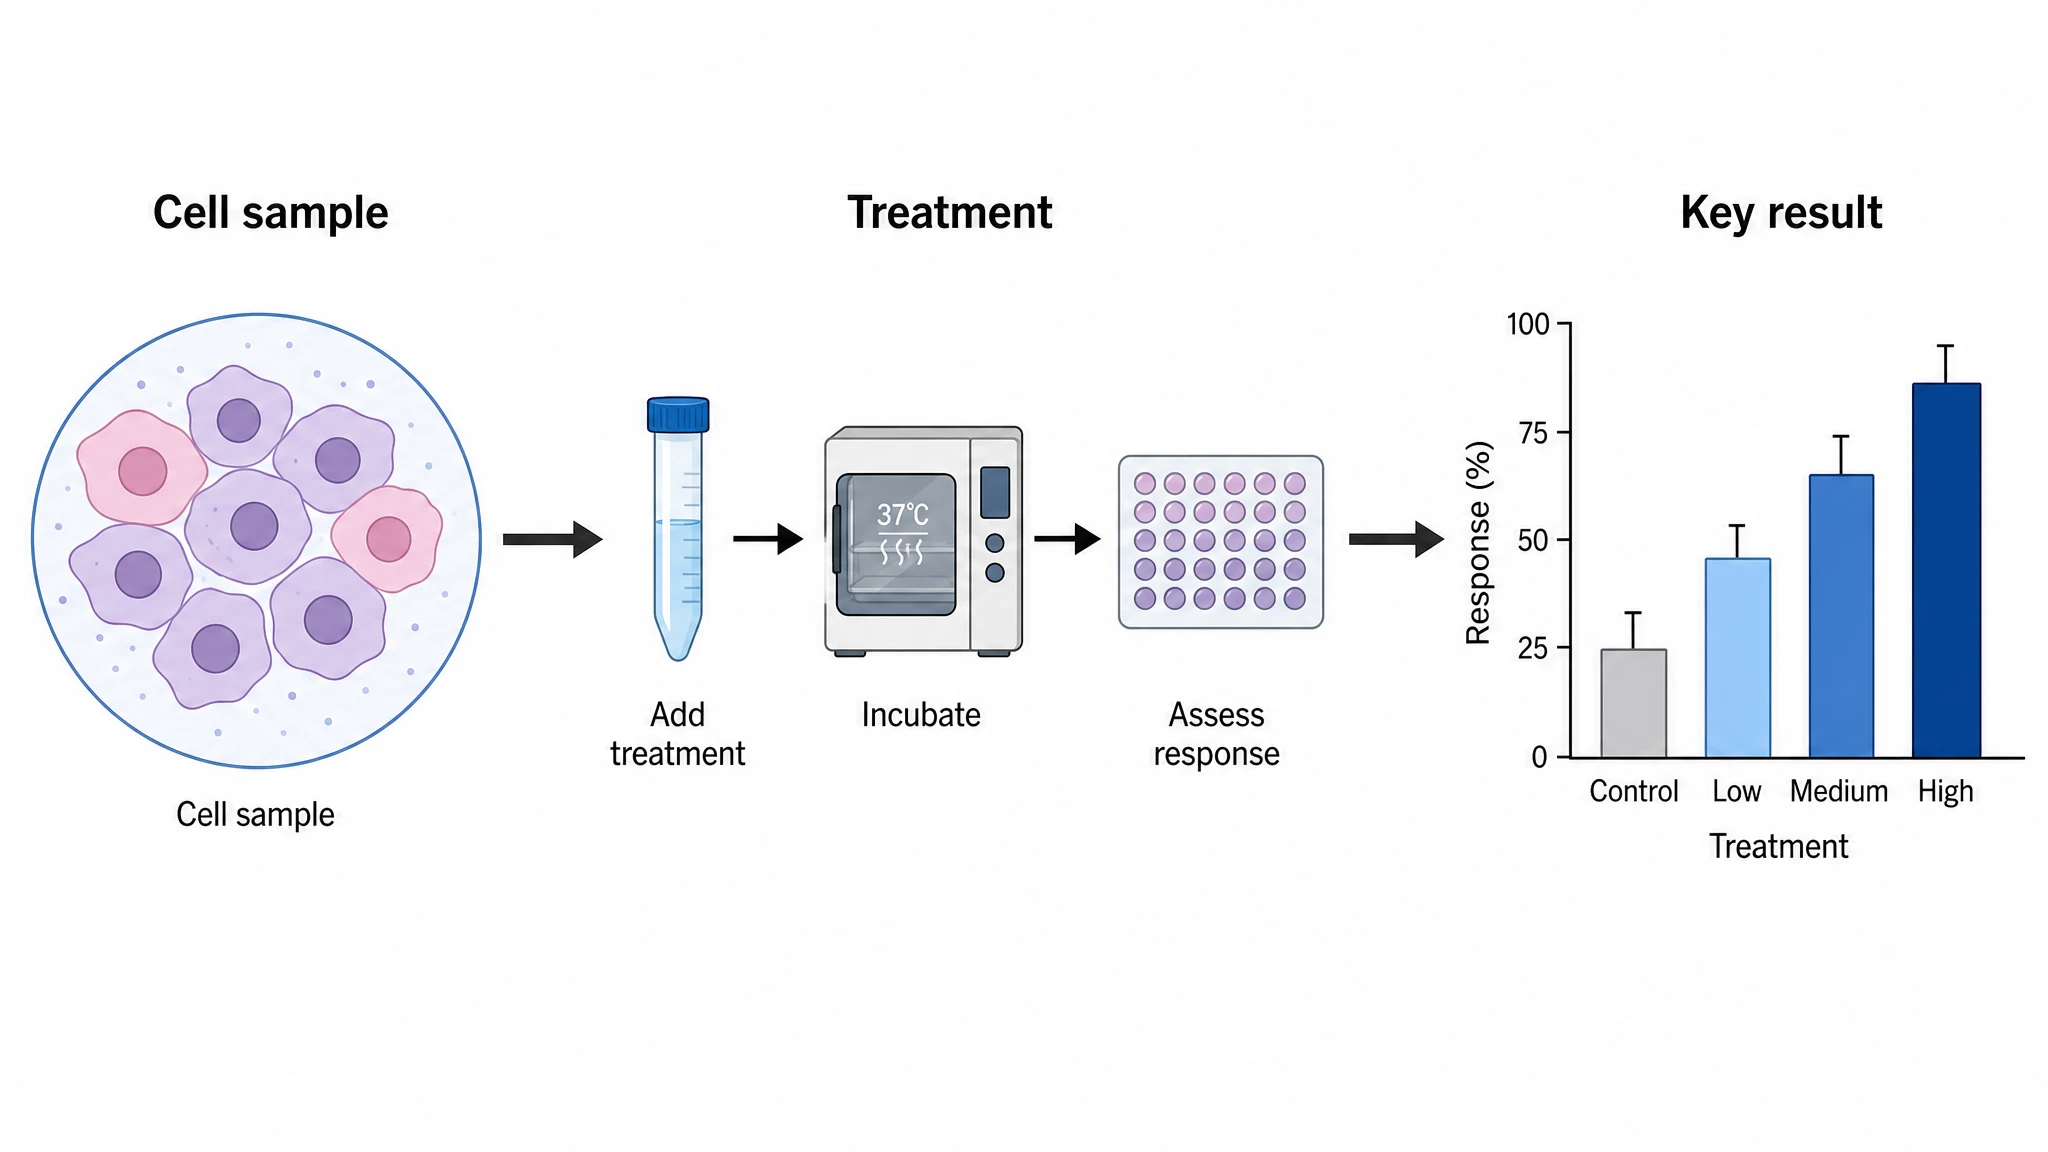
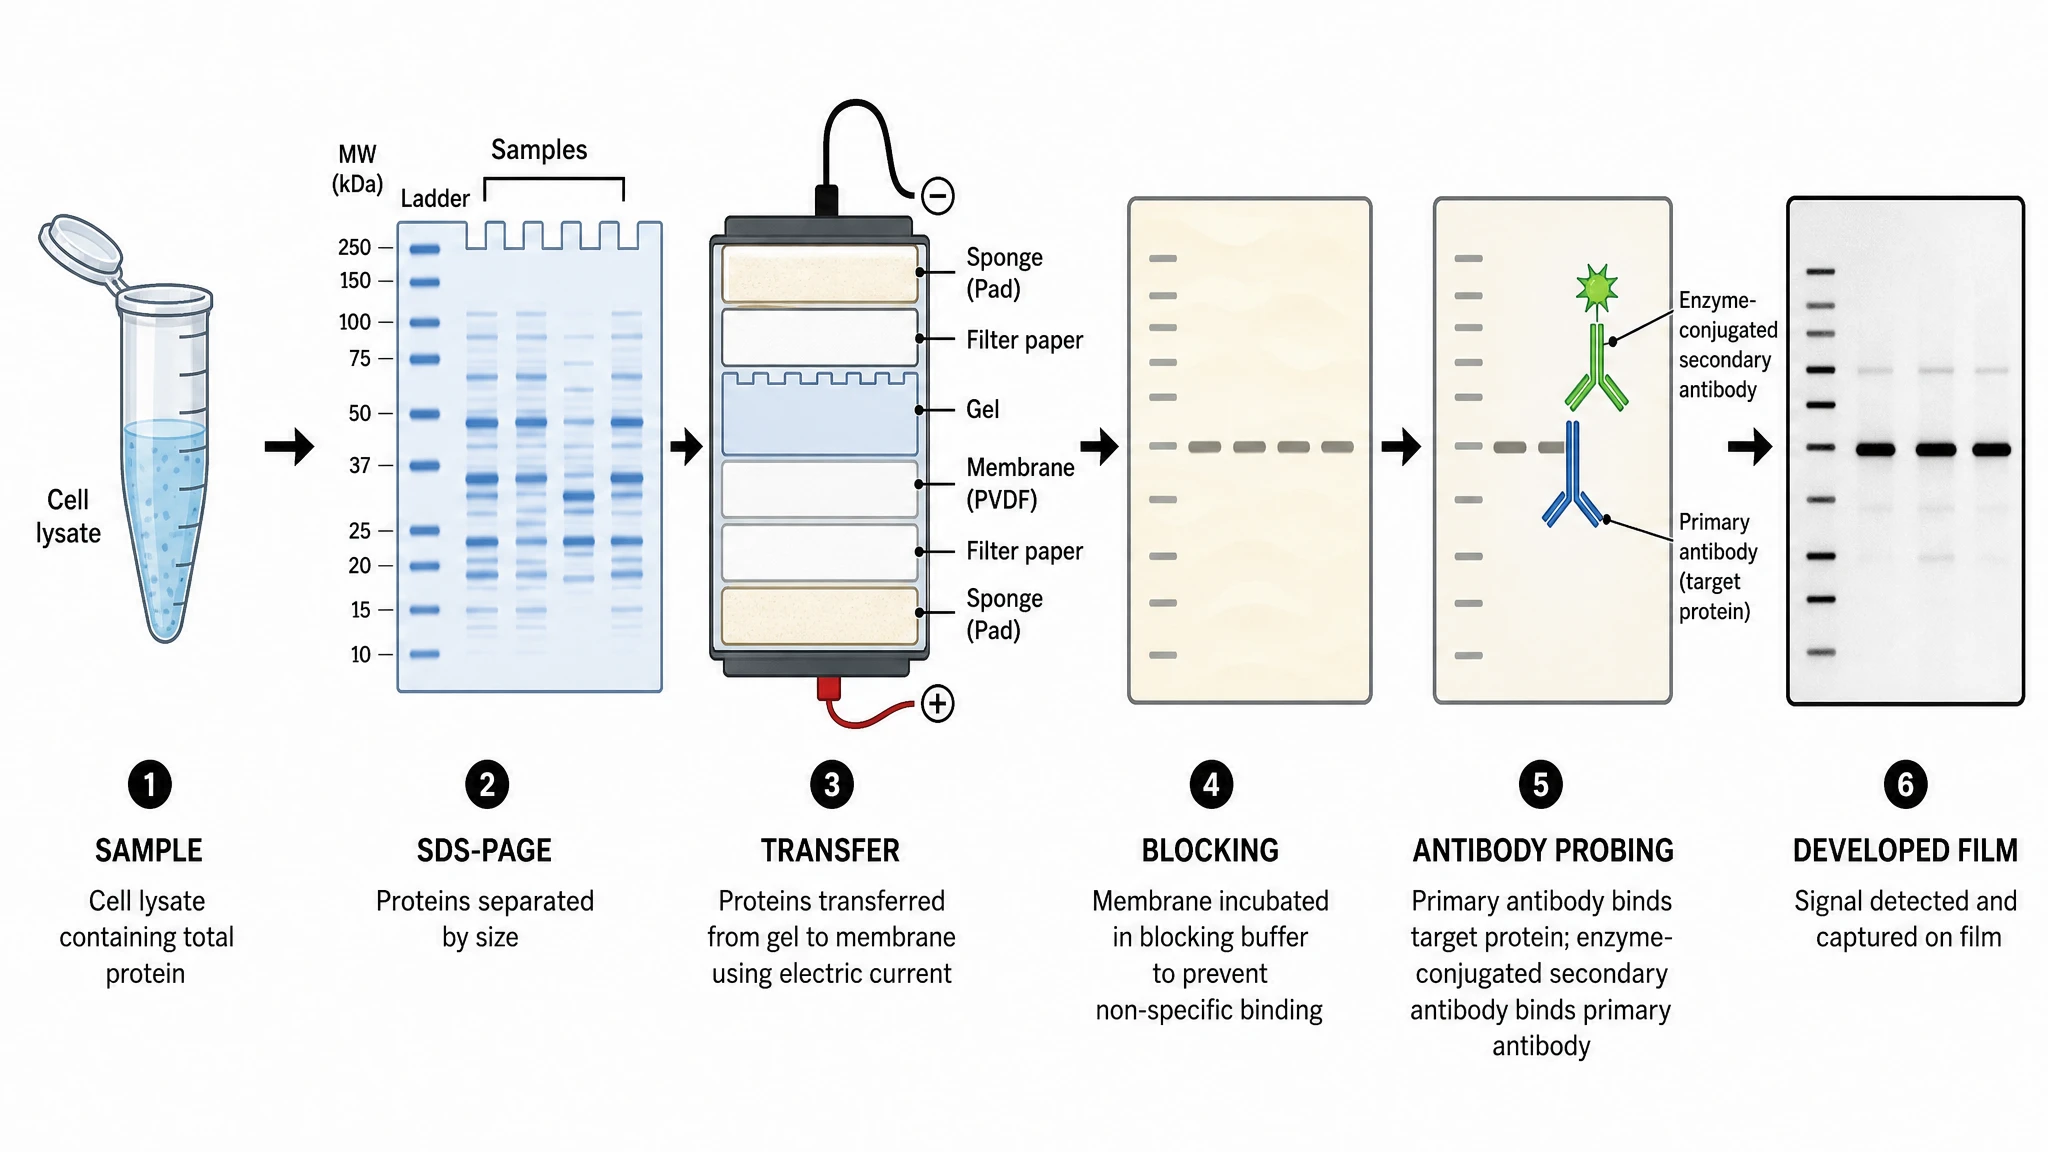
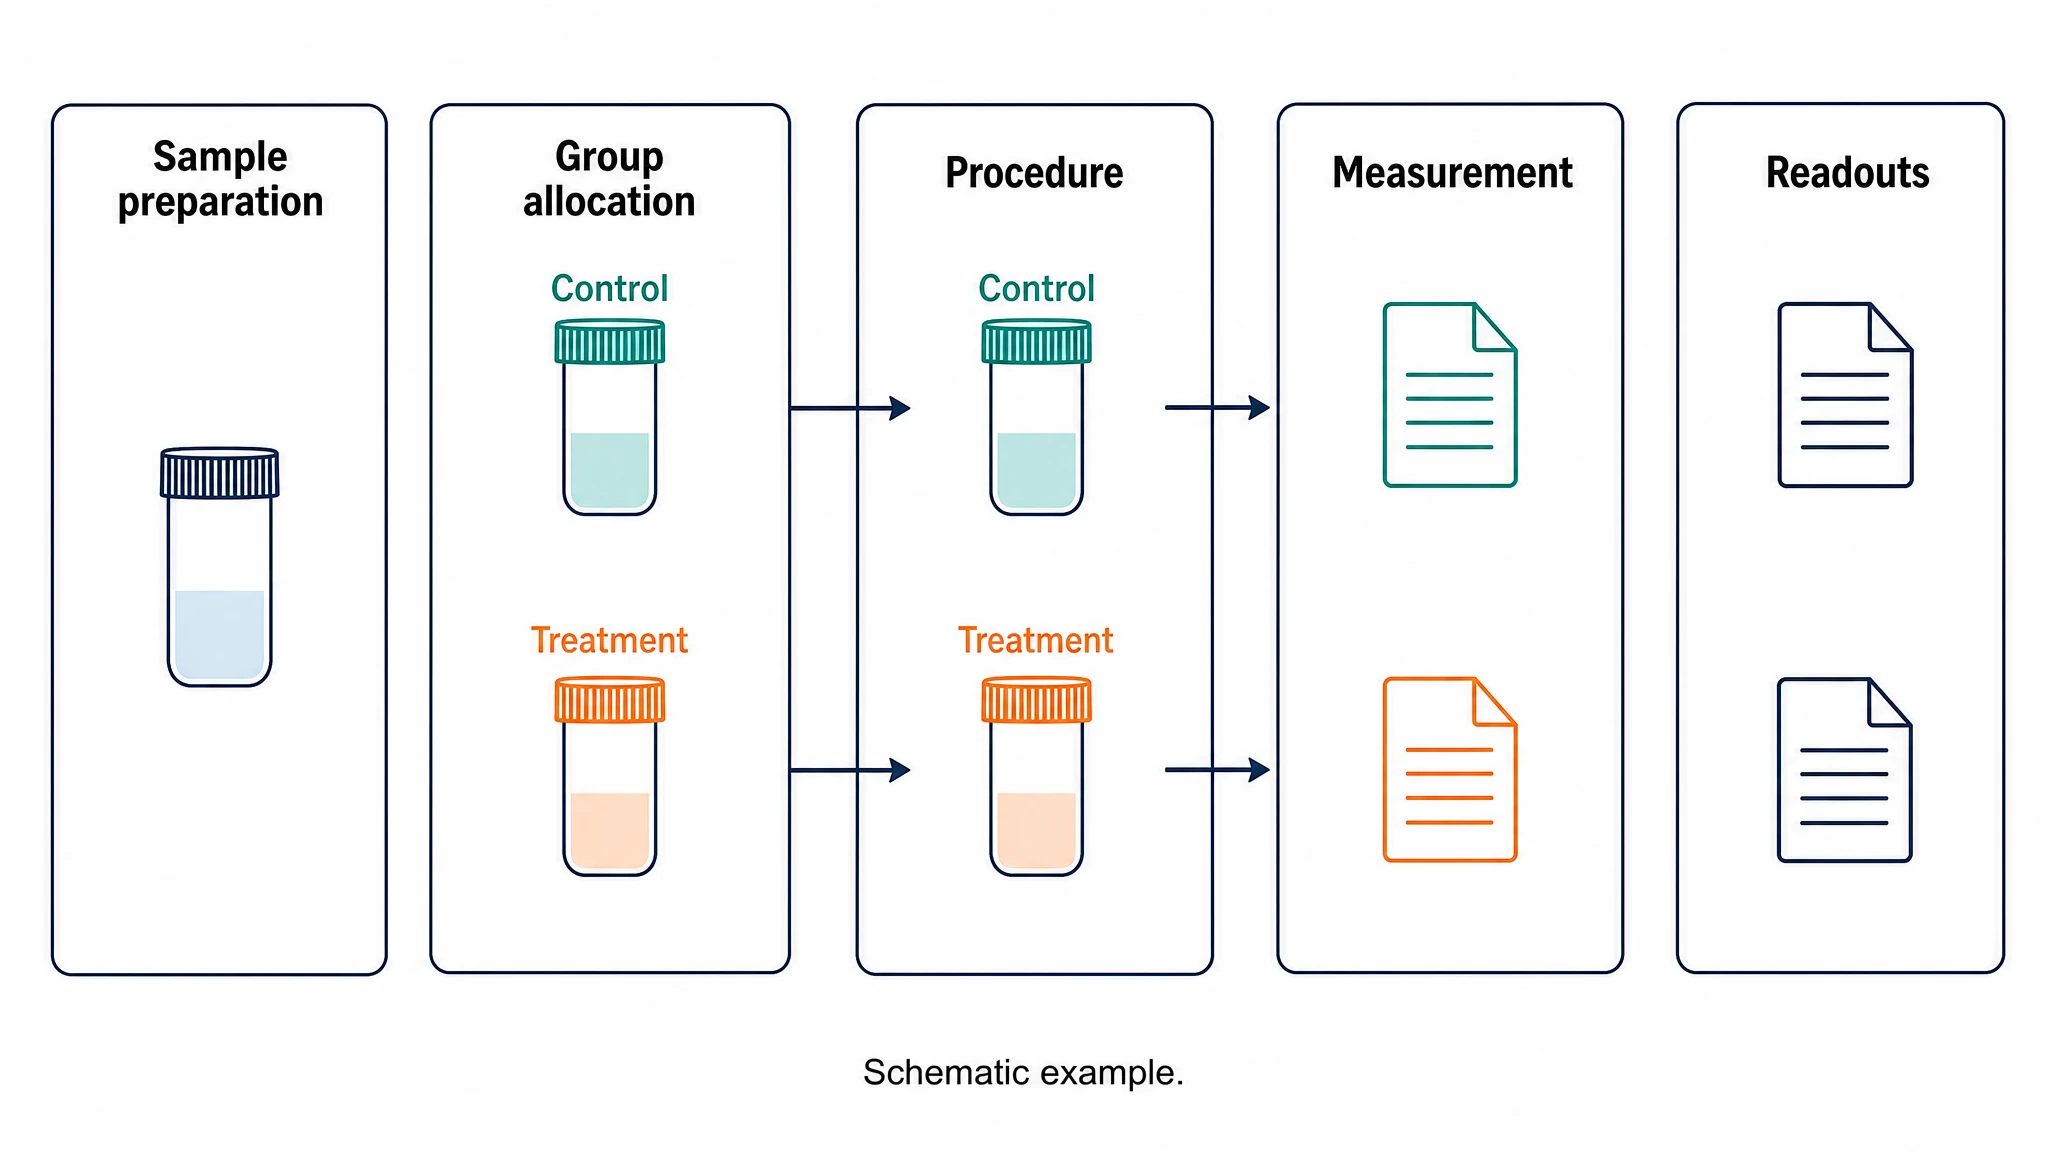
Bring the stages, handoffs and endpoints from your research notes into a methods diagram. FlowChart turns that sequence into a visual structure you can discuss and refine with the team. Use the editable figure in a protocol meeting, paper or presentation as the study workflow develops.

Explore this example
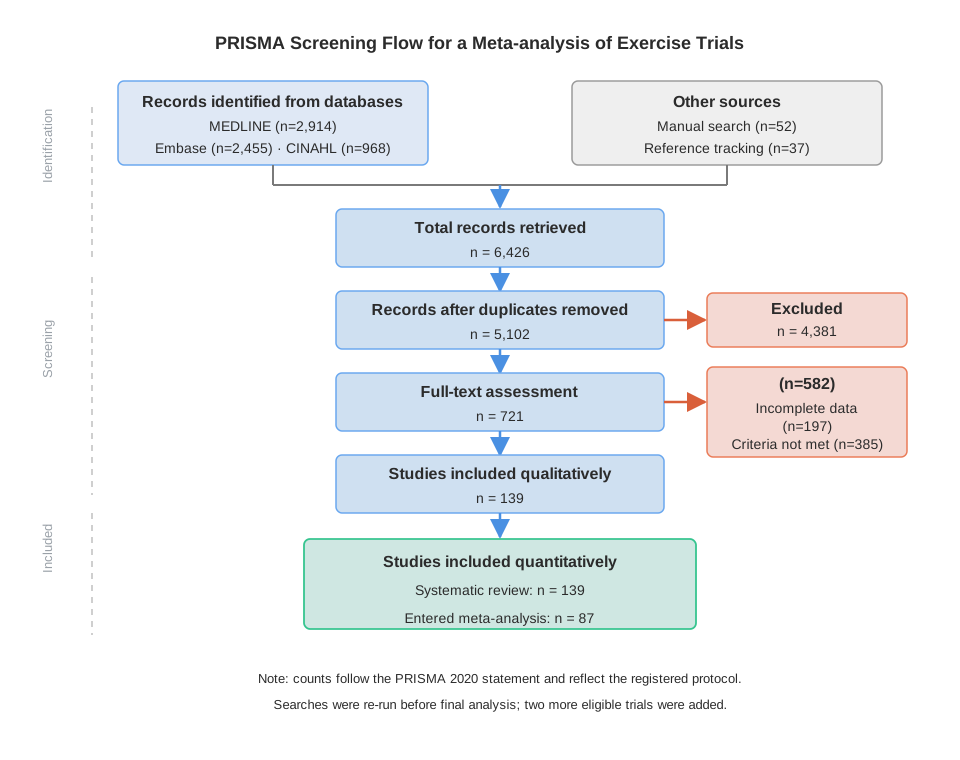
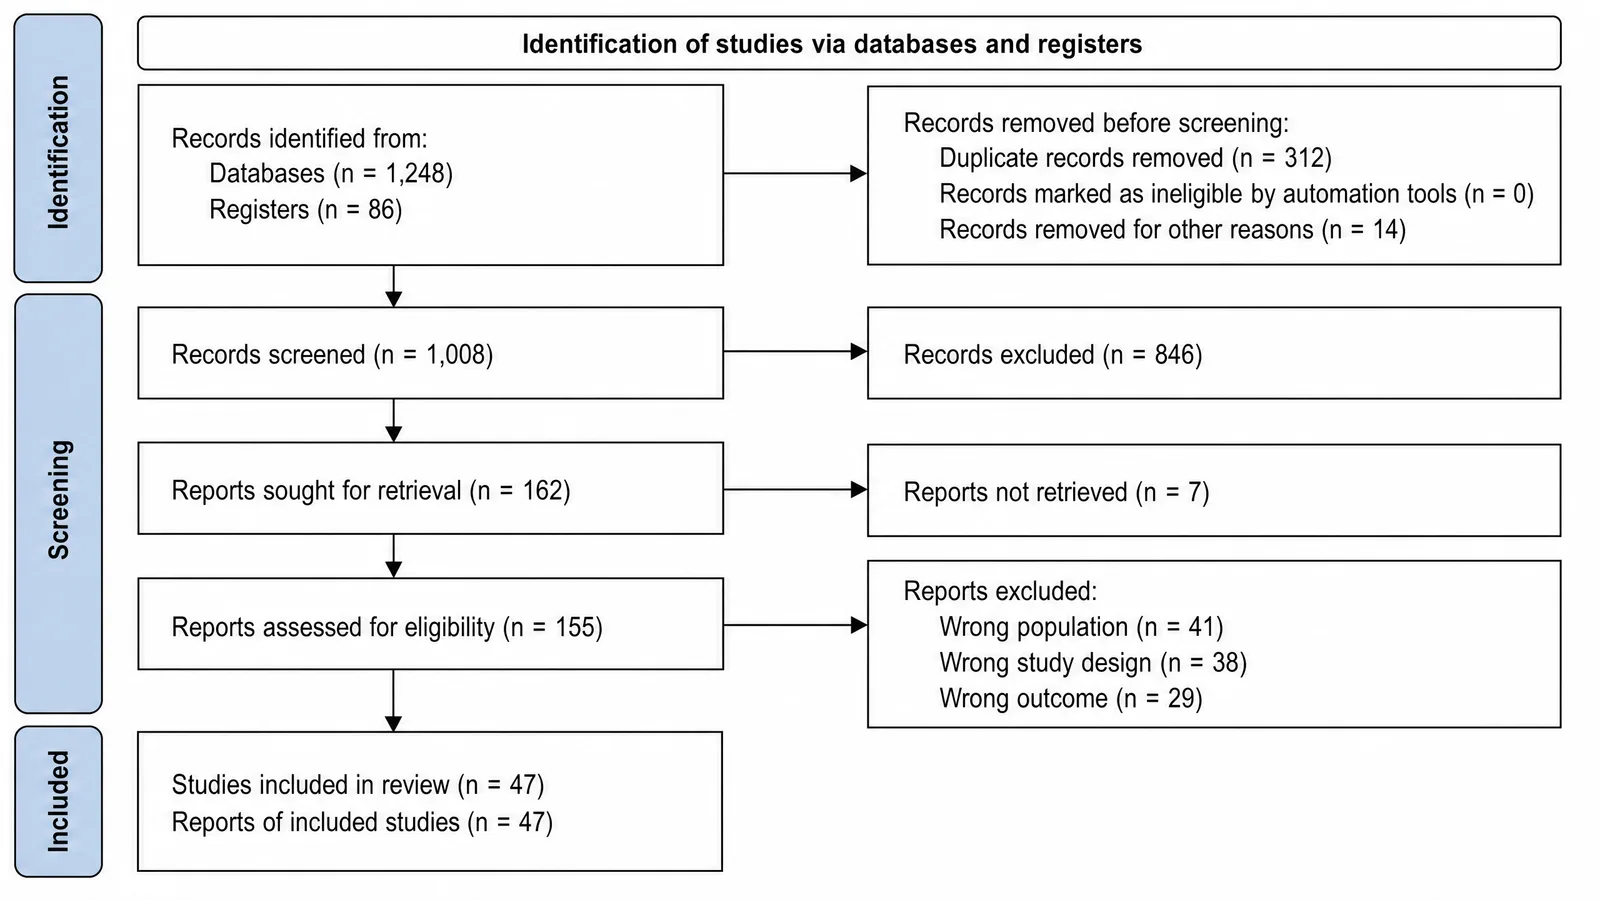
PRISMA meta-analysis flow diagram with screening and inclusion stages

PRISMA Study Selection Diagrams

Explain identification, screening and inclusion in a systematic review. Start with a relevant PRISMA template, supply the actual counts and exclusion categories, and refine the connections. FlowChart keeps every count and box editable, so the diagram matches your screening records and the applicable reporting requirements.

Explore this example
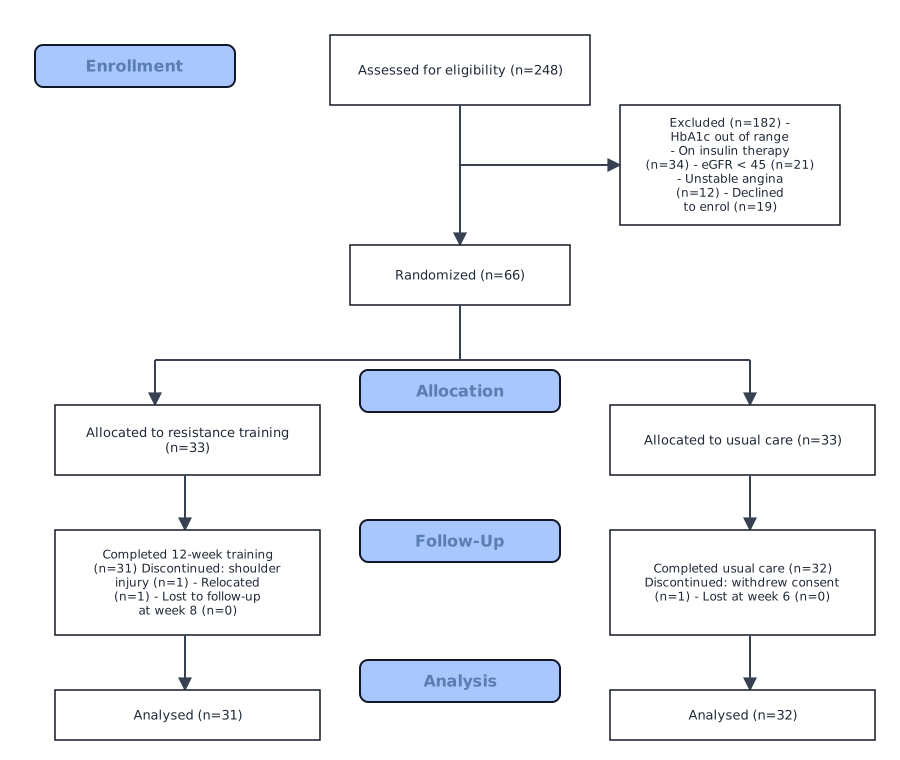
CONSORT participant enrollment flow diagram

CONSORT Participant Flow Diagrams

Show how participants move through enrollment, allocation, follow-up and analysis. A CONSORT template provides a starting structure for the study arms and outcomes. Replace example numbers and reasons with the actual records; every box stays editable, so the diagram fits the applicable reporting requirements before you add it to the report.

Explore this example
CRISPR screen hit-triage diagram with labeled decision branches

Decisions and Branching Procedures

Make a procedure’s conditions and possible outcomes visible in one diagram. FlowChart builds the branches from a written description, and you can refine the node text and connections so the figure clearly explains how a decision changes the next step.

Explore this example
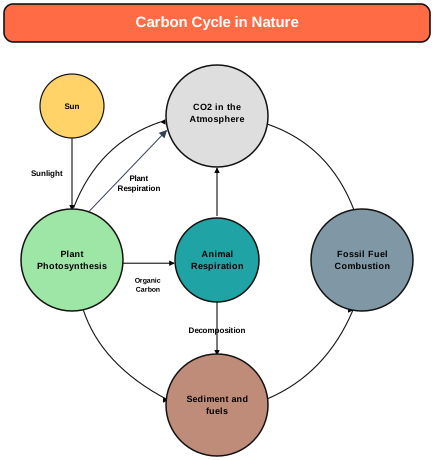
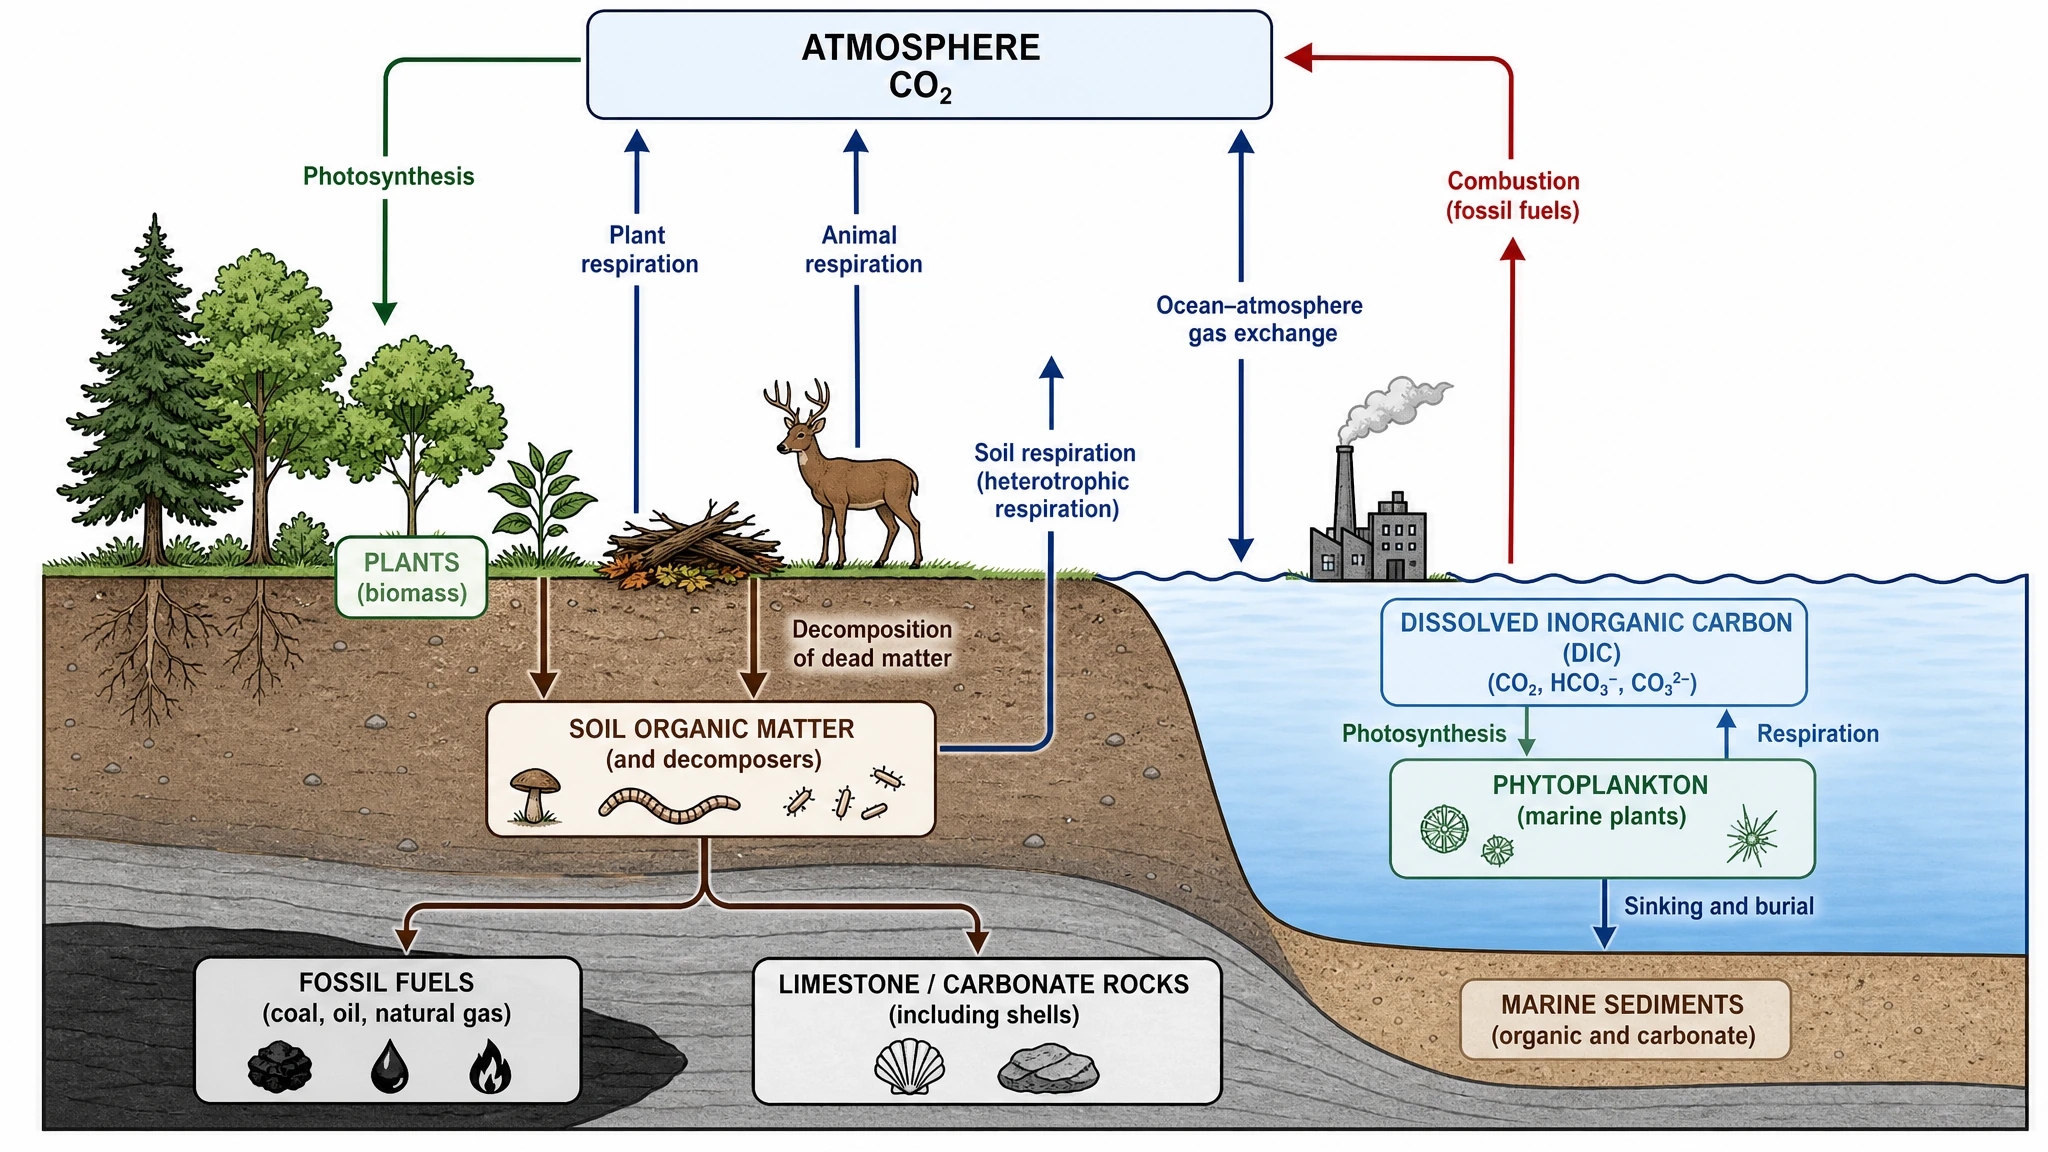
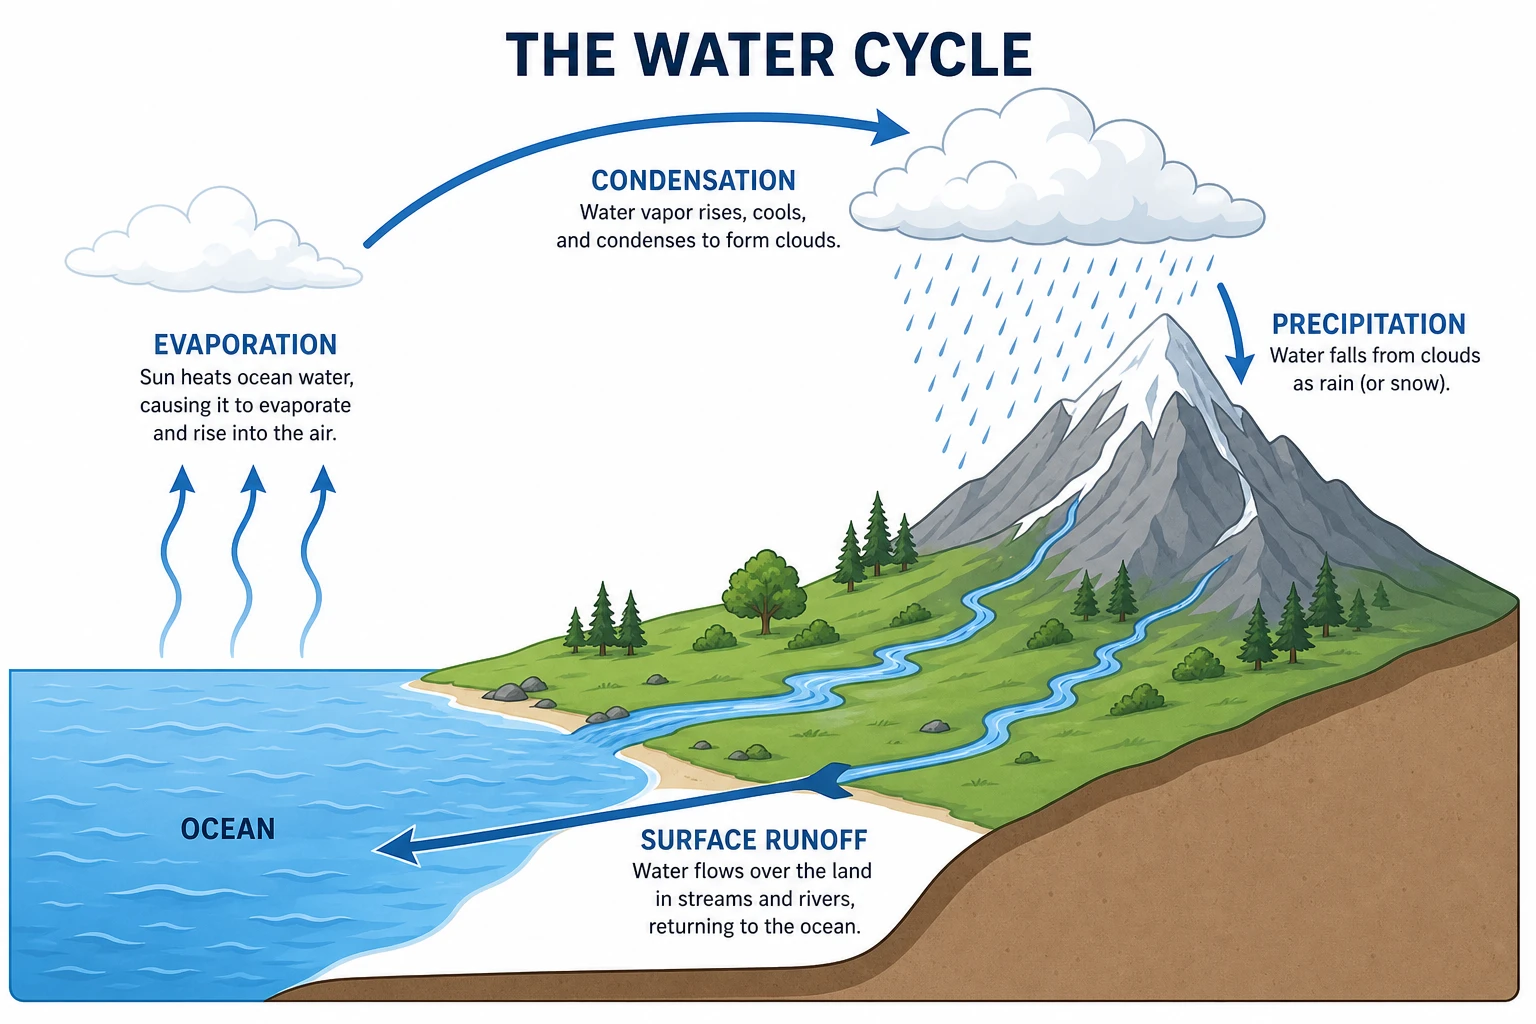
Carbon cycle diagram connecting environmental reservoirs

Scientific Cycles and Feedback Loops

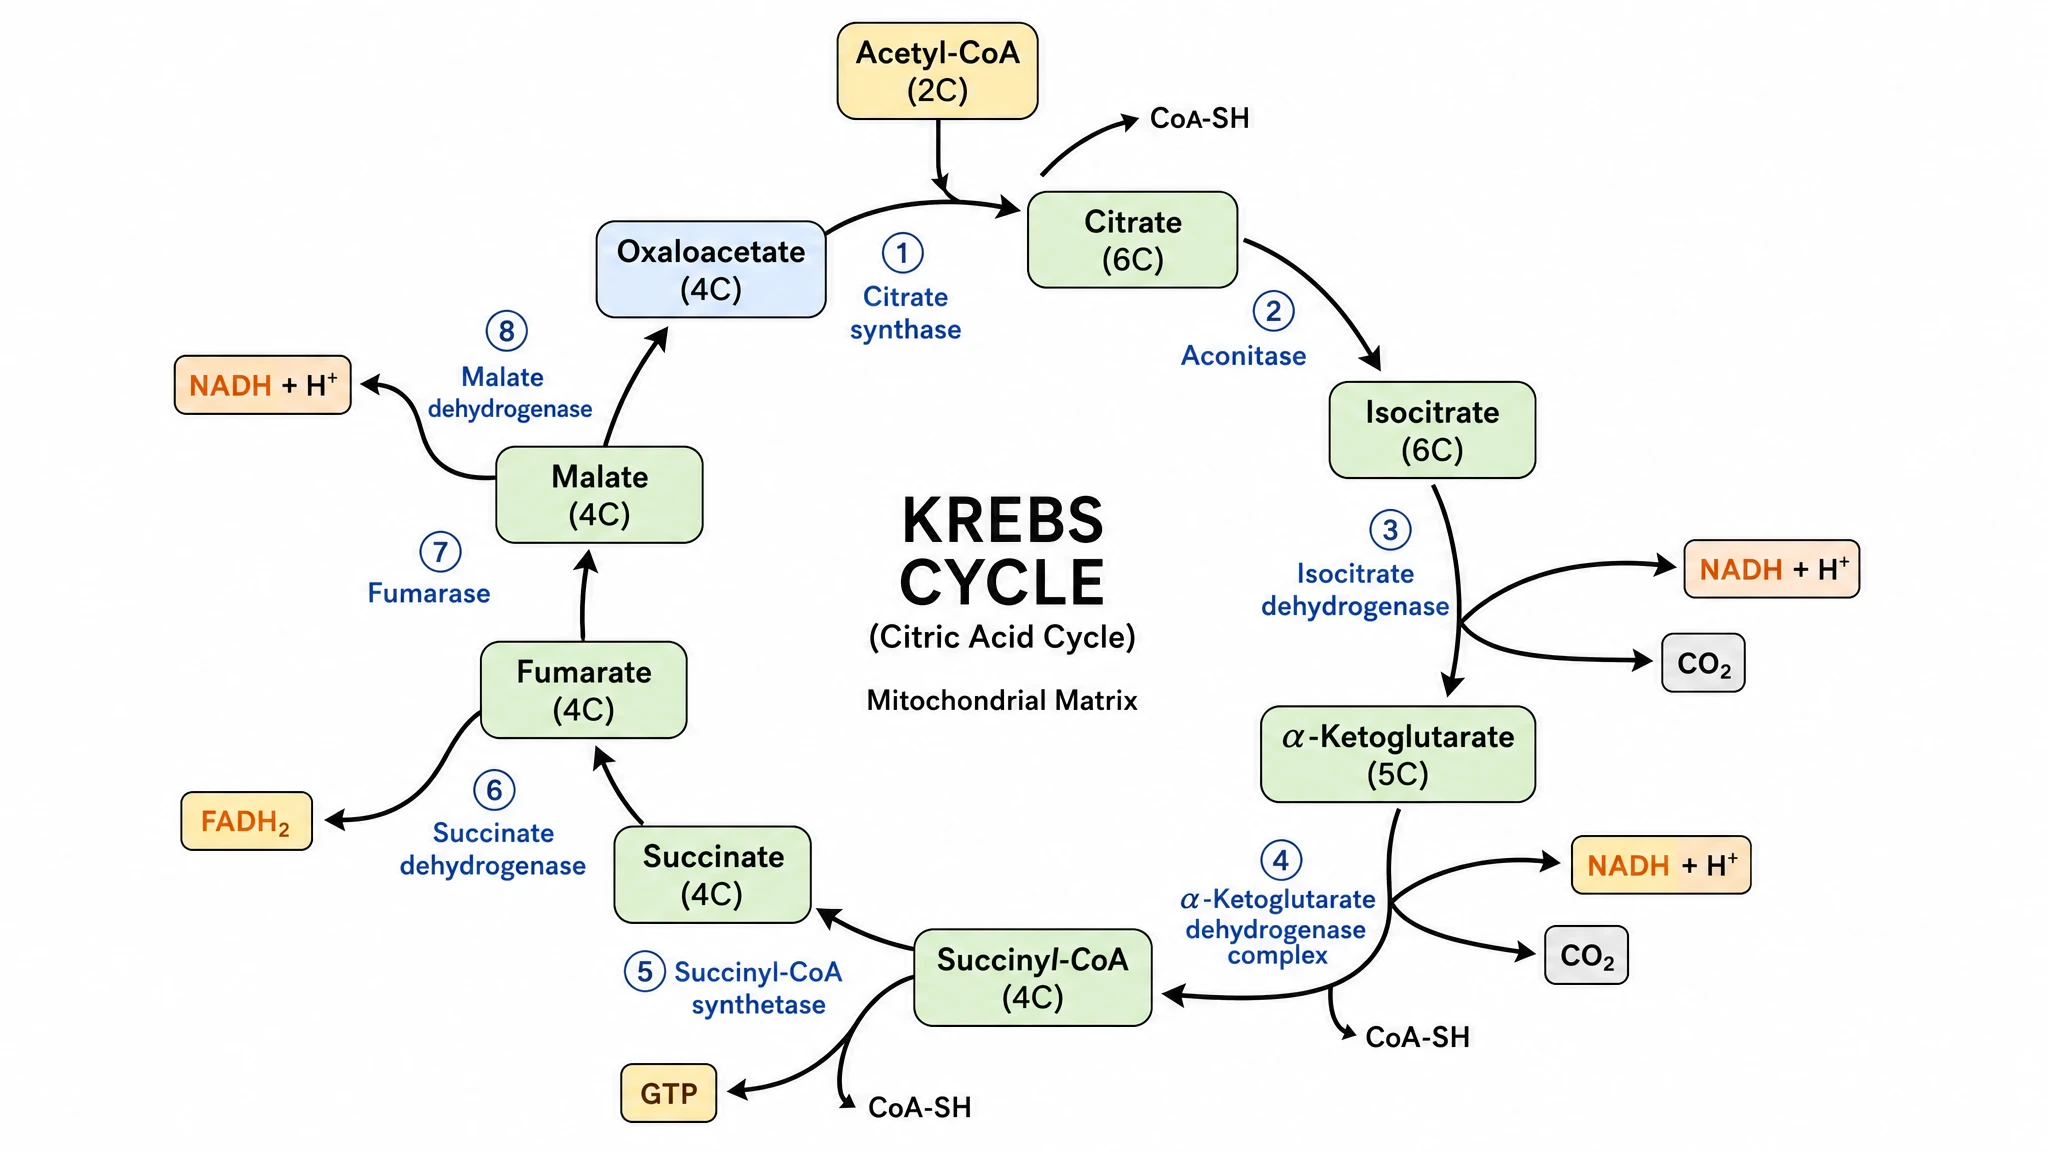
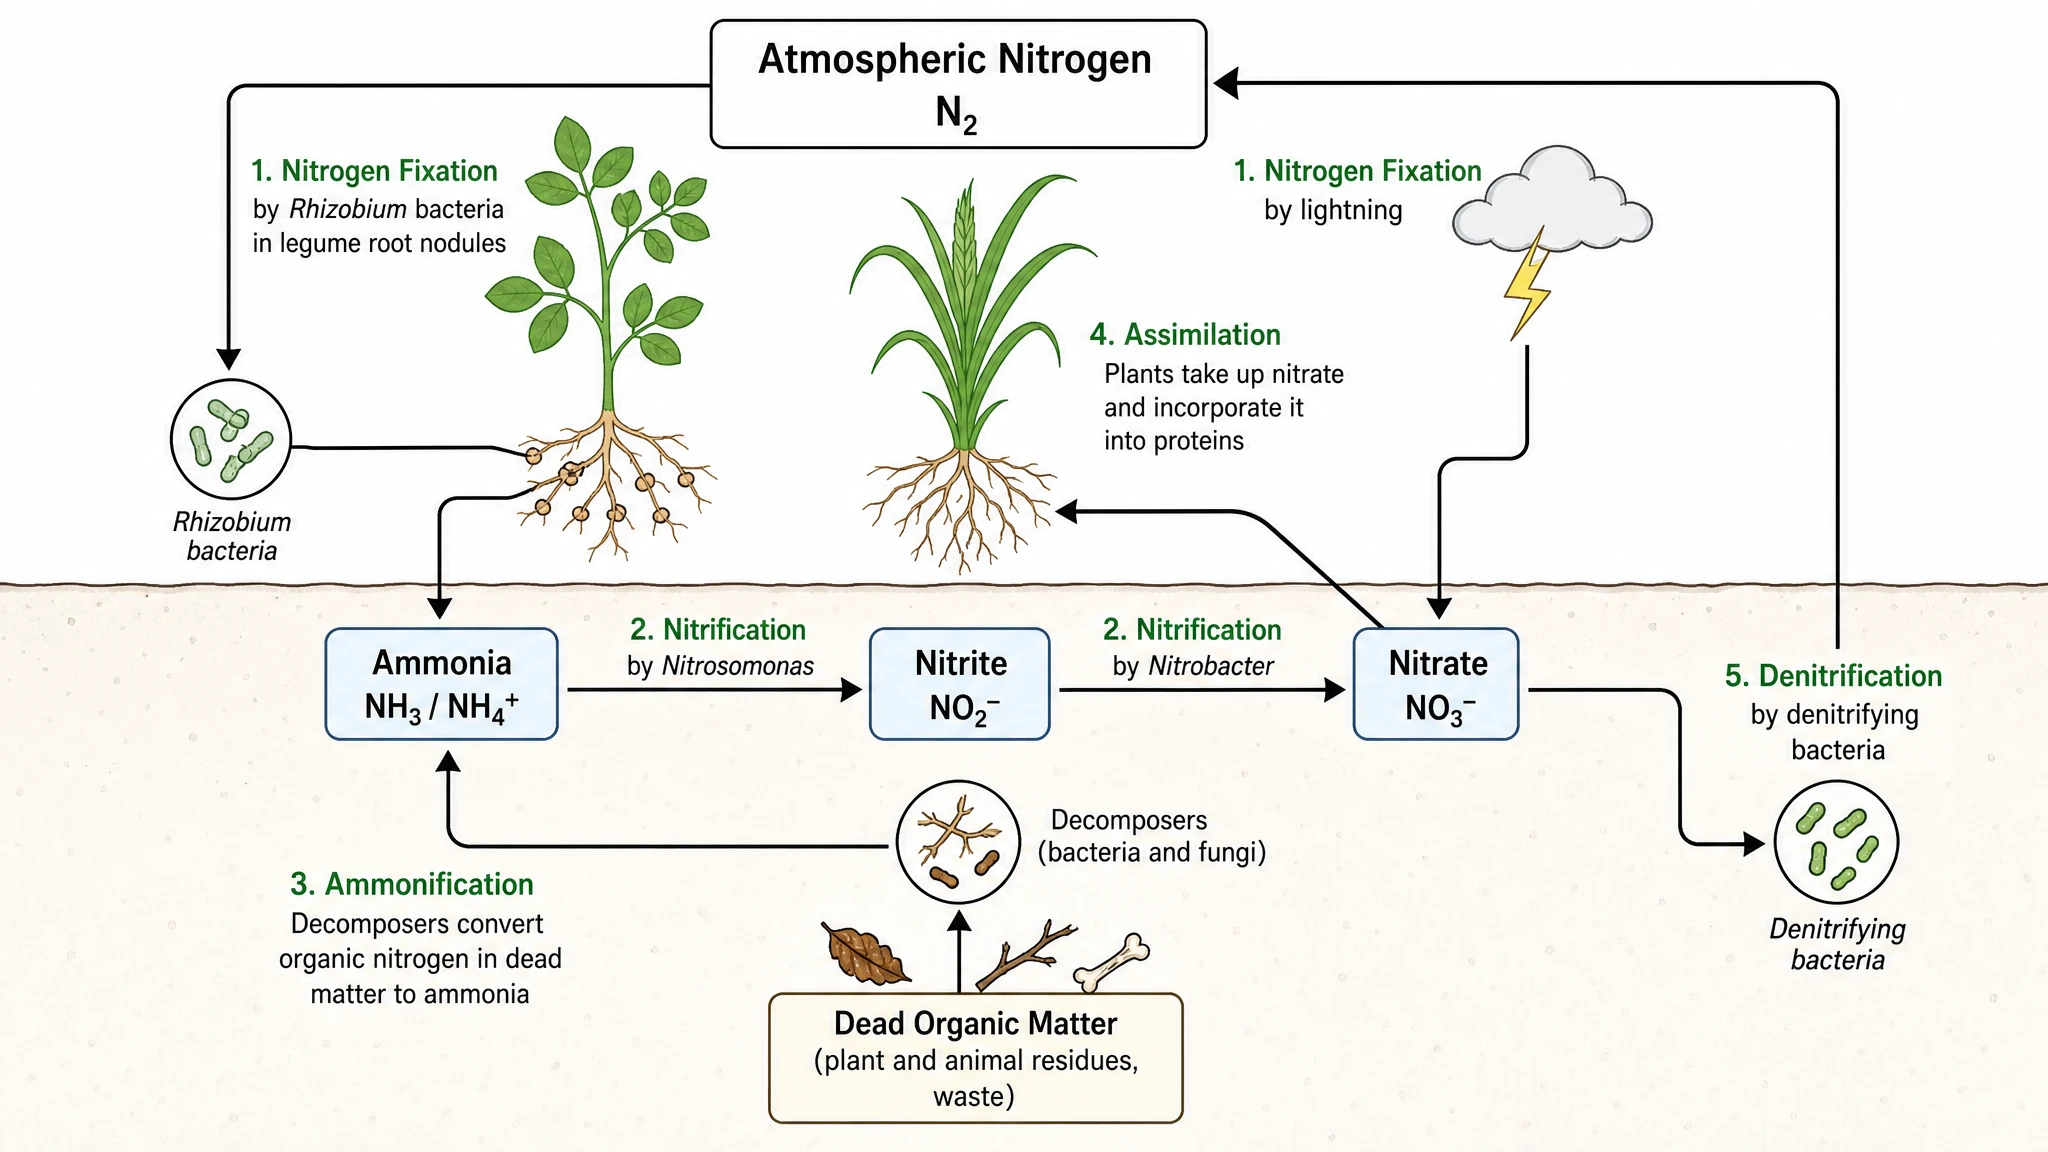
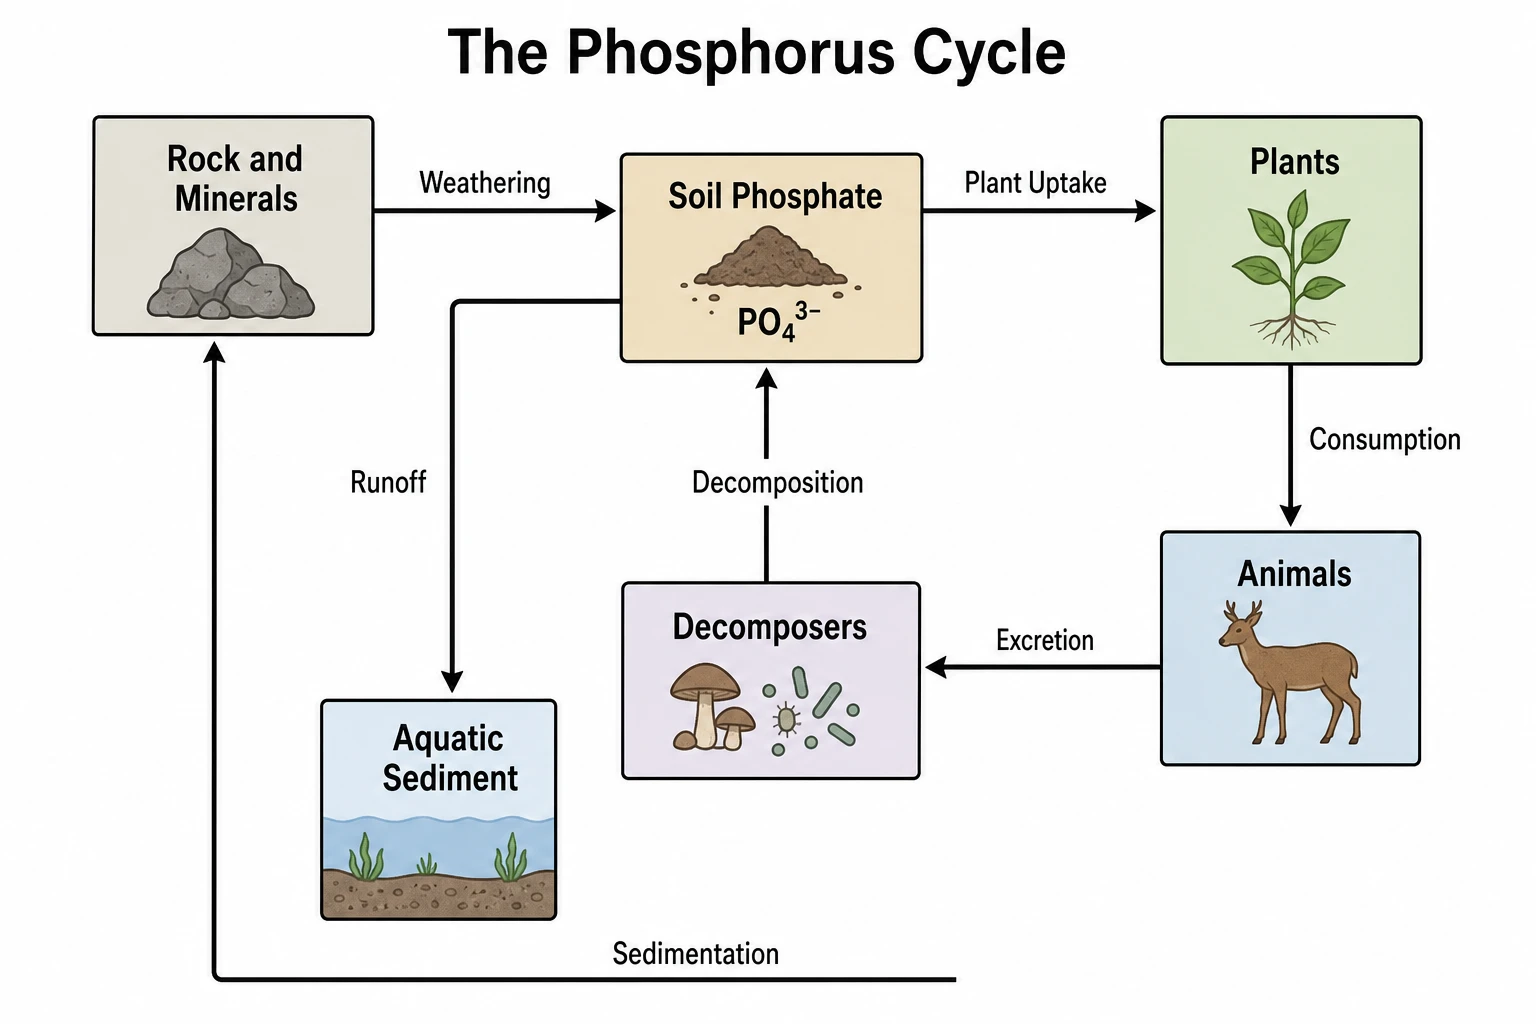
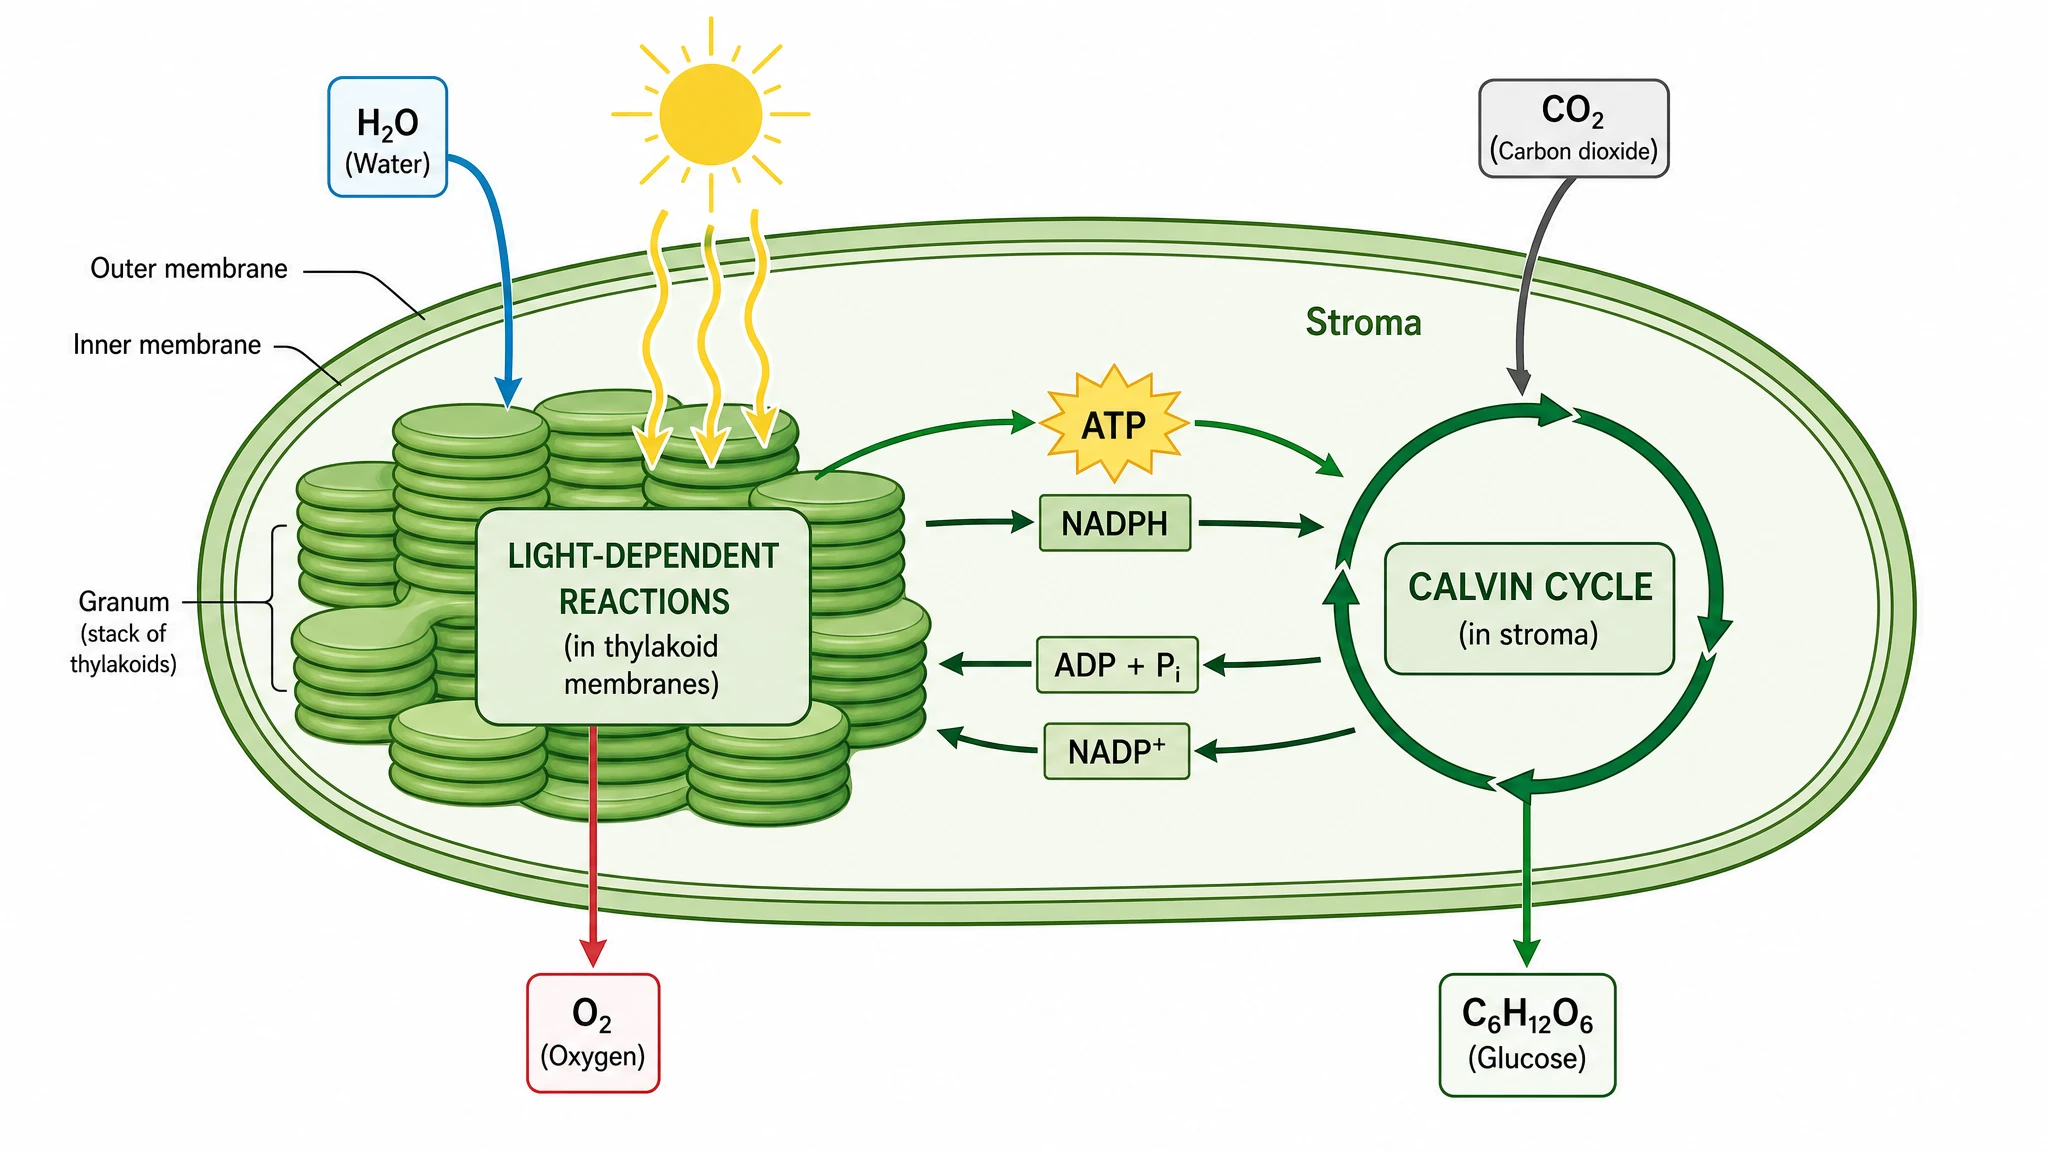
Explain how a recurring process moves through its stages and reconnects. Turning text to flowchart helps you describe the sequence, while a cycle template communicates the visual arrangement. Every arrow direction and label stays editable, ready for a lecture, handout or research explanation.

Explore this example
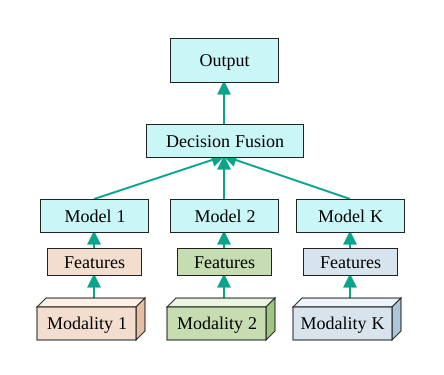
Multimodal decision-fusion model architecture diagram
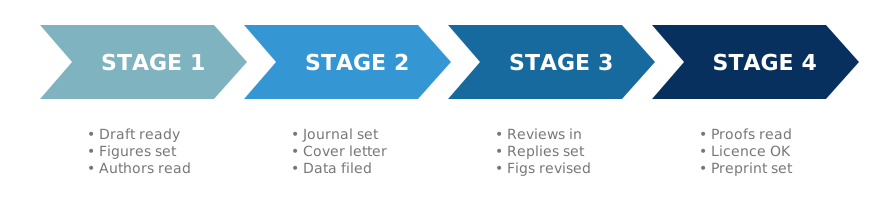
Timeline of manuscript submission stages

Model Architectures and Research Timelines

Use component names and connections to explain a model architecture, or milestones and dependencies to present a research timeline. FlowChart organizes those relationships into a diagram you can refine for a methods section or project discussion. Keep the editable structure for later changes to modules or schedules.

Explore this example
AI Flowchart Maker User Reviews

Research, teaching and presentation perspectives on using SciFig.

The recruitment procedure had been described in several emails, and the branches were easy to miss. I used the flowchart maker to organize the agreed steps and decision points. Editing the labels gave our team one readable reference for the study briefing, which was more useful than repeatedly forwarding the same collection of messages.
Amelia Ward

Clinical research coordinator, University of Cambridge

Free tools

A tool for every scientific figure

105 focused generators for the scientific figure you need — each opens in the right workspace with a matching example.

AI Flowchart Maker FAQs

1.

2.

3.

4.

5.

6.

Call to action background

Your Process, Clearly Connected

Turn Your Process into a Flowchart

Describe Your Process

Free to start · No credit card required · Built for researchers