Phosphorus Cycle Diagram Generator
Generate clear phosphorus cycle diagram figures and flow charts showing phosphate movement through rocks, soil, living organisms, and aquatic sediments.
Figure prompt
Core Subject (e.g., Cas9 protein cutting DNA)
Action / Details (e.g., Double strand break, detailed molecular view)
Start with 100 free credits|No credit card required
Get up to 300 free credits on day one when you join through an invite.
Reviewed by SciFig TeamUpdated
Phosphorus Cycle Diagram Generator— templates & examples
Everything you need to create accurate phosphorus cycle diagrams
Generate labeled phosphorus cycle flow charts for any course level
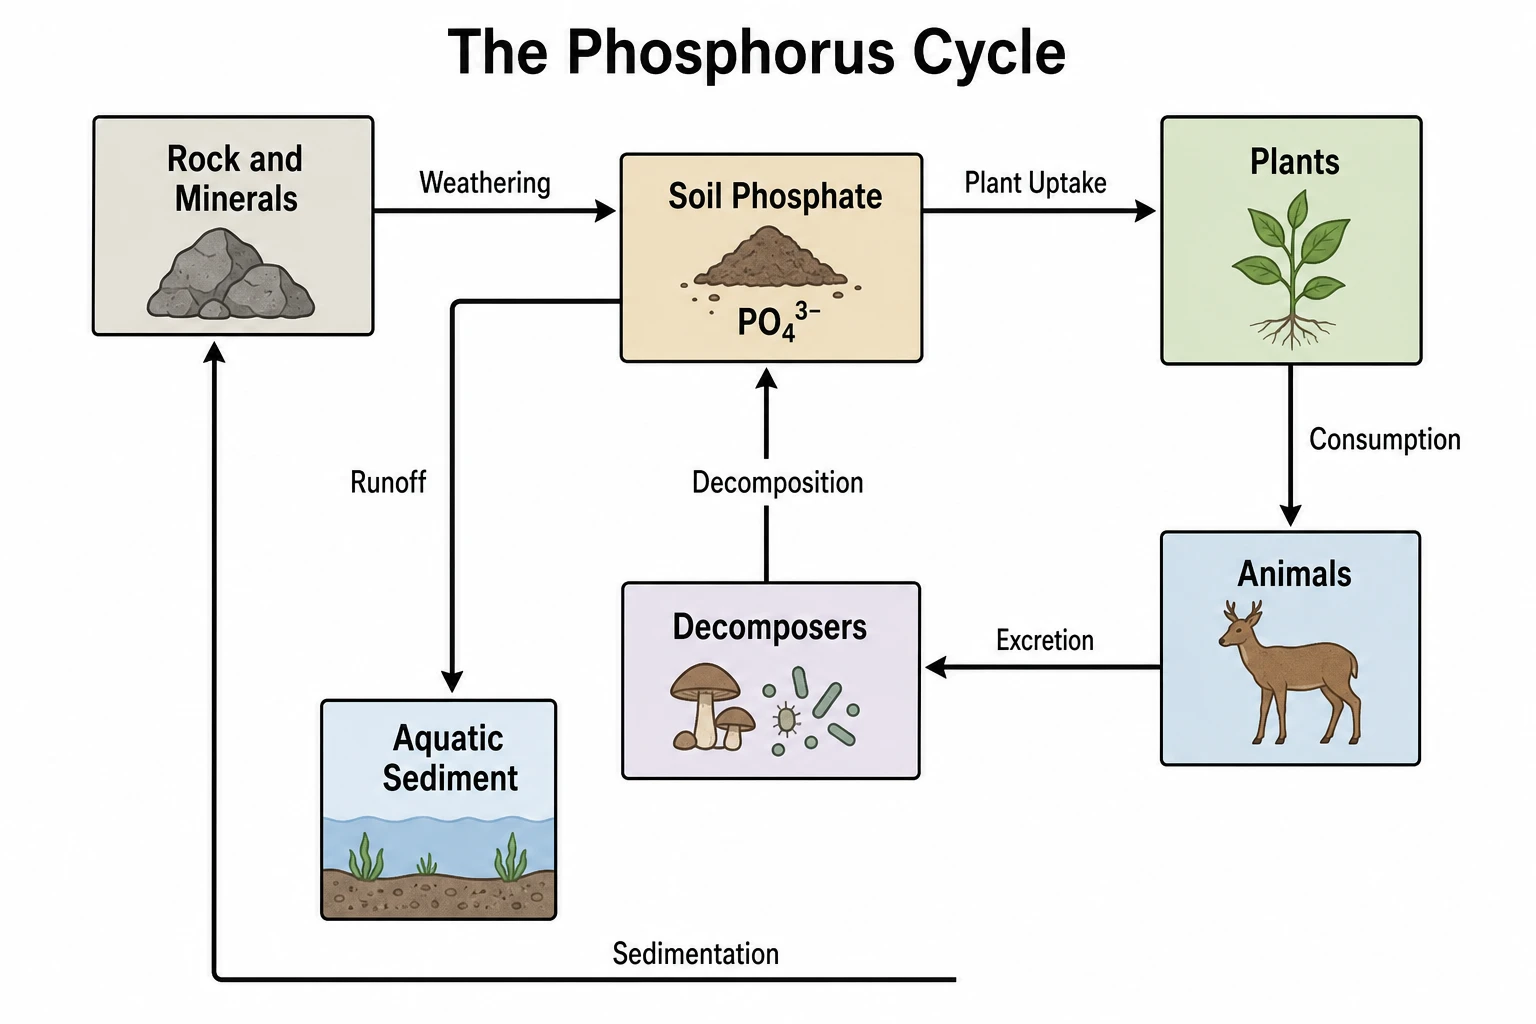
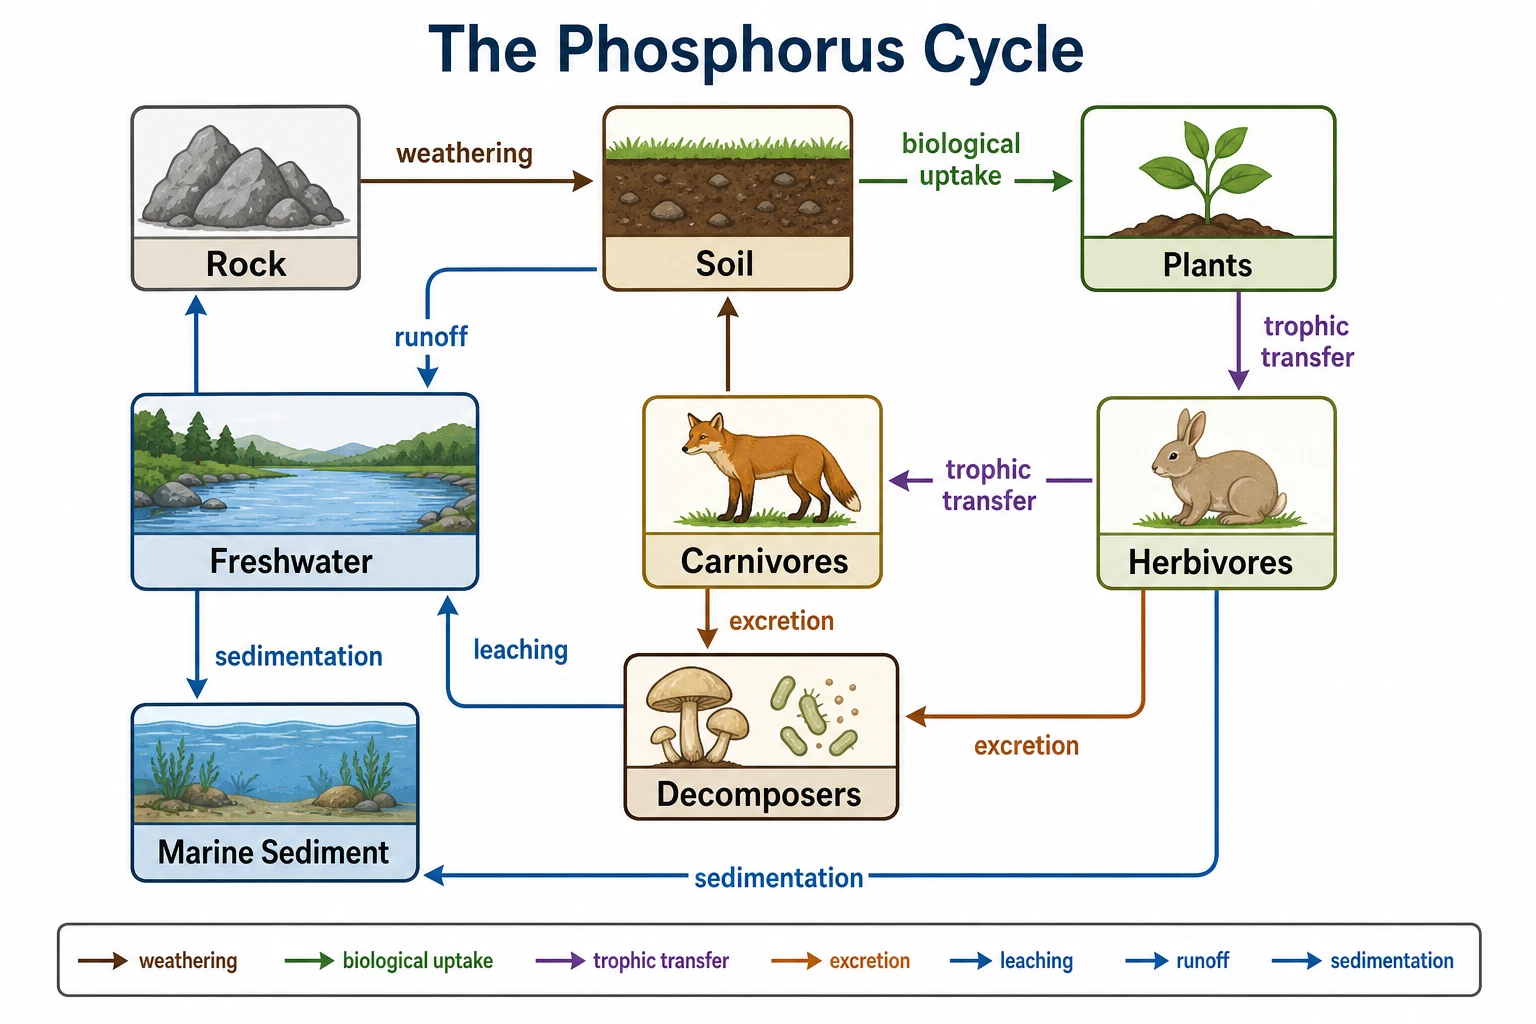
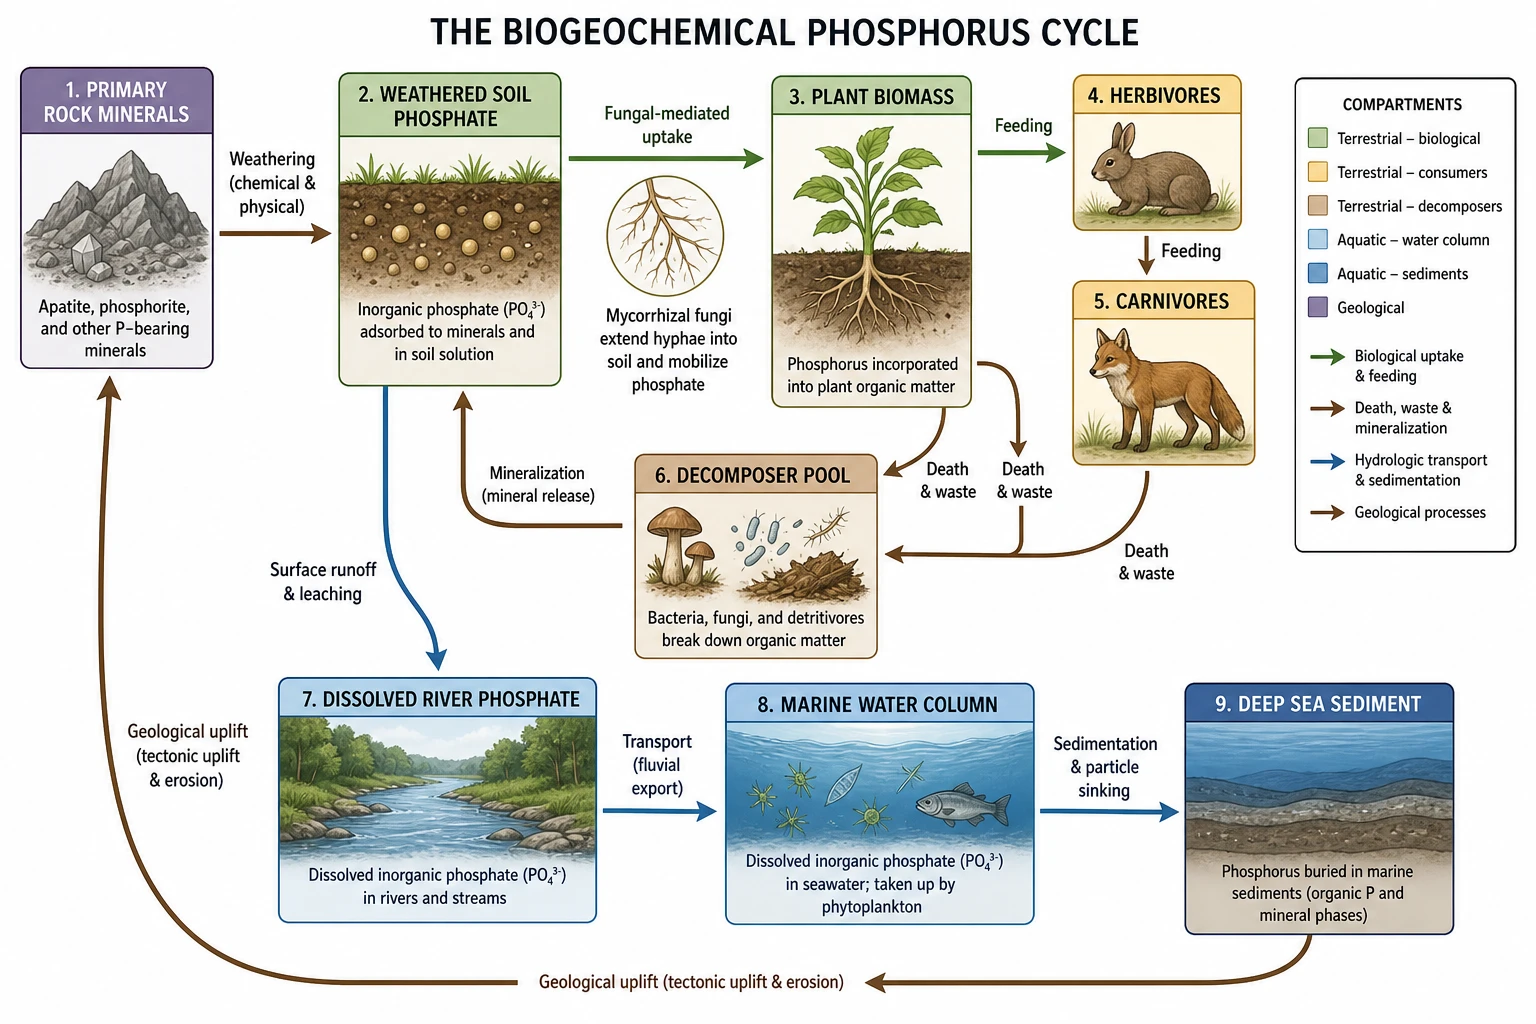
An accurate phosphorus cycle diagram must correctly show the absence of an atmospheric phase and the central role of rock weathering — details that generic diagram tools often get wrong. SciFig's phosphorus cycle diagram generator produces scientifically accurate flow charts with labeled phosphate pools, weathering and uptake fluxes, decomposition pathways, and sedimentation steps, at the level of detail required for your course or publication.
Customize pools and fluxes for simple or advanced diagrams
Simple phosphorus cycle diagrams for introductory courses need only the five or six core steps. Advanced ecology or geochemistry diagrams may include mycorrhizal uptake, phosphate export to rivers and oceans, marine biological pump, and geological uplift over millions of years. SciFig's easy phosphorus cycle flow chart tool generates either version — describe the complexity level you need.
Export publication-ready phosphorus cycle figures
Export your phosphorus cycle diagram at any resolution for textbooks, research papers, or presentations. SciFig produces fully editable figures — relabel pools, adjust arrow weights, and highlight specific fluxes such as the decomposition-to-soil-phosphate pathway before exporting as high-resolution image or vector.
What is a phosphorus cycle diagram?
The phosphorus cycle is the biogeochemical cycle describing how phosphorus moves through rocks, soil, living organisms, and aquatic sediments, with no significant atmospheric phase unlike carbon or nitrogen. A phosphorus cycle diagram maps these pathways with labeled boxes and arrows for ecology and biogeochemistry courses. With SciFig's phosphorus cycle diagram generator you describe the detail level needed and receive a labeled, accurate flow chart ready for class or publication.
Why the phosphorus cycle diagram matters in biology and ecology
- Phosphorus is the limiting nutrient in most freshwater and many terrestrial ecosystems
- Required for DNA, RNA, ATP synthesis, and cell membrane phospholipids in all living cells
- Understanding the phosphorus cycle is essential for agriculture, eutrophication management, and conservation
- The slow geological timescale of phosphorus cycling makes it uniquely important in long-term ecosystem models
- Taught in AP Biology, environmental science, ecology, biogeochemistry, and earth systems science courses
- Critical for understanding fertilizer use, watershed management, and lake eutrophication
Key components of a phosphorus cycle diagram
- Rock and mineral pool — phosphate-bearing rocks (primarily apatite) as the primary geological source
- Weathering flux — arrows showing physical and chemical breakdown releasing dissolved phosphate to soil and water
- Soil phosphate pool — inorganic phosphate available for plant and microbial uptake
- Plant and microbial uptake — arrows from soil to primary producers, including mycorrhizal fungi pathways
- Consumer transfer — arrows tracking phosphorus through food webs from plants to herbivores to carnivores
- Decomposition return — arrows from dead organic matter back to soil inorganic phosphate via decomposers
Where phosphorus cycle diagrams are used
- AP Biology, IB Biology, and university ecology courses covering nutrient cycles
- Environmental science research on eutrophication, watershed management, and lake restoration
- Biogeochemistry and earth systems science textbooks and course materials
- Agricultural science courses explaining fertilizer dynamics and soil phosphorus management
- Research publications on ecosystem nutrient cycling, carbon-phosphorus coupling, and climate interactions
- Science communication materials for conservation organizations and environmental agencies
How to make a phosphorus cycle diagram
Describe your phosphorus cycle diagram
Tell SciFig what to draw in plain language — no design tools required.
Generate with SciFig
Get a clean, publication-ready figure that matches your description in seconds.
Edit & export
Vectorize it into editable SVG, relabel everything, and export for your paper, poster, or slides.
Phosphorus Cycle Diagram Generator — Frequently Asked Questions
Common questions about Phosphorus Cycle Diagram Generator.
More tools

Conceptual Framework Generator
Create professional conceptual framework diagrams showing variable relationships, hypotheses, and theoretical models for your research.

Free Body Diagram Generator
Create accurate, publication-ready free body diagrams with labeled force vectors for weight, normal force, friction, and tension in seconds.

Bell Curve Generator
Generate a precise, fully labeled bell curve showing mean, standard deviations, and percentile regions — ready to export for your paper, thesis, or classroom.
Related links
Home
Turn text, sketches, references, PDFs, and photos into Scientific Figures
Text-to-Figure
Generate a figure from a plain-language description
Models
Default to GPT Image 2 for journal papers; switch to Nano Banana Pro for slides and posters; pick Nano Banana 2 for routine figure work
Tutorials
Seven short walkthroughs of the AI scientific figure generator
Blog
Tutorials, tool comparisons, and publication tips for researchers.
Inspiration
Explore publication-ready scientific figure examples, copy the prompts, and use them as starting points for your own work.

Ready to publish?
Make your own phosphorus cycle diagram in minutes.
Start for freeFree to start · No credit card required · Built for researchers