
Pedigree Chart Maker
Create an accurate pedigree chart with standard pedigree symbols — squares for males, circles for females, filled for affected — mapped across generations for inheritance analysis.
Figure prompt
Core Subject (e.g., Cas9 protein cutting DNA)
Action / Details (e.g., Double strand break, detailed molecular view)
Start with 100 free credits|No credit card required
Get up to 300 free credits on day one when you join through an invite.
Reviewed by SciFig TeamUpdated
Pedigree Chart Maker— templates & examples
Everything you need to build your pedigree chart
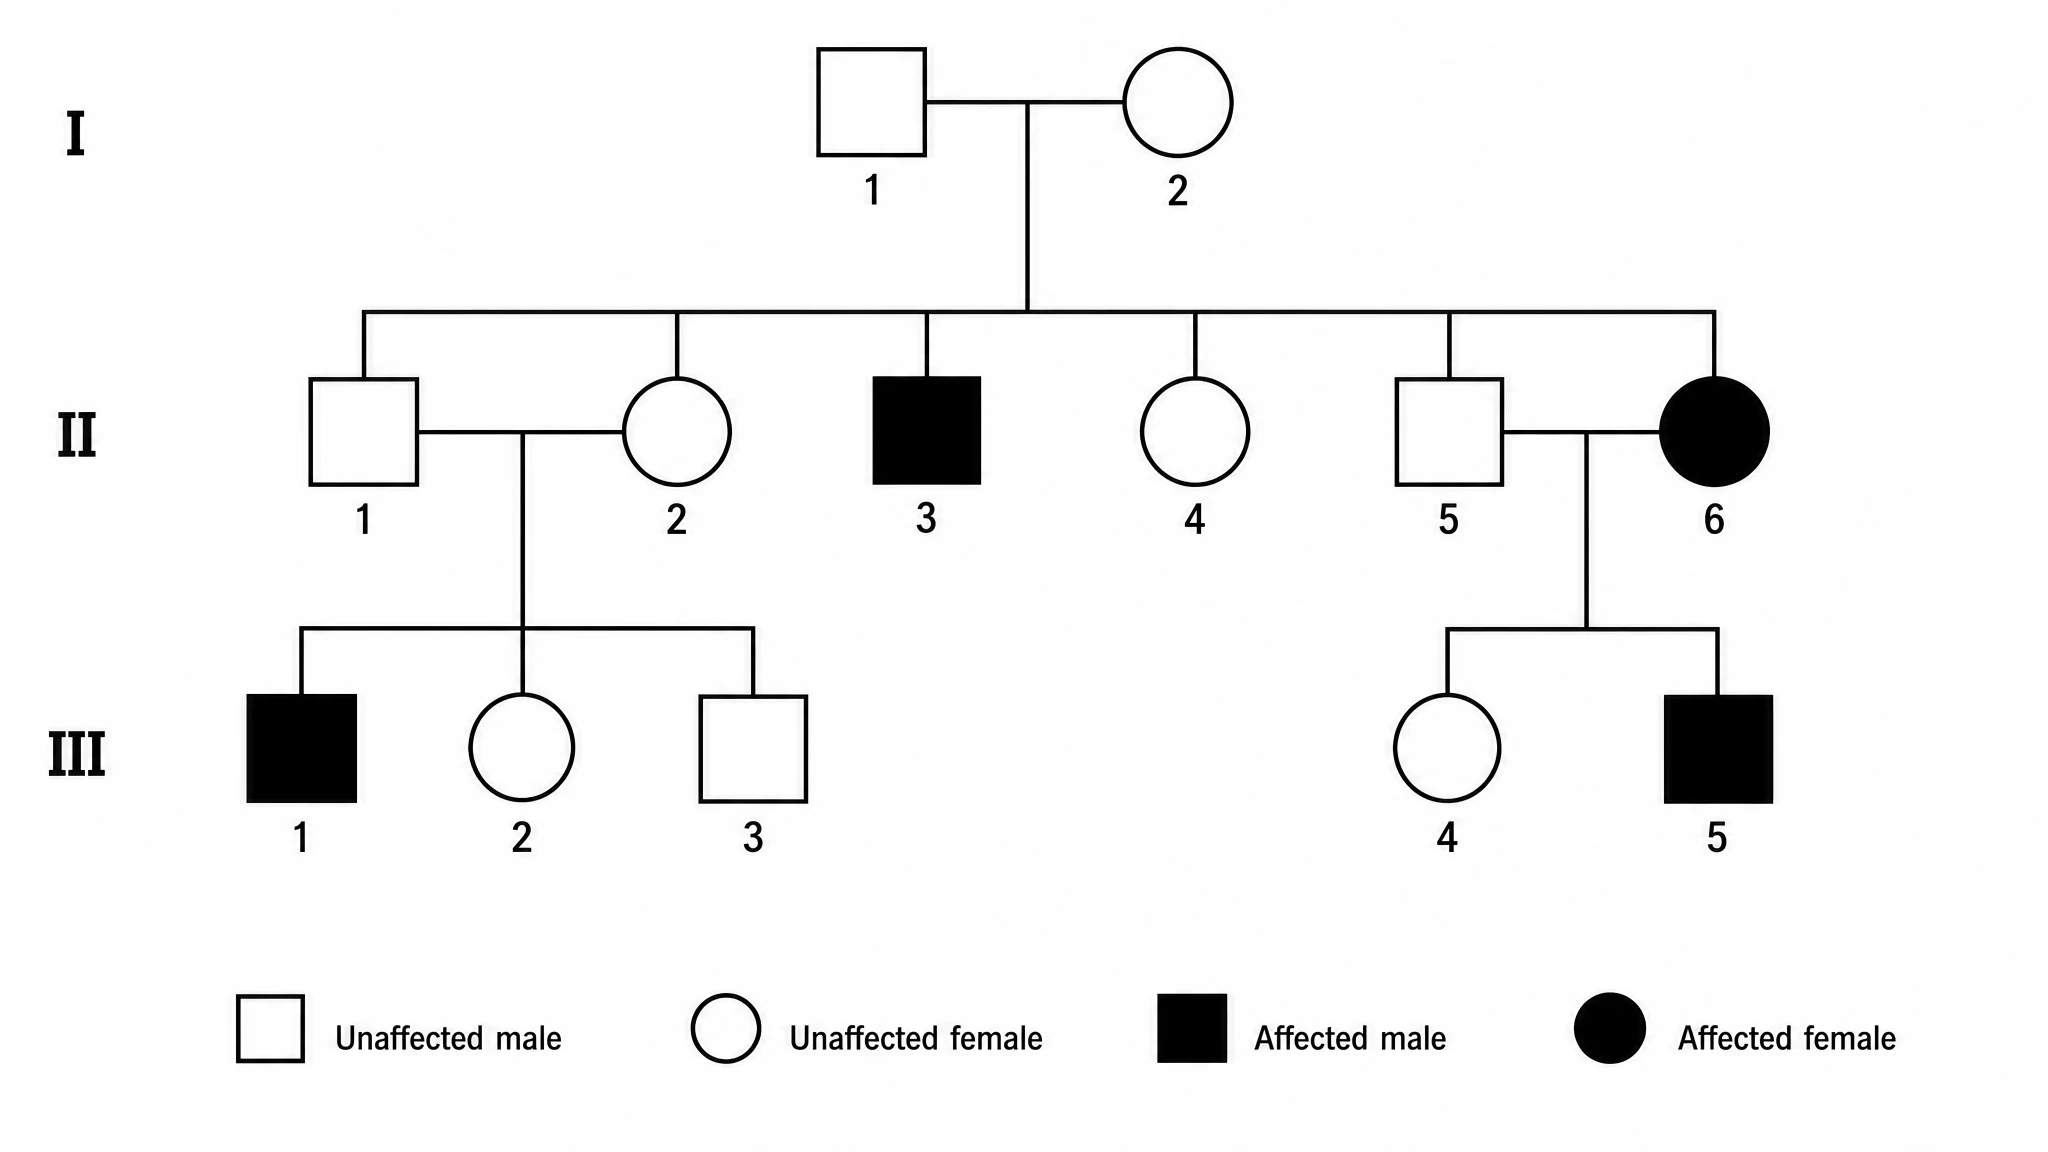
Standard pedigree symbols, applied correctly
Every figure SciFig generates uses the universally accepted standard pedigree symbols — squares for males, circles for females, filled symbols for affected individuals, horizontal mating lines, and vertical lines to offspring. Carriers and deceased individuals get their conventional notation too. Because the symbols are consistent and correct, any geneticist or instructor can read your pedigree chart immediately, with none of the ambiguous markup that trips up hand-drawn versions.
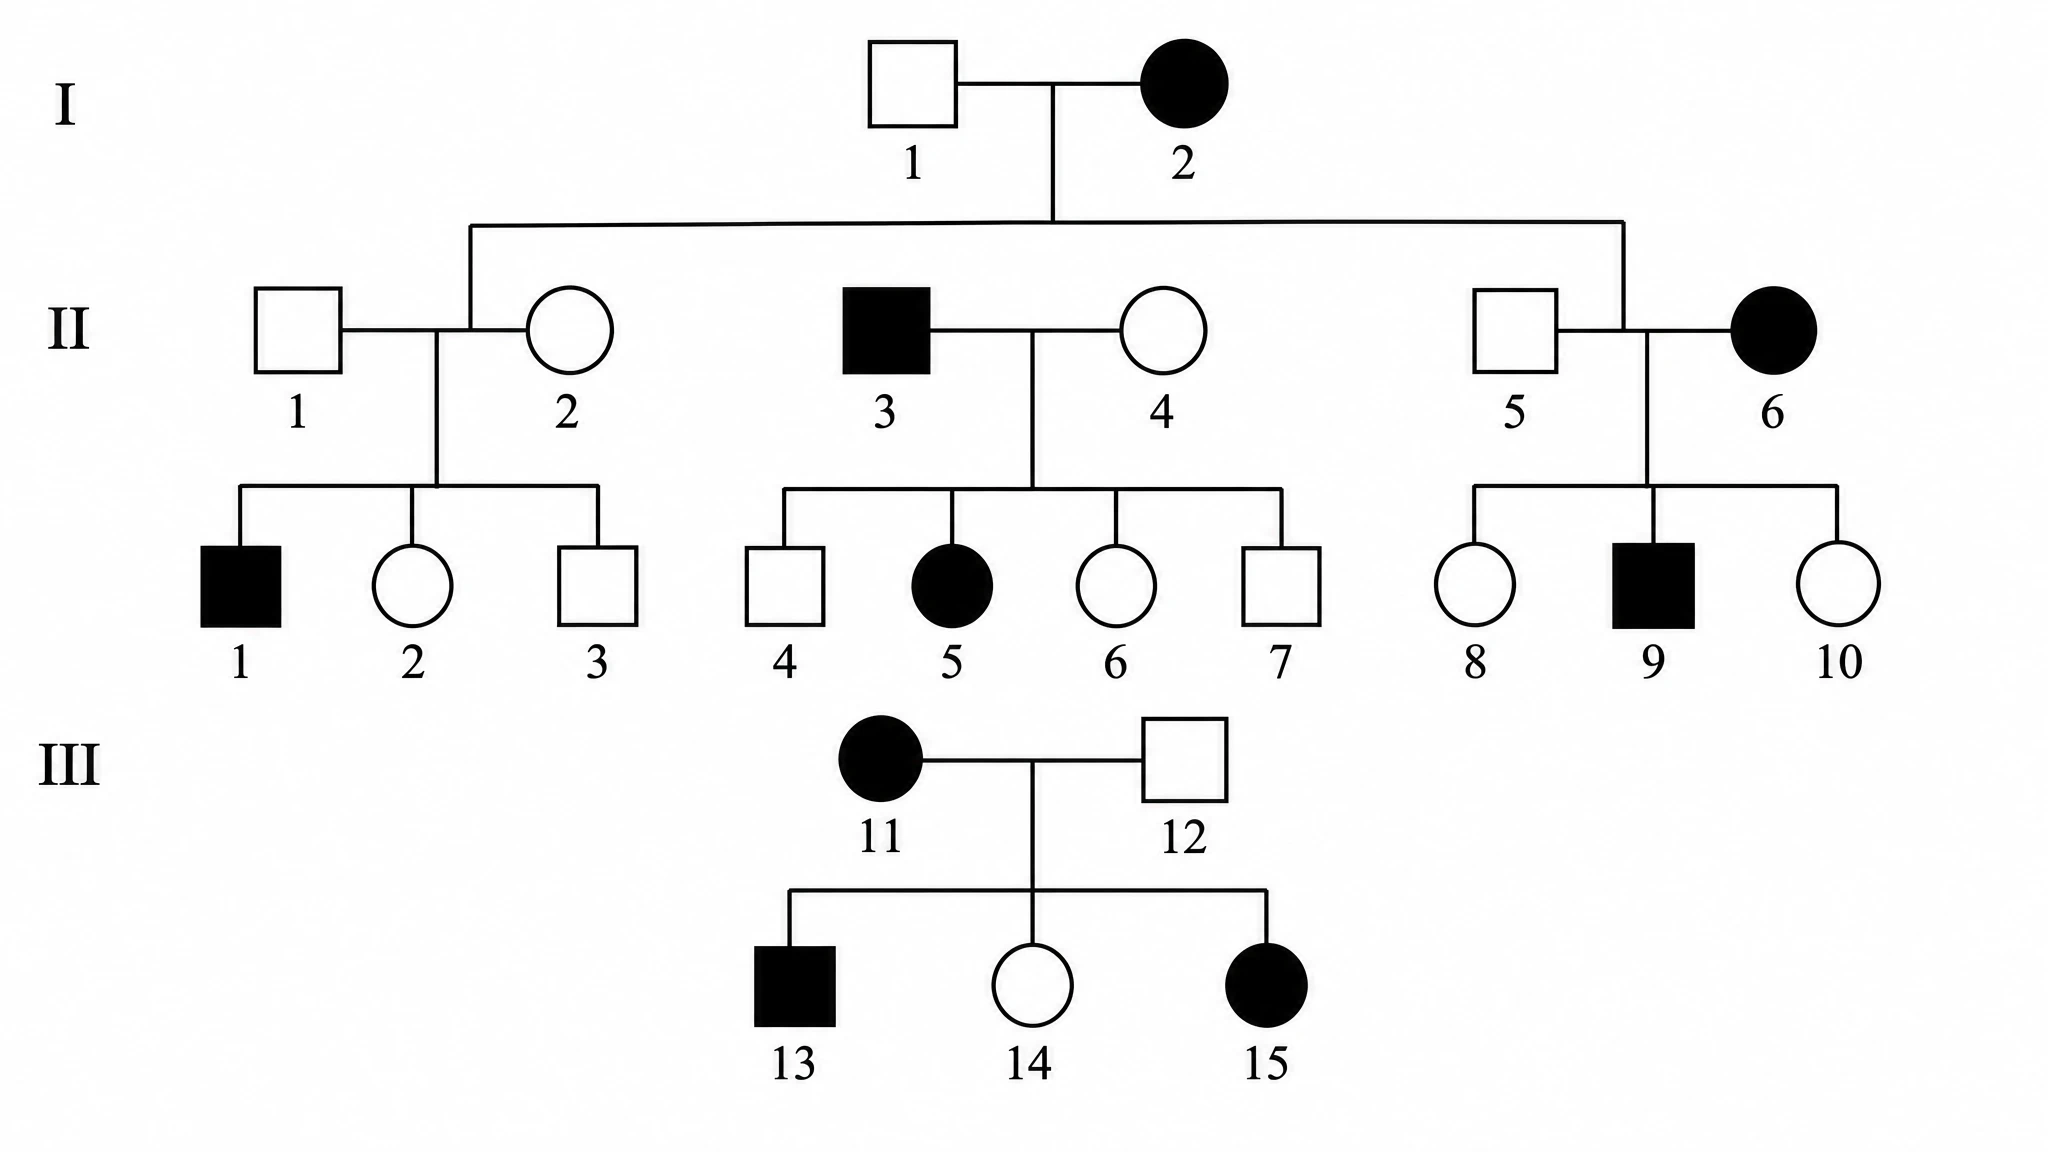
Multiple generations, mapped cleanly
A useful family tree in genetics often spans three or more generations, and aligning every square, circle, and connecting line by hand is slow and error-prone — which is exactly the work a dedicated pedigree maker takes off your hands. SciFig lays out each generation on its own row, keeps mating and sibling lines tidy, and positions affected individuals so the inheritance pattern stays visible. Add a generation or insert a new child and the layout rebalances automatically, keeping the diagram readable as the family grows.
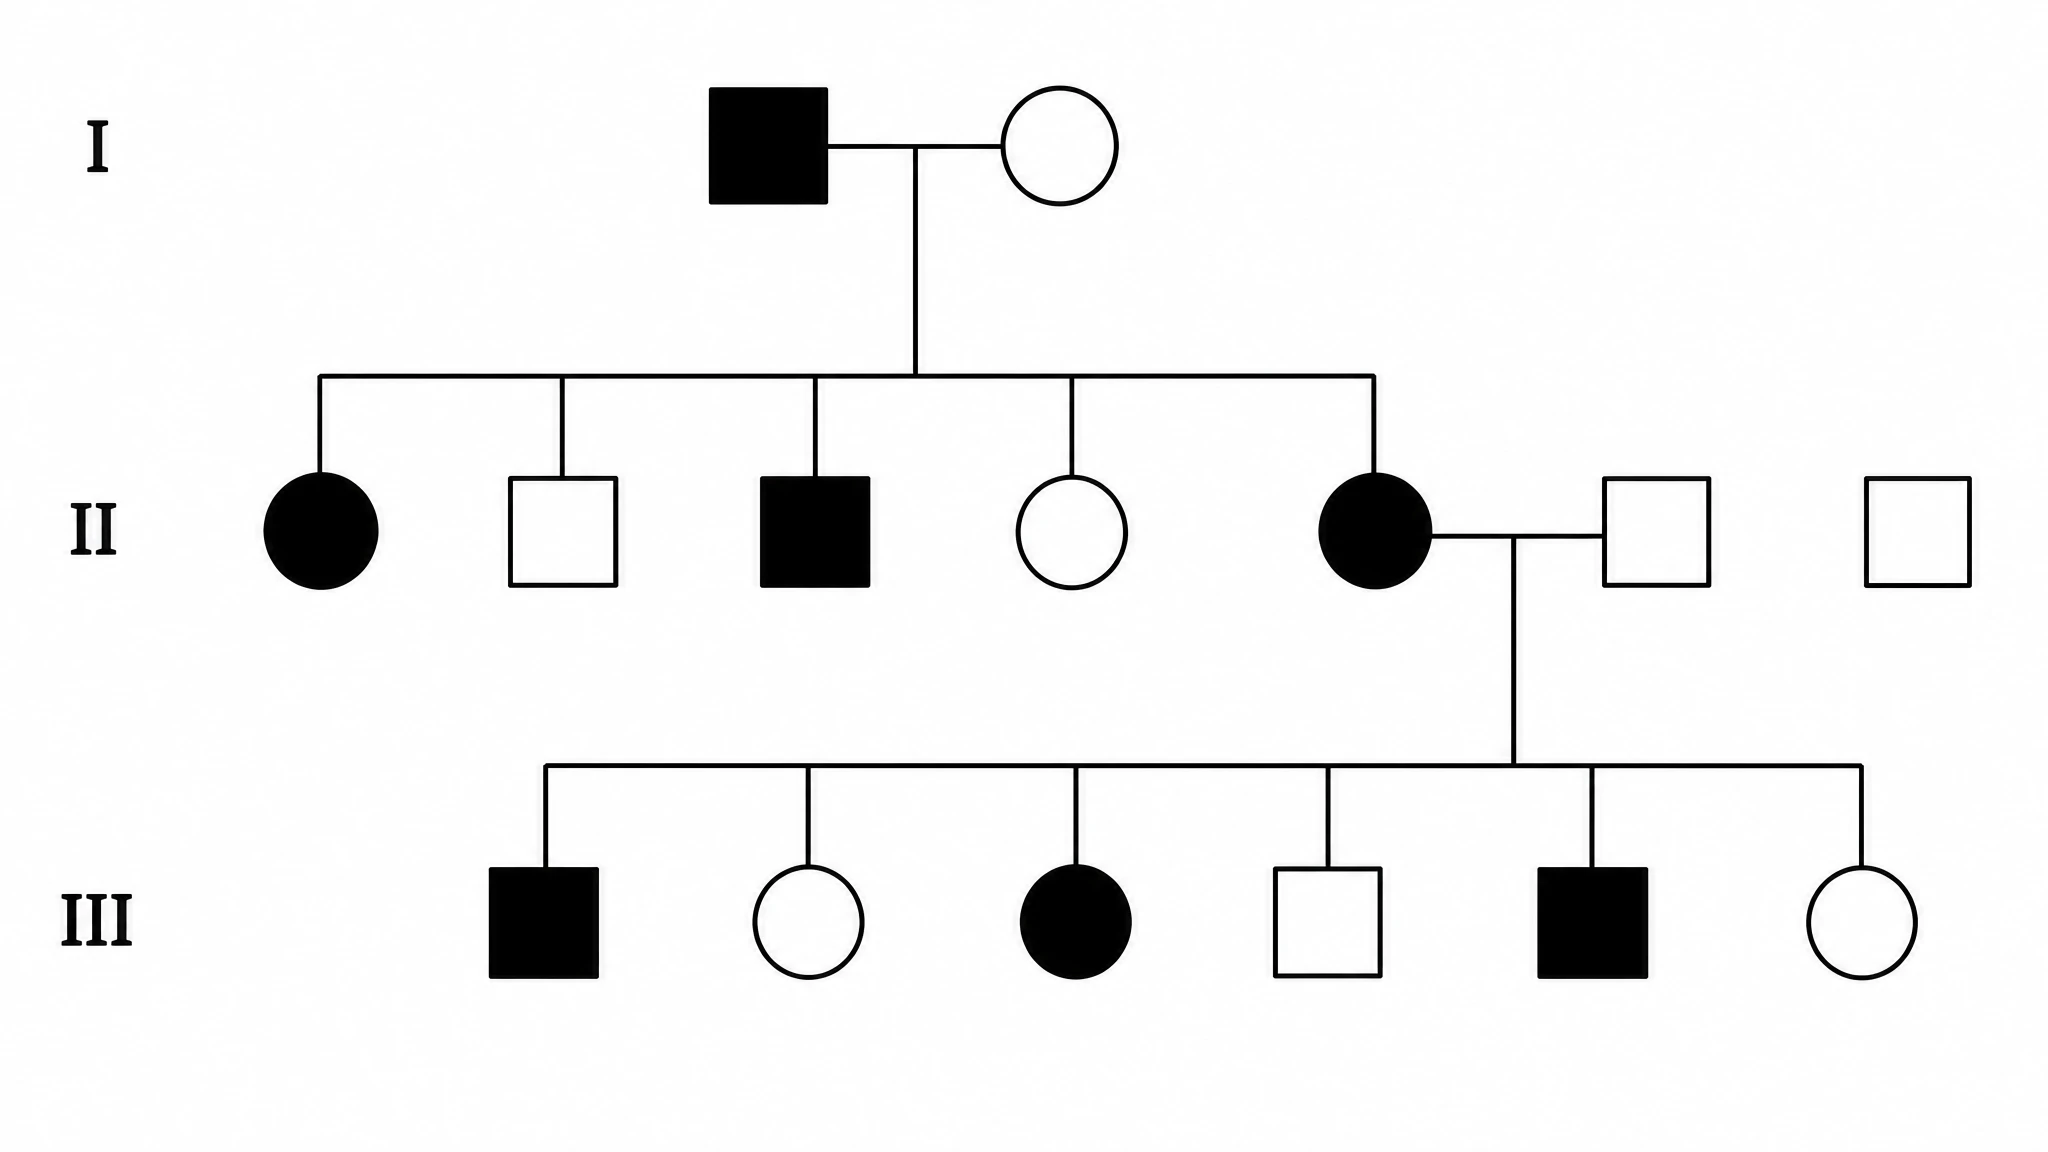
Inheritance patterns made obvious
Whether you are illustrating an autosomal dominant trait that appears in every generation or an X-linked recessive trait that mostly affects males, SciFig shades affected individuals so the pattern reads at a glance. Generate side-by-side examples of different inheritance patterns for a lecture, or a single pedigree chart for a genetic counseling case, and export each as a publication-ready figure for slides, papers, or worksheets. Used as a pedigree chart generator for coursework or clinical write-ups, it turns a described family history into a finished figure in one pass.
What is a pedigree chart?
A pedigree chart is a standardized diagram that maps how a trait is inherited across the generations of a family. It uses standard pedigree symbols — squares for males, circles for females, filled symbols for affected individuals, and lines for matings and offspring — so geneticists can trace how a trait runs in a family. SciFig builds one in seconds and keeps it editable: lay out the generations, mark who is affected, and the inheritance pattern becomes visible.
Why an accurate pedigree chart matters
- Standard pedigree symbols are required so any geneticist or counselor can read a chart without ambiguity
- A correctly drawn pedigree chart reveals whether a trait is autosomal dominant, recessive, or X-linked
- A genetics pedigree chart is a core figure in textbooks, exams, and peer-reviewed inheritance studies
- Genetic counselors build a family pedigree chart to estimate recurrence risk for future children
- Misplaced symbols or mating lines can flip the apparent inheritance pattern and mislead analysis
- An editable pedigree chart generator lets educators update affected individuals as a case study or curriculum evolves
Standard pedigree symbols in a pedigree chart
- Square — male individual in the family
- Circle — female individual in the family
- Filled symbol — affected individual expressing the trait
- Unfilled symbol — unaffected individual
- Horizontal line — mating line connecting two parents
- Vertical line — descent line dropping from parents to offspring
- Dot inside symbol — known unaffected carrier of the trait
Where pedigree charts are used
- High school and university genetics courses teaching inheritance patterns
- Genetic counseling sessions estimating disease risk for families
- Peer-reviewed papers and case reports on heritable disorders
- Biology worksheets and exam questions asking students to read a genetics pedigree chart for autosomal and X-linked traits
- Clinical genetics intake to document family history of a condition
- Lecture slides and open educational resources illustrating Mendelian inheritance
How to make a pedigree chart
Describe your pedigree chart
Tell SciFig what to draw in plain language — no design tools required.
Generate with SciFig
Get a clean, publication-ready figure that matches your description in seconds.
Edit & export
Vectorize it into editable SVG, relabel everything, and export for your paper, poster, or slides.
Pedigree Chart Maker — Frequently Asked Questions
Common questions about Pedigree Chart Maker.
More tools
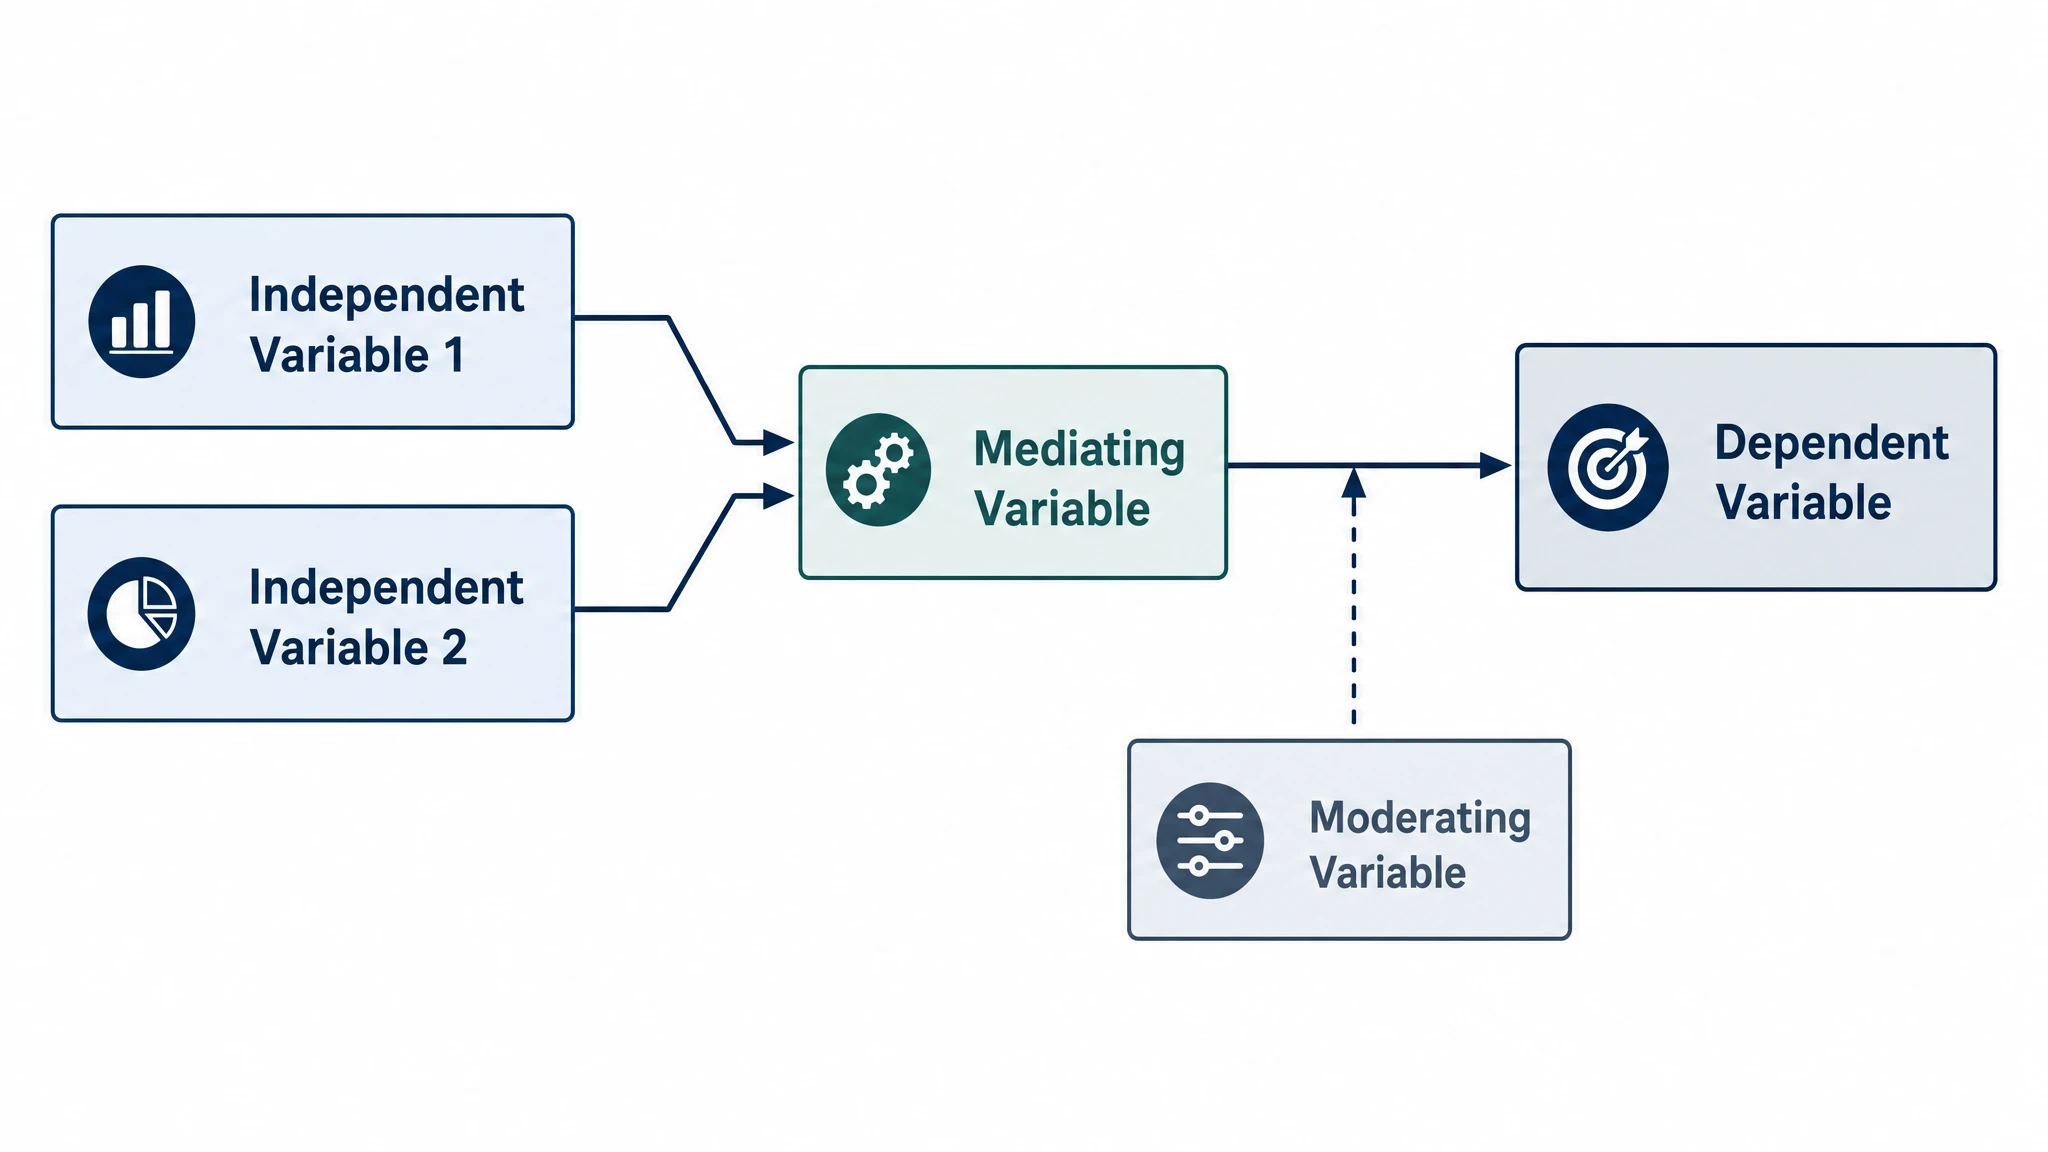
Conceptual Framework Generator
Create professional conceptual framework diagrams showing variable relationships, hypotheses, and theoretical models for your research.

Free Body Diagram Generator
Create accurate, publication-ready free body diagrams with labeled force vectors for weight, normal force, friction, and tension in seconds.
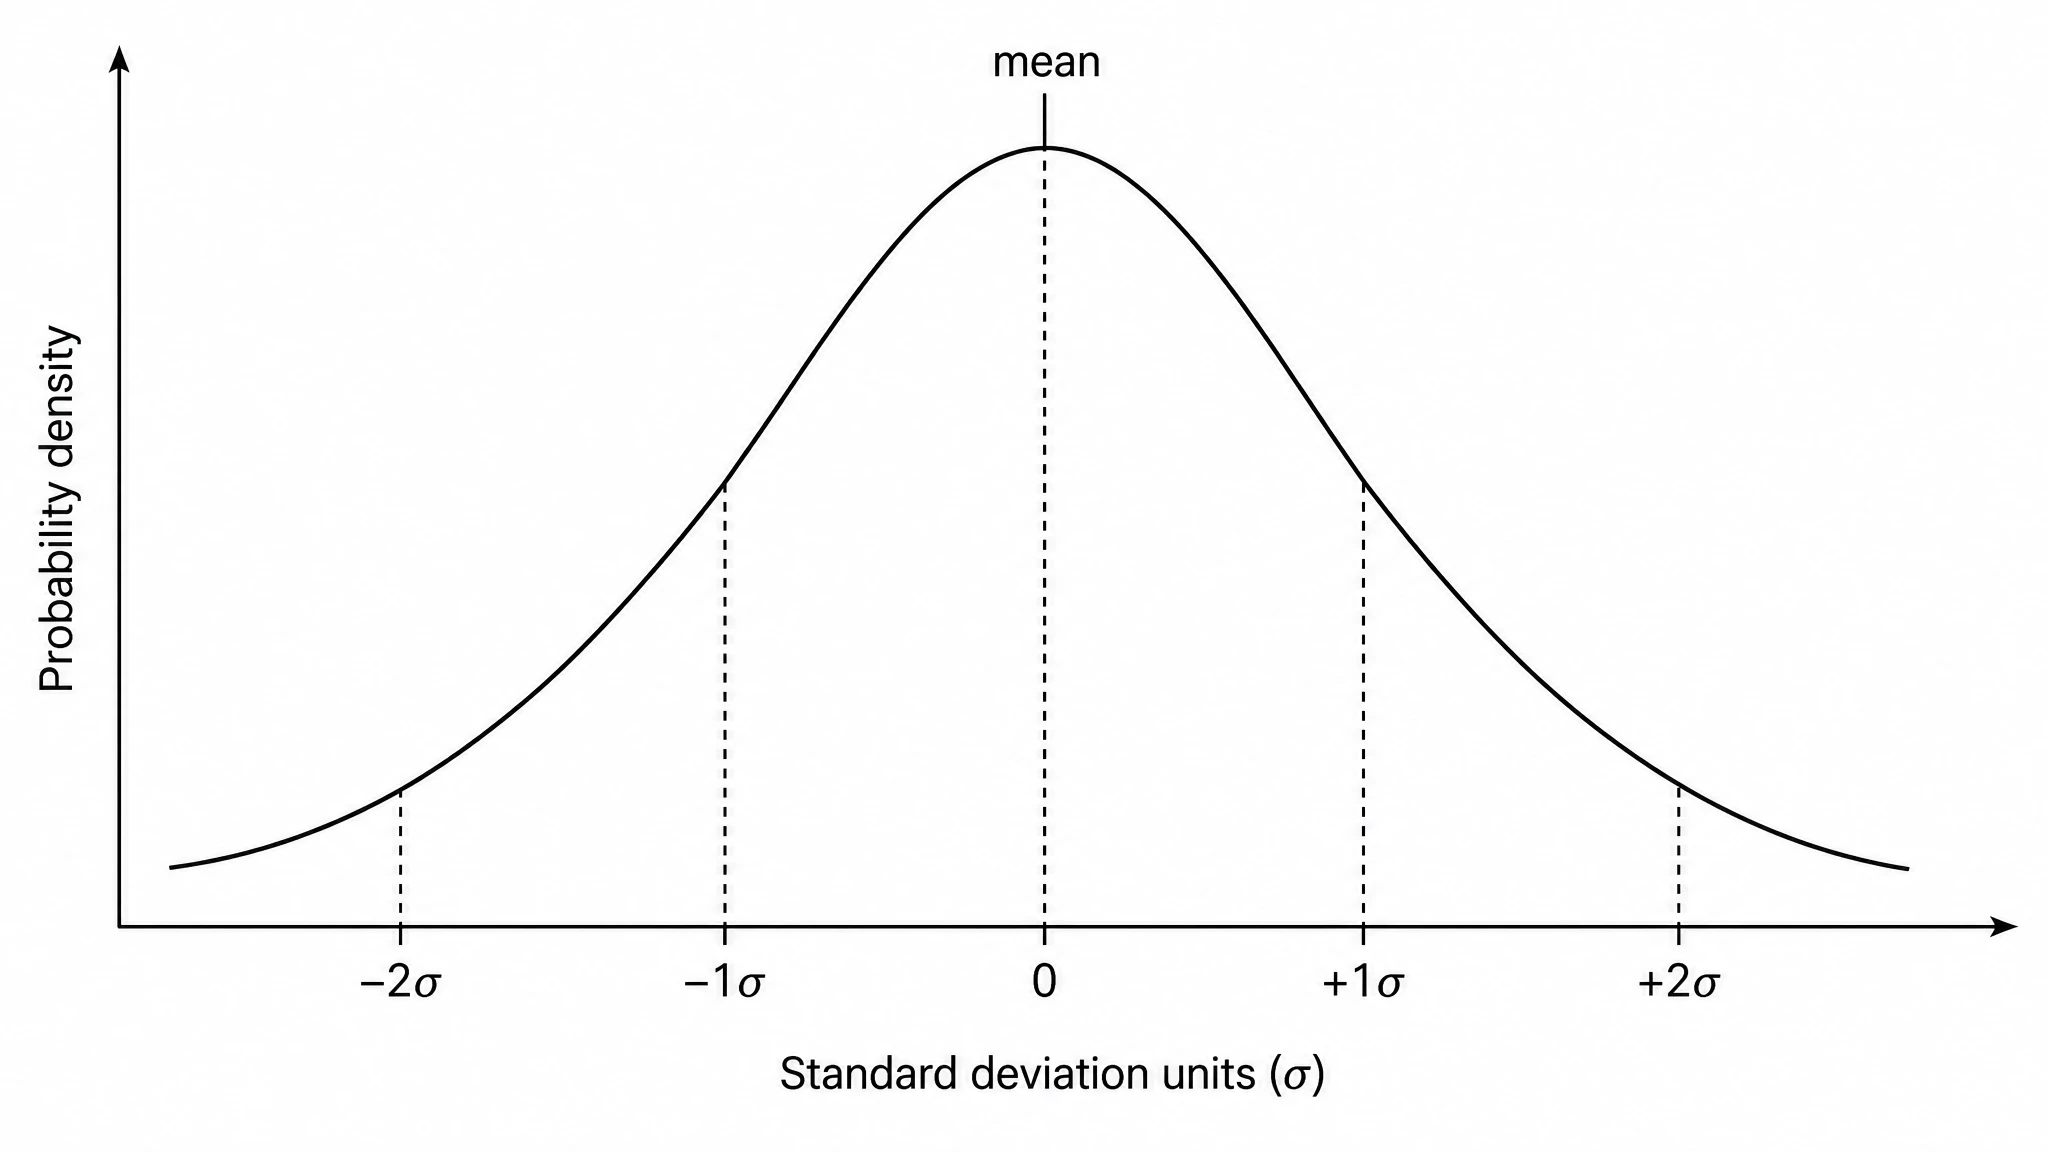
Bell Curve Generator
Generate a precise, fully labeled bell curve showing mean, standard deviations, and percentile regions — ready to export for your paper, thesis, or classroom.
Related links
Home
Turn text, sketches, references, PDFs, and photos into Scientific Figures
Text-to-Figure
Generate a figure from a plain-language description
Models
Default to GPT Image 2 for journal papers; switch to Nano Banana Pro for slides and posters; pick Nano Banana 2 for routine figure work
Tutorials
Seven short walkthroughs of the AI scientific figure generator
Blog
Tutorials, tool comparisons, and publication tips for researchers.
Inspiration
Explore publication-ready scientific figure examples, copy the prompts, and use them as starting points for your own work.

Ready to publish?
Make your own pedigree chart in minutes.
Start for freeFree to start · No credit card required · Built for researchers