The 10 best AI image generators for science in 2026, free and paid: the best AI for scientific diagrams and scientific figures, compared for researchers.
SciFig Team
SciFig editorial team
Quick answer: SciFig is the best AI for scientific image generation when you need editable figures and a free start.
Which AI Image Generator Should You Choose?
Pick by the figure you need to make, then read the full entry below.
Choose SciFig if you want one AI scientific figure generator for paper, thesis and presentation figures: mechanism illustrations, data charts built from your own data, and flowcharts, all editable and exportable as SVG. Free to start, no card required: 3 figures on day one and up to about 44 in your first month, free editing, saving and export, and a free publication license PDF that documents your publication and commercial use rights.
Choose BioRender AI if your figure fits a standard icon catalog and your lab already works in BioRender.
Choose GPT Image 2 or Nano Banana Pro if you want a strong general model and will check every label, count and arrow yourself.
Choose Midjourney if you need cover art or a conceptual hero image rather than a mechanism diagram.
Choose Stable Diffusion or PaperBanana if your team writes code and wants to self-host a model or run a research pipeline.
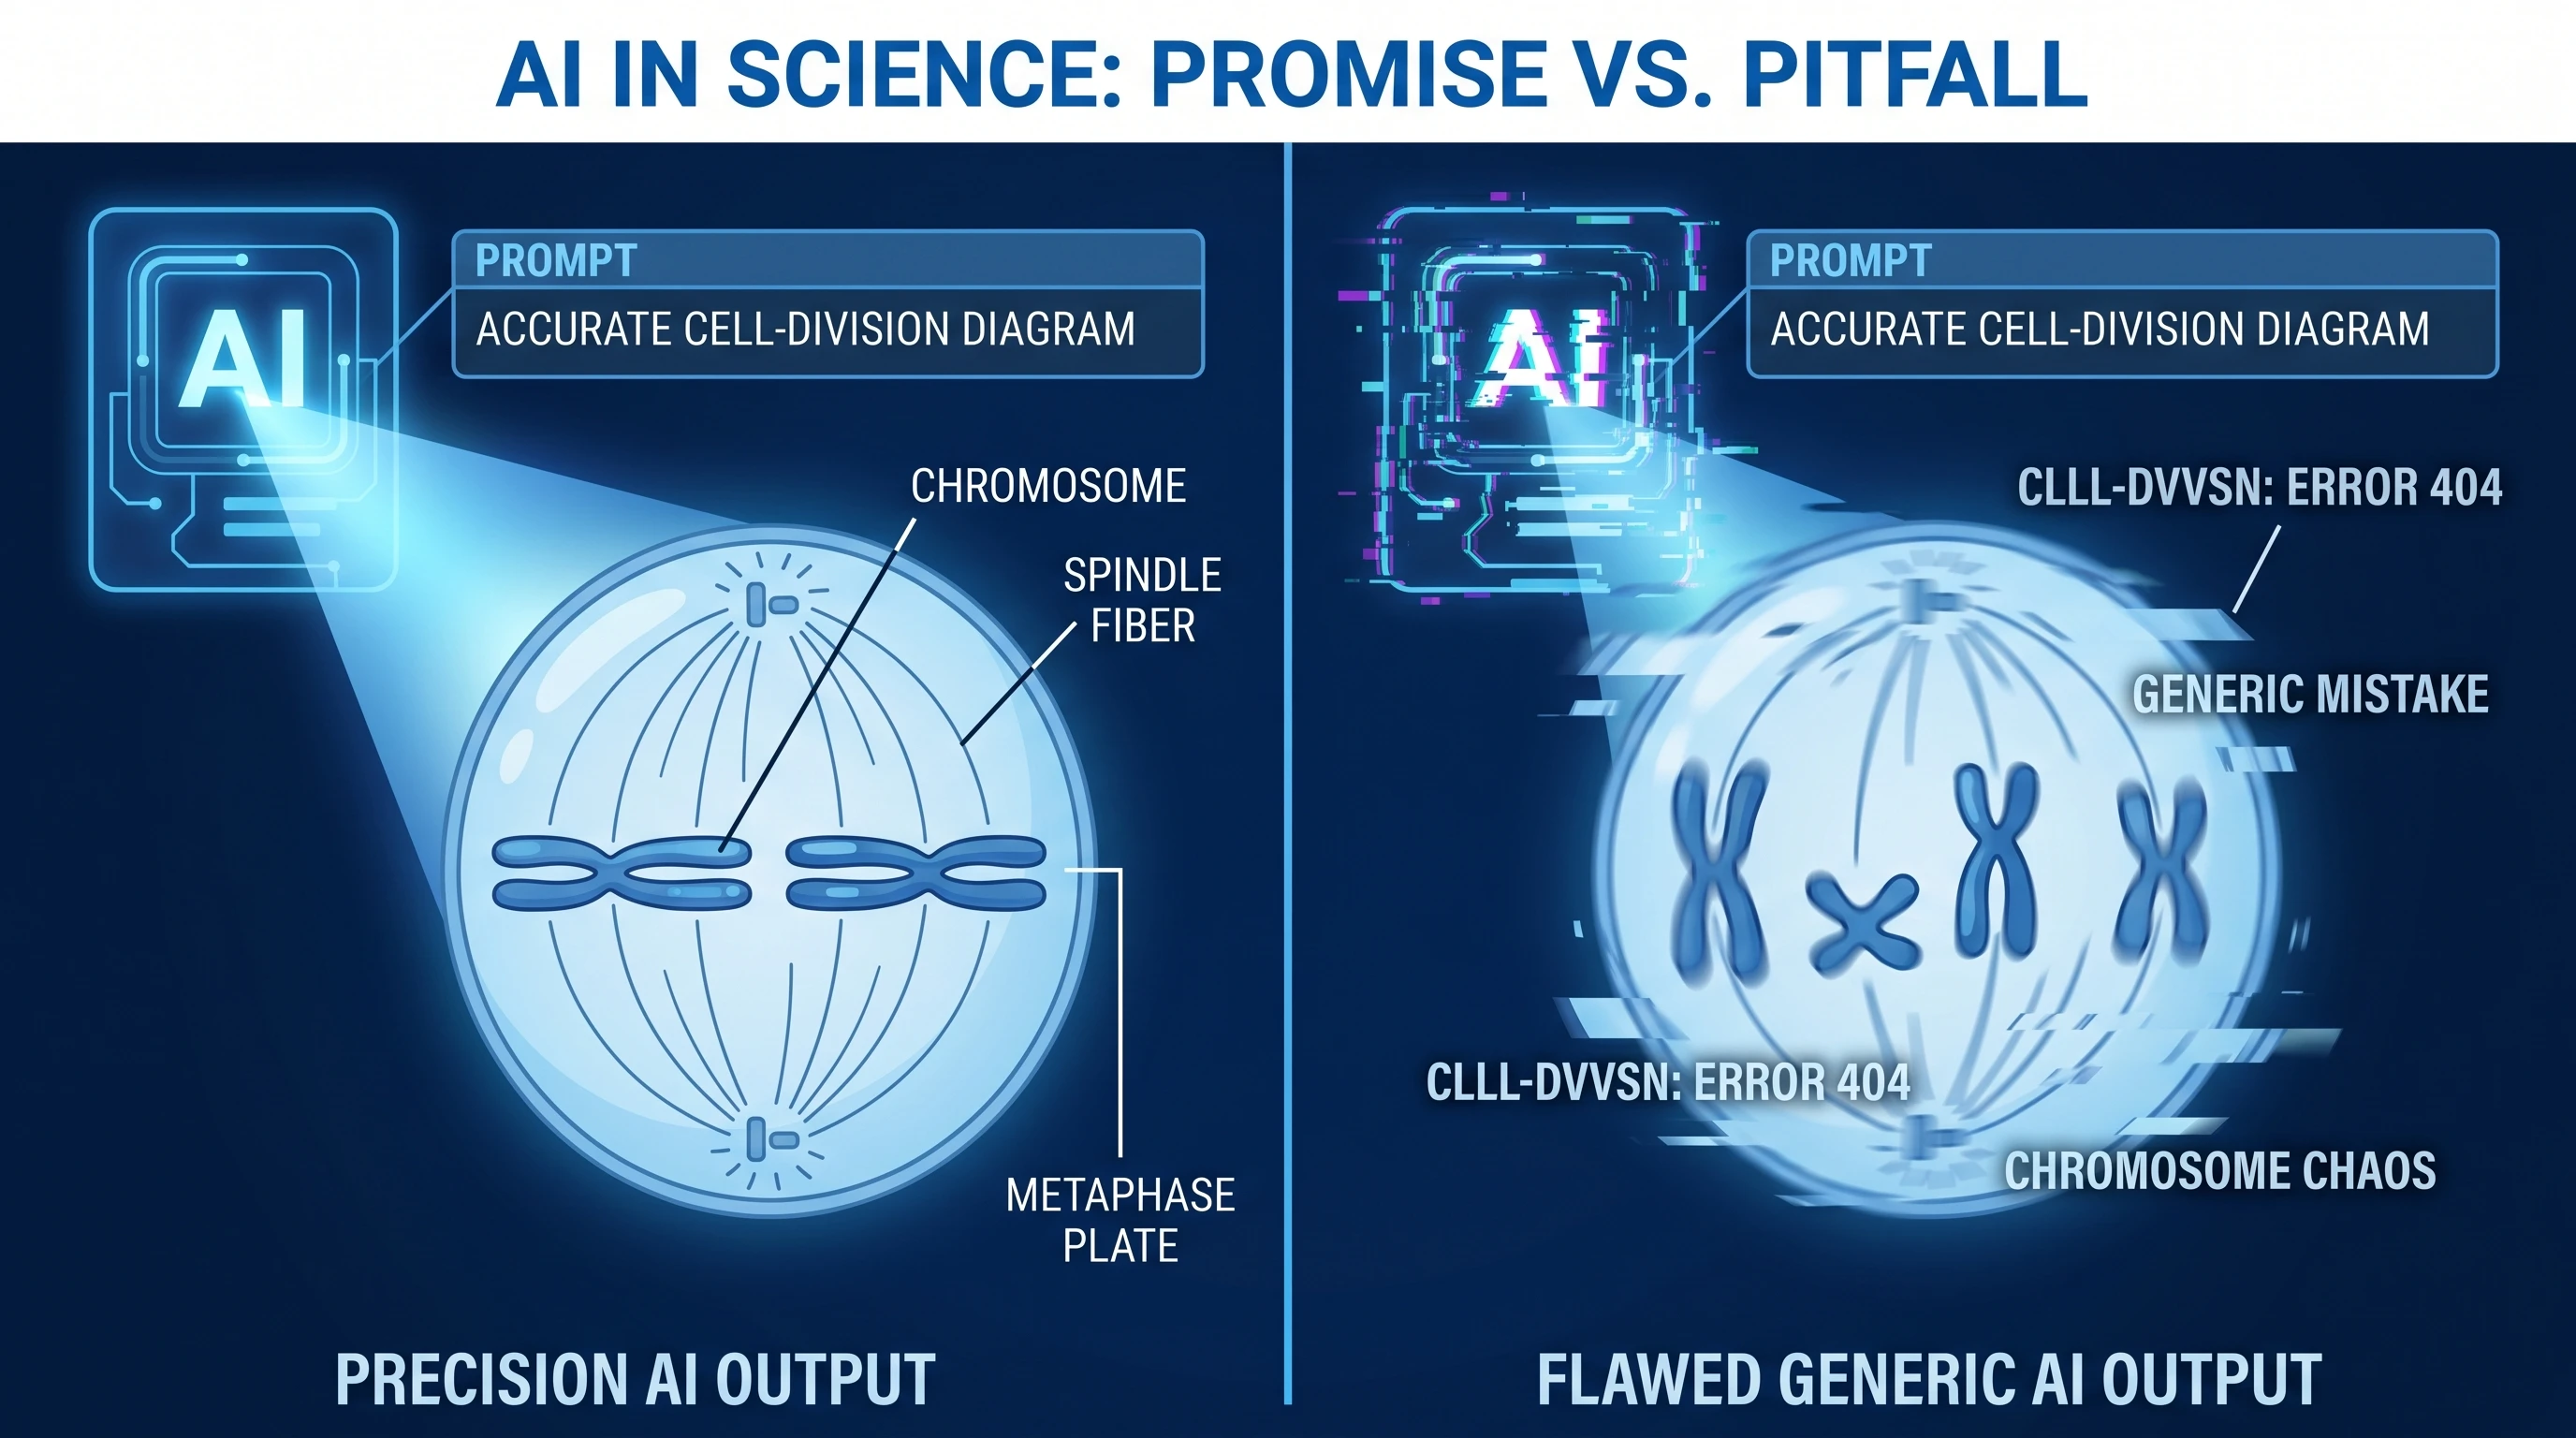
Type "a diagram of mitosis" into a general AI image generator and you'll get something that looks scientific and is quietly wrong — six chromosomes that should be four, spindle fibers attached to the wrong place, a label that reads "metaphse." That science AI image is convincing enough to fool a glance and wrong enough to get desk-rejected. That gap — between looks like science and is correct science — is the whole story of AI scientific figure generation for research.
Whether you need the best AI for research figures, a research paper image generator, a good AI to generate biological images, or a tool that creates figures and flow charts for academic papers and presentations, the choice comes down to the same few questions. This guide ranks the 10 best AI image generators for science in 2026, separating the science-specific tools from the general-purpose ones and comparing them on what actually matters for scientific figures: accuracy, discipline fit, cost, free options, and whether a journal will accept the output. It also covers the non-AI programs scientists still use to draw figures. If you've already decided you want an AI tool and just need help picking one for a specific task, jump to our AI scientific figure maker selection guide; this article is the broader survey of what's out there and what each one can really do.
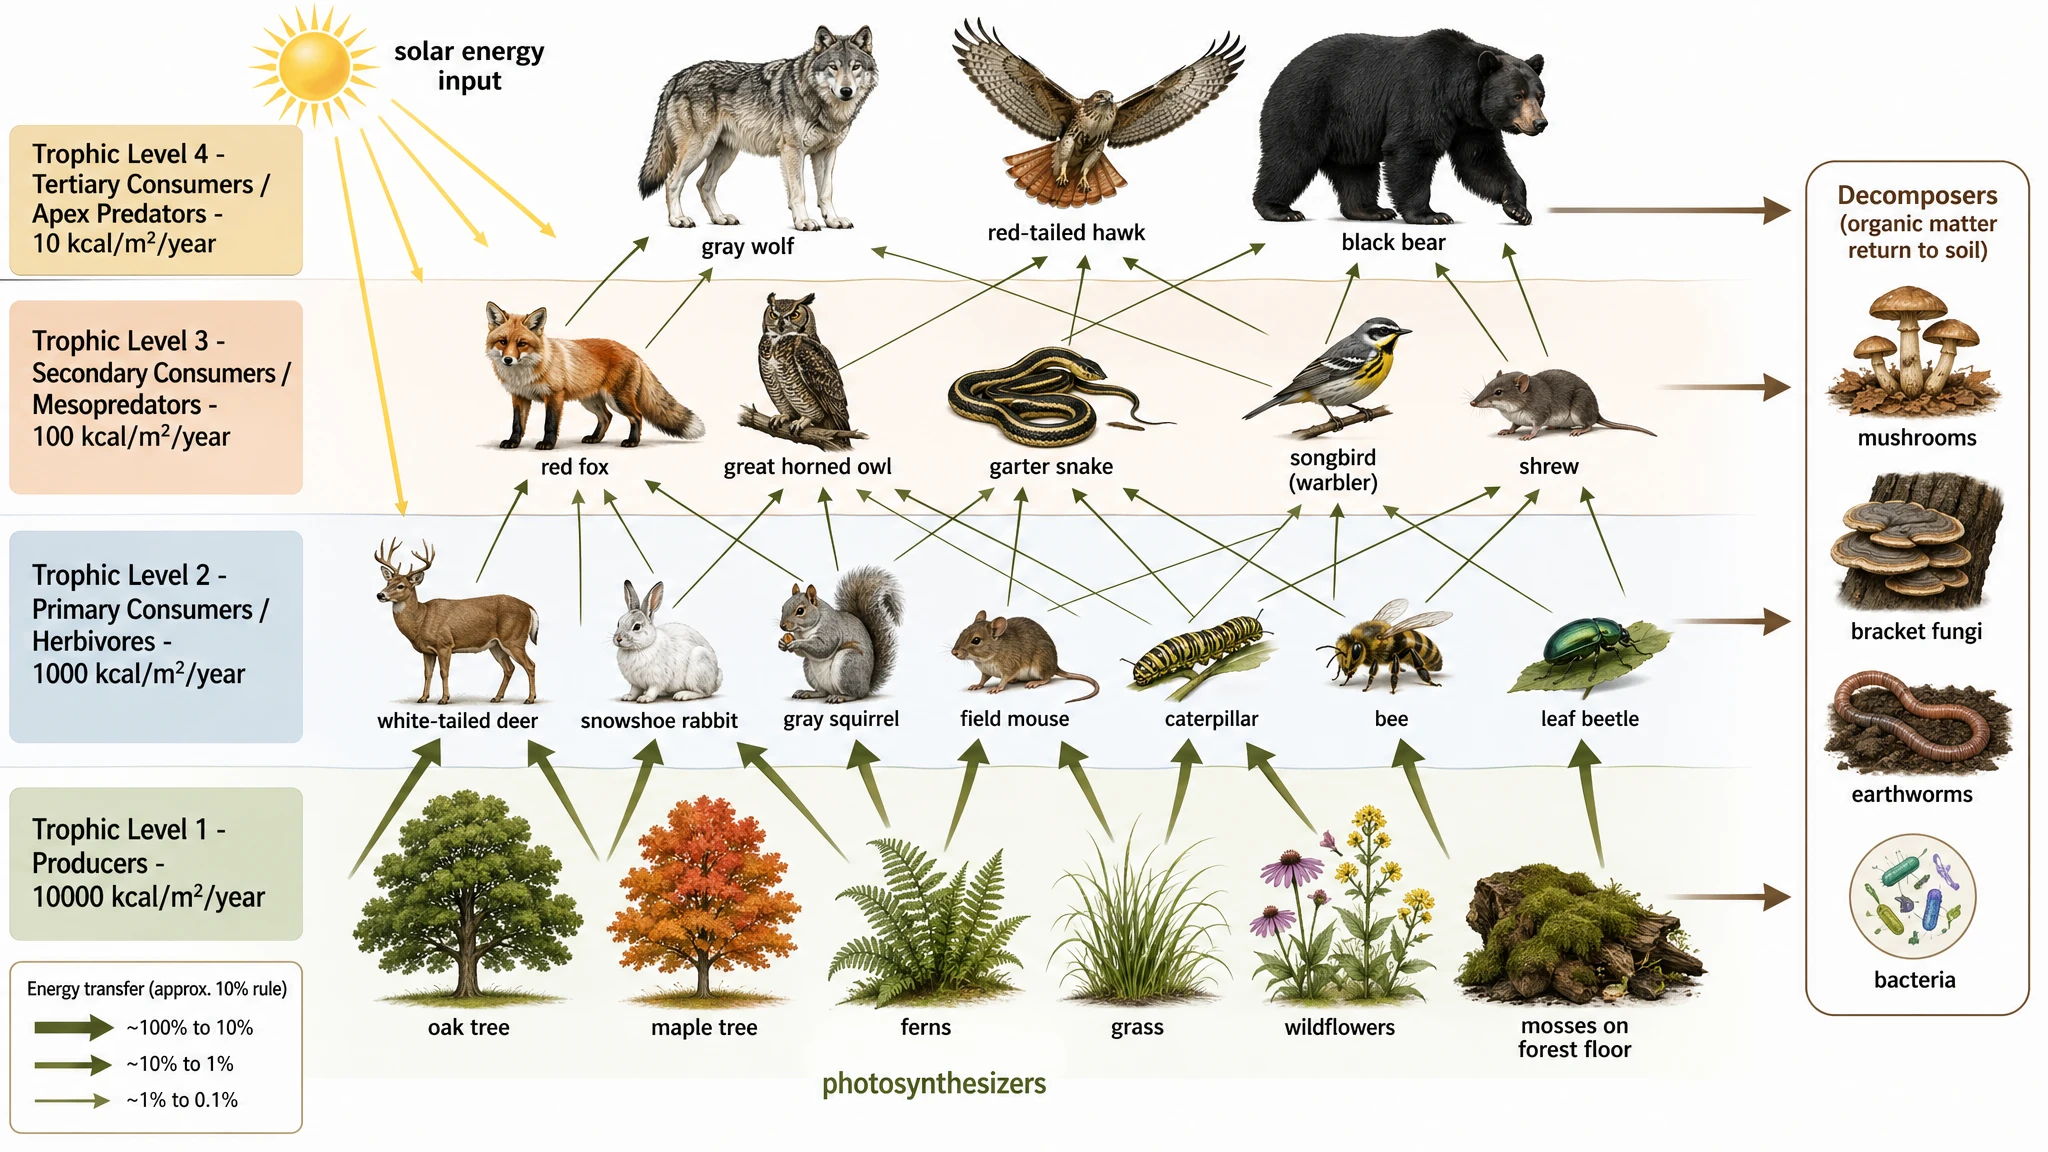
A scientific AI image generator turning a text prompt into an accurate cell-division diagram, contrasted with a flawed generic output (Figure generated with SciFig)
General AI Image Gen vs Science-Specific Tools: The Core Difference
The single most important distinction is whether a tool was trained for plausibility or for correctness. General image generators (Midjourney, DALL·E, Stable Diffusion) optimize for images that look good to a human — which for art is exactly right and for science is a trap, because a scientific figure that looks plausible but encodes a wrong mechanism is worse than no figure at all. Science-specific tools are tuned on scientific literature so the structures, counts, and directions match reality.
In practice this means general tools excel at concept art and illustration — a striking cover image, an abstract representation of a dataset — while science-specific tools earn their place on mechanism diagrams, pathways, and labeled structures where a reviewer will check the details. Knowing which job you have decides which half of this list you should be reading.
Why General AI Tools Fail at Science
The failures are systematic, not random. Counting errors: general models routinely produce the wrong number of discrete elements — chromosomes, scFv domains, ITAM motifs, transmembrane helices — because they reproduce visual texture rather than enforce a count. Directionality errors: pathways come out reversed (STAT entering the nucleus before dimerization, a sgRNA drawn 3′→5′), because the model has no concept of the canonical sequence. Anatomical errors: organelles mis-sized (mitochondria larger than the nucleus), or a chloroplast dropped into an animal cell that should never contain one. And text errors: garbled or misspelled labels, since most image models don't render text reliably.
None of these is fixable by a better prompt alone — they're a consequence of training objective. The two ways to deal with them are to use a tool fine-tuned on scientific data, or to treat a general tool's output as a rough draft you'll fully rebuild. Both are valid; the list below tells you which tool fits which strategy.
10 Best AI Image Generators for Science in 2026
Judged on fit for research figures specifically — not general image quality. The list covers three kinds of tool: science-specific platforms (BioRender AI, SciFig, illustrae), general image models (Nano Banana Pro, GPT Image 2, Midjourney, DALL·E, Stable Diffusion, Adobe Firefly) and research pipelines (PaperBanana, AutoFigure). If you want the best scientific image generator AI for a paper, thesis, poster or grant figure, the science-specific platforms are where to start.
1. BioRender AI — Best for icon-assembly with AI assist
BioRender layers AI tools onto its curated icon library. The free Basic account includes Generate a Custom Figure for flat figures only; editable AI-generated figures and the Leo assistant need the AI add-on, from $4/month billed yearly or $5 monthly, about 5 custom figures a month. Best for: standard scientific figures that fit the existing catalog, and labs already on BioRender.
2. SciFig — Best for editable scientific figures with a Free start
Best for: researchers who want one scientific figure generator AI workspace for paper, thesis and presentation figures: mechanism illustrations, data charts and flowcharts, without a credit card to get started.
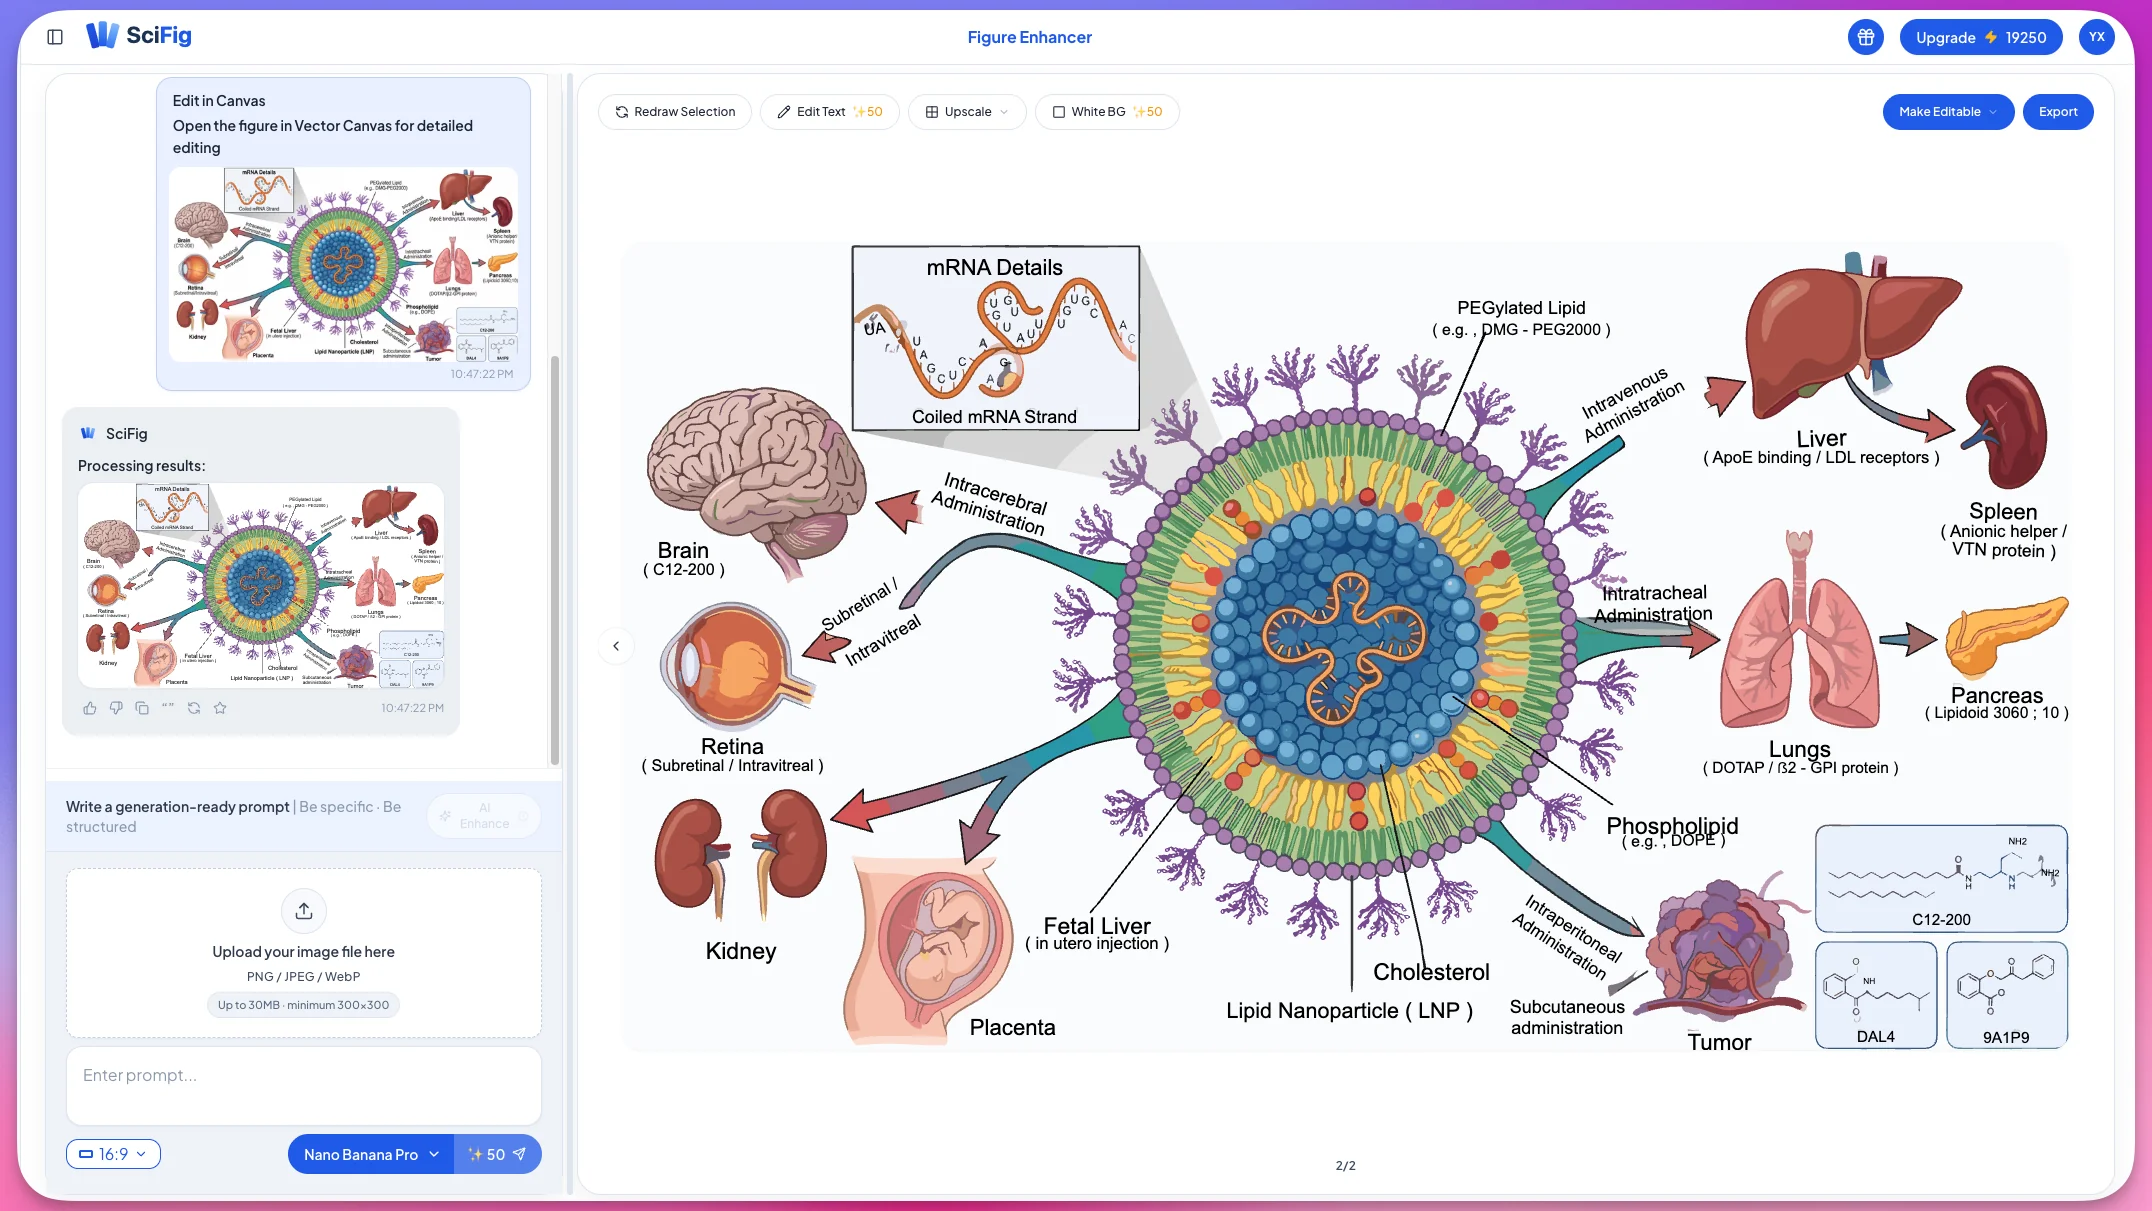
What it does:SciFig (scifig.ai) is an all-in-one scientific figure platform with three workbenches. SciFig AI Illustration (AI scientific illustration) creates mechanism and concept images from descriptions, sketches, reference images or PDFs, and can vectorize them into editable SVG. SciFig DataChart (data-driven charts) generates charts accurately from your CSV or Excel table, with statistics — start from the AI chart generator. SciFig FlowChart (flowcharts and diagrams) builds editable workflows and model architectures as native SVG — start from the text-to-diagram generator. Every label, colour, shape and layout stays editable on the canvas, which exports SVG, PNG, JPG and PPTX.
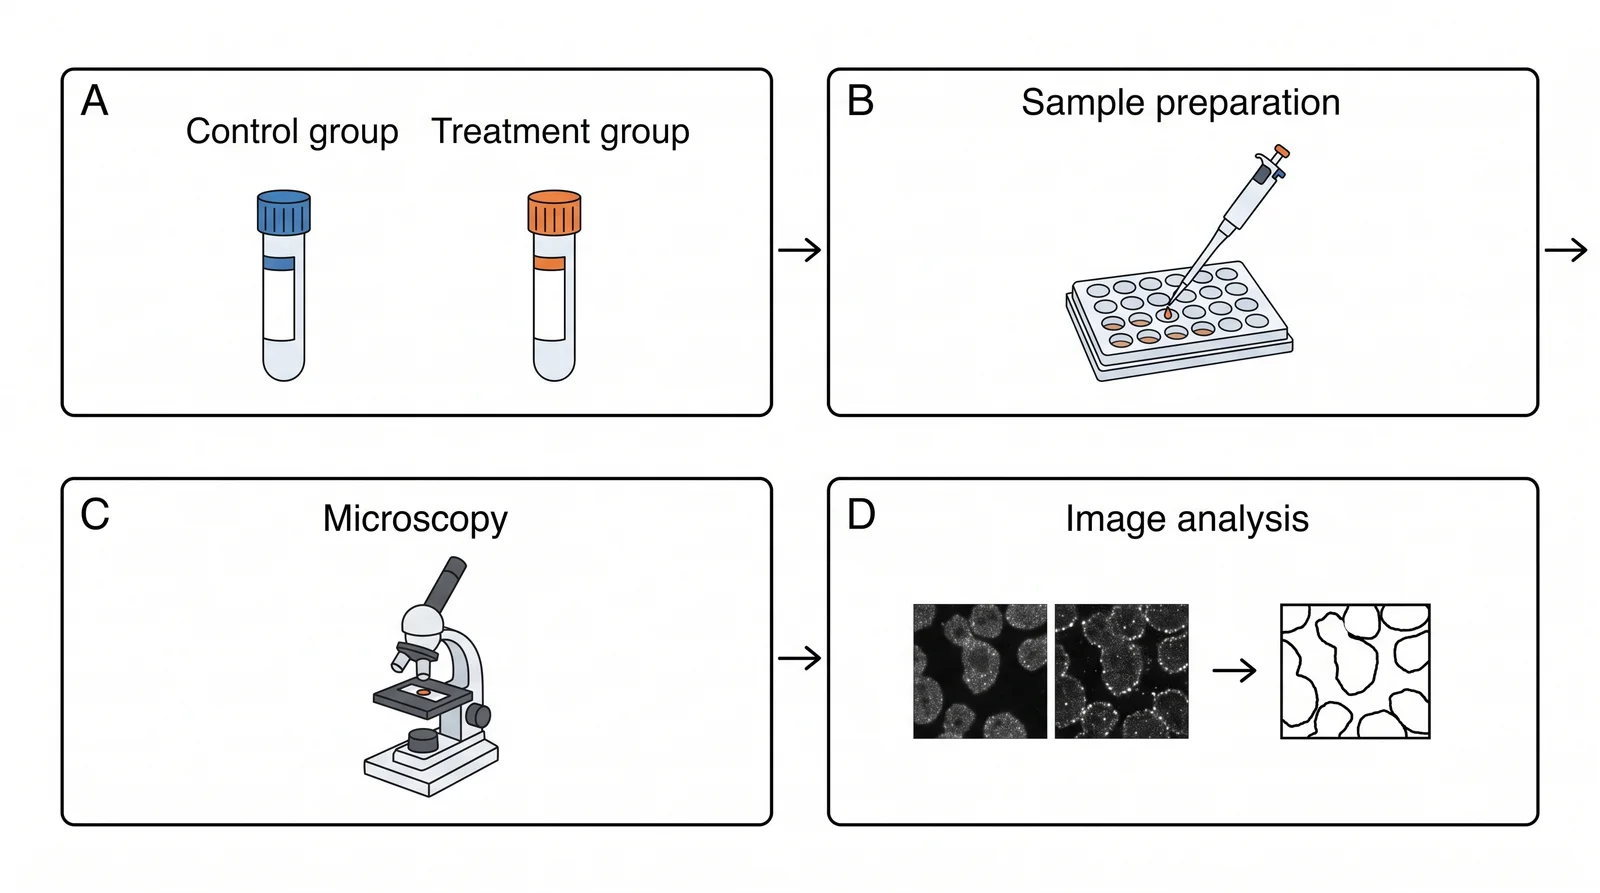
SciFig workspace generating a scientific figure from a text description
Why it shines on free use: start free, no card required: 150 credits on day one (3 figures), daily check-in credits that grow with your streak (up to 150 a day) — up to about 44 figures in your first month. Invite a friend and you both get 200 more credits. Editing, saving and exporting are free, failed tasks refund their credits automatically, and you can download a license PDF for publication and commercial use for free.
Editing and export: every label, arrow and component can be changed directly on the canvas and exported as SVG or PPTX. SciFig AI Illustration images convert to editable SVG so you can move individual paths and labels, and SciFig FlowChart diagrams are native SVG from the start.
3. Nano Banana Pro — Strong general model with science strengths
Nano Banana Pro is a capable general image model that performs notably well on scientific prompts. We tested it head-to-head against GPT Image 2 across ten disciplines — rather than repeat that here, see the disciplines-tested deep dive. Best for: users who want a strong general model and will review accuracy themselves.
Bare model vs pipeline: used on its own, Nano Banana Pro is a general model — you write the prompt and check the result. Research pipelines such as PaperBanana (entry 8) use Nano Banana Pro together with Gemini 3 Pro inside a multi-agent workflow that plans, renders and critiques each figure. Results reported for such a pipeline describe the whole pipeline, not the bare model you get when you prompt Nano Banana Pro directly.
An update to Nano Banana 2, Nano Banana 2.1 adds text and layout updates relevant to scientific labels and multi-panel illustrations.
4. GPT Image 2 — Best general model for text-in-image
GPT Image 2 is the strongest general model for rendering legible text inside images, a common weak spot elsewhere. For the full GPT-vs-Nano-Banana decision, see which one wins for scientific figures. Best for: figures that need readable embedded labels and don't hinge on rare molecular detail.
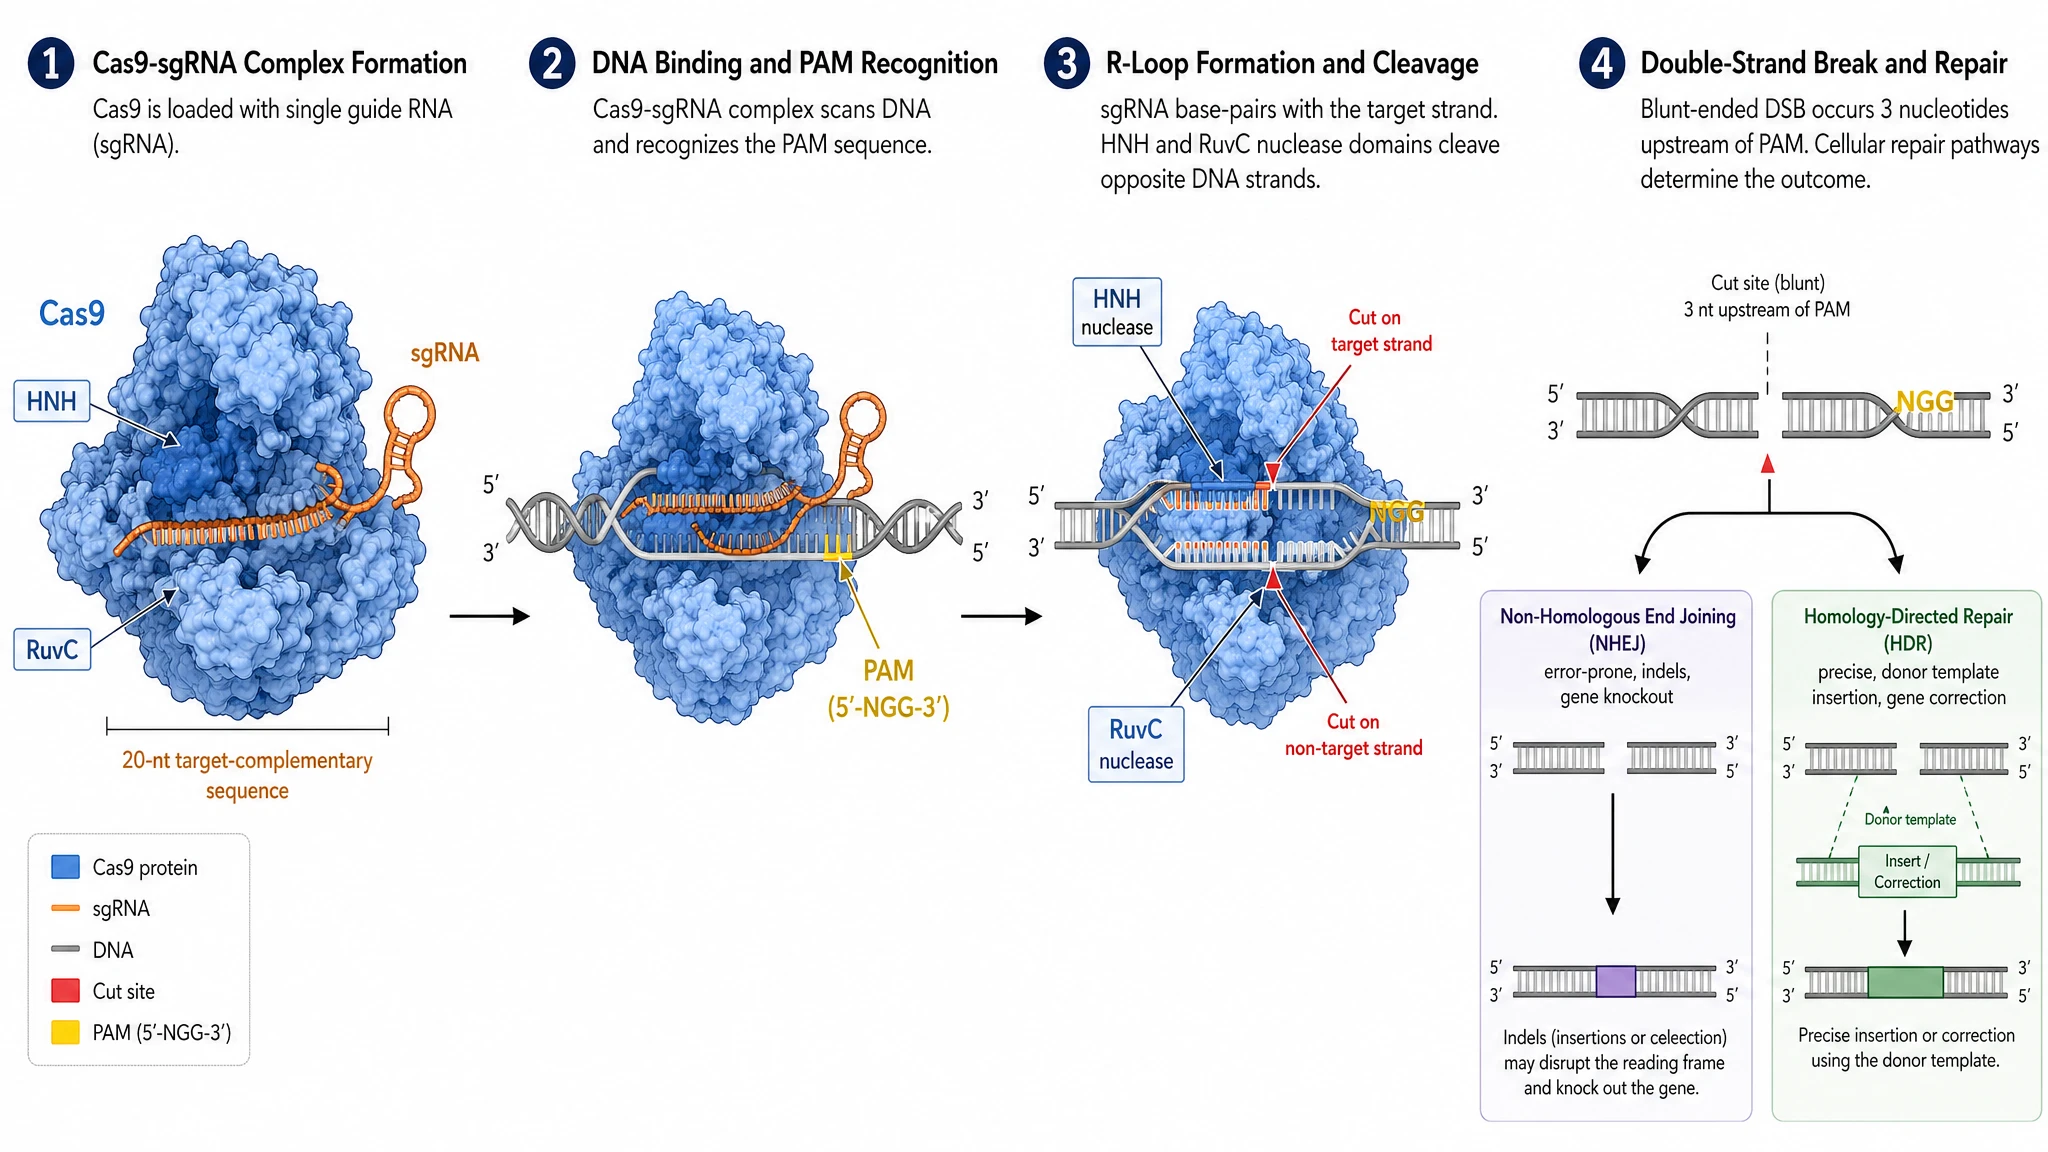
The following GPT Image 2 example comes from our existing cross-discipline comparison and depicts CRISPR-Cas9 in four steps, showing structures, direction, and text labels. For the full prompt and the other model's output, see the cross-discipline test comparison.
Four-step CRISPR-Cas9 diagram generated by GPT Image 2, labeling Cas9, sgRNA, PAM, the cutting site, and repair pathways
5. Midjourney — Best for cover art and concept images
Midjourney produces the most striking artistic images on this list. For a journal cover competition or a conceptual hero image, it's hard to beat. Best for: cover art, abstract concept images — not mechanism diagrams.
6. DALL·E — Best for quick conceptual visuals
DALL·E is fast, accessible, and good at general conceptual imagery. Best for: teaching slides and conceptual visuals where exact scientific detail isn't load-bearing.
7. Stable Diffusion — Best for self-hosting and custom fine-tuning
Stable Diffusion is open and locally runnable, so a lab with ML skills can fine-tune it on its own domain. Best for: technical teams that want full control and can invest in fine-tuning.
8. PaperBanana — Best for teams who want to run a research pipeline
PaperBanana began as a research framework, not a single hosted product. The paper PaperBanana: Automating Academic Illustration for AI Scientists (arXiv, January 2026; later published at ICML 2026, with a Google Research publication page) describes a multi-agent pipeline — Retriever, Planner, Stylist, Visualizer and Critic — that turns a method description into academic illustrations such as methodology diagrams. The official open-source implementation is now published as PaperVizAgent (formerly PaperBanana); its README describes it as a demo rather than a production service and notes it is not an officially supported Google product. Running it means installing the code and configuring your own model API keys.
Several commercial websites also use the PaperBanana name. Treat each as a separate product and check who operates it before relying on its terms; the research framework and a same-name website are not the same thing. Best for: code-savvy teams who want to run or study a research pipeline for method figures.
PaperBanana is not the only research pipeline. AutoFigure and its successor AutoFigure-Edit turn a paper's method section into an editable SVG figure; AutoFigure-Edit is open source (MIT), runs self-hosted with your own model API keys, and can follow the style of a reference image. Use them to study or reproduce a method-to-figure pipeline; for everyday figures without setup, a hosted tool is simpler.
9. illustrae — Best for stylized graphical abstracts
illustrae is an AI scientific illustration platform that turns text prompts, sketches or images into scientific figures, graphical abstracts and academic posters, with a stylized, polished look. Best for: graphical abstracts and posters where a polished look leads.
10. Adobe Firefly — Best for designers in the Adobe ecosystem
Firefly integrates with Adobe tools and trains on licensed data, which helps with commercial-rights certainty. Best for: designers already in Illustrator/Photoshop who want generative fills with clean licensing.
The ten tools at a glance — judged on fit for scientific figures, not general image quality.
Tool
Type
Accuracy fit
Best for
Vector export
Free option
SciFig
All-in-one AI figure platform: SciFig AI Illustration, SciFig DataChart, SciFig FlowChart
Editable: fix any label, arrow or component in place; SciFig DataChart plots your exact data
Mechanisms, illustrations, charts and graphs, flowcharts
Editable SVG (vectorization; SciFig FlowChart is native SVG)
Yes: no card, 3 figures on day one, up to ~44 in your first month, free editing, export and publication license PDF
BioRender AI
Icon library + AI
High (vetted icons)
Catalog-standard figures
PDF on paid plans; no SVG
Free Basic: up to 3 figures, watermarked, no publication use
Nano Banana Pro
General (science-strong)
Medium-high
Strong general use, reviewed
Via vectorize
Plan-dependent
GPT Image 2
General
Medium (best at text)
Figures with embedded labels
Via vectorize
Plan-dependent
Midjourney
General (artistic)
Low for mechanisms
Cover art, concept images
No
Plan-dependent
DALL·E
General
Low for mechanisms
Teaching / concept visuals
No
Plan-dependent
Stable Diffusion
General (self-host)
Variable (fine-tunable)
Custom fine-tuning
No
Open model, self-hosted
PaperBanana
Research framework (paper + open-source code)
Pipeline-dependent
Method figures, self-run
Varies
Open-source code, your own API keys
illustrae
AI scientific illustration
Medium
Graphical abstracts, posters
Varies
Paid plans only, no free plan
Adobe Firefly
General (licensed)
Low for mechanisms
Adobe ecosystem, clean licensing
Yes (Illustrator)
Plan-dependent
See AI Scientific Figure Generation in Action
Watch how researchers create publication-ready scientific figures from text descriptions.
Compare Nano Banana 2.1 and GPT Image 2.5 for scientific figures, from labels and layouts to focused edits. The comparison guide includes a short prompt structure and selected scientific image examples; the Flare/Sunburst comparison helps you choose a version.
Beyond AI Generators: What Program to Use for Scientific Drawing
Many scientific figures are still drawn, plotted or assembled in traditional software. Pick by figure type:
Figure type
Program
What it's for
Vector illustration and final figure assembly
Adobe Illustrator / Inkscape
Illustrator is the paid industry standard for arranging panels, fixing paths and setting fonts; Inkscape is the free, open-source vector editor that covers the same SVG work.
Data graphs with statistics
GraphPad Prism
Runs the statistical tests and draws publication graphs from the same data table; common in biomedical labs.
Chemical structures and reaction schemes
ChemDraw
Draws molecules, reactions and mechanisms with chemistry-aware bonds, atoms and naming.
Slides, posters and simple schematics
PowerPoint
Shapes, connectors and text boxes most researchers already know; quick for workflow sketches and talk figures.
Biology icons and cell components
BioRender icon library and free libraries such as Servier Medical Art, NIH BioART and Bioicons
Drag-and-drop cells, organelles, lab equipment and organisms you assemble into a figure. See our guide to free scientific icon libraries.
How SciFig fits in: SciFig takes you from a description or your data to a finished, editable figure — SciFig AI Illustration vectorizes into editable SVG, SciFig FlowChart outputs native SVG, and SciFig DataChart generates charts accurately from your data, with an Excel download. Whenever you want to continue in the program you already use, export SVG for Illustrator or Inkscape, or PPTX to keep editing shapes and text in PowerPoint.
Best AI Image Generator by Discipline
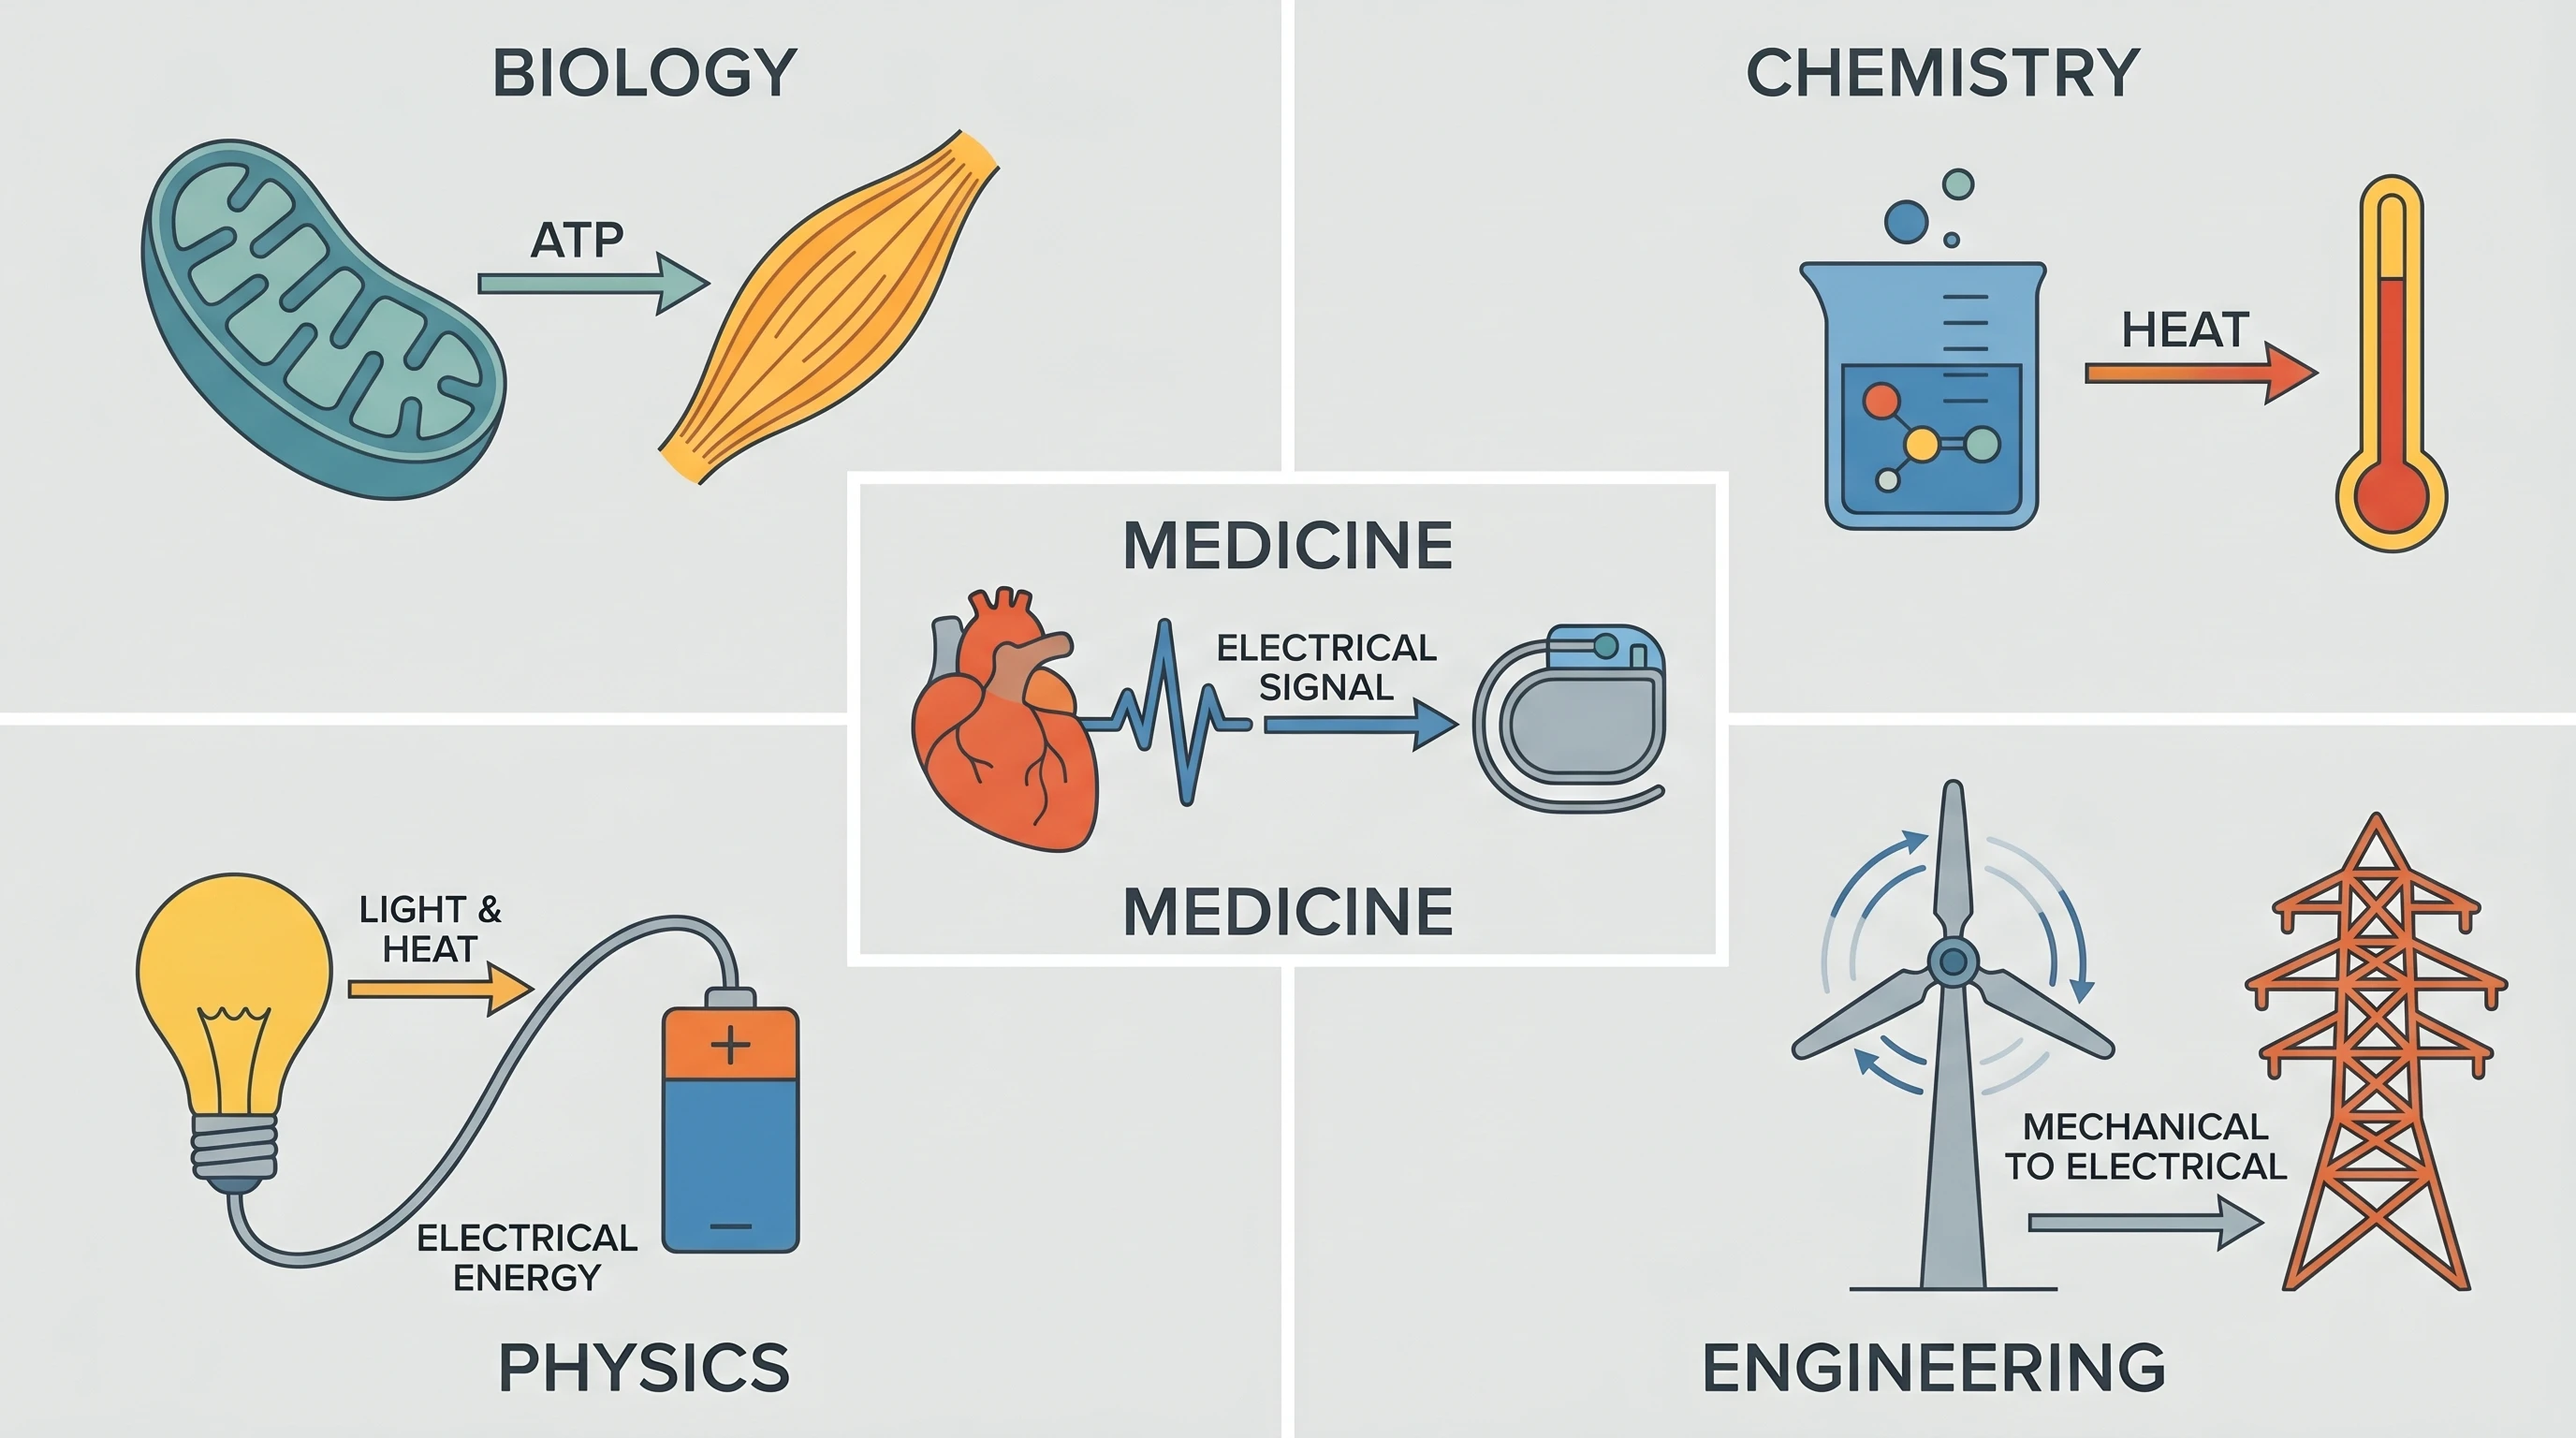
Discipline changes the answer, because each field stresses a different weakness.
Biology — mechanism and pathway correctness dominate; a science-tuned tool (SciFig) or a carefully reviewed strong general model fits best.
Chemistry — reaction schemes and lab apparatus; dedicated chemistry tools or science-tuned generation beat general art models, which mangle structures.
Medicine — see the dedicated section below; accuracy and disclosure obligations are highest here.
Physics — schematics and apparatus reward clean line output and editable vectors over photorealistic generators, which SciFig AI Illustration (with SVG vectorization) and SciFig FlowChart provide.
Engineering — system and process diagrams favor editable, vectorizable output you can label precisely, such as SciFig FlowChart's native SVG.
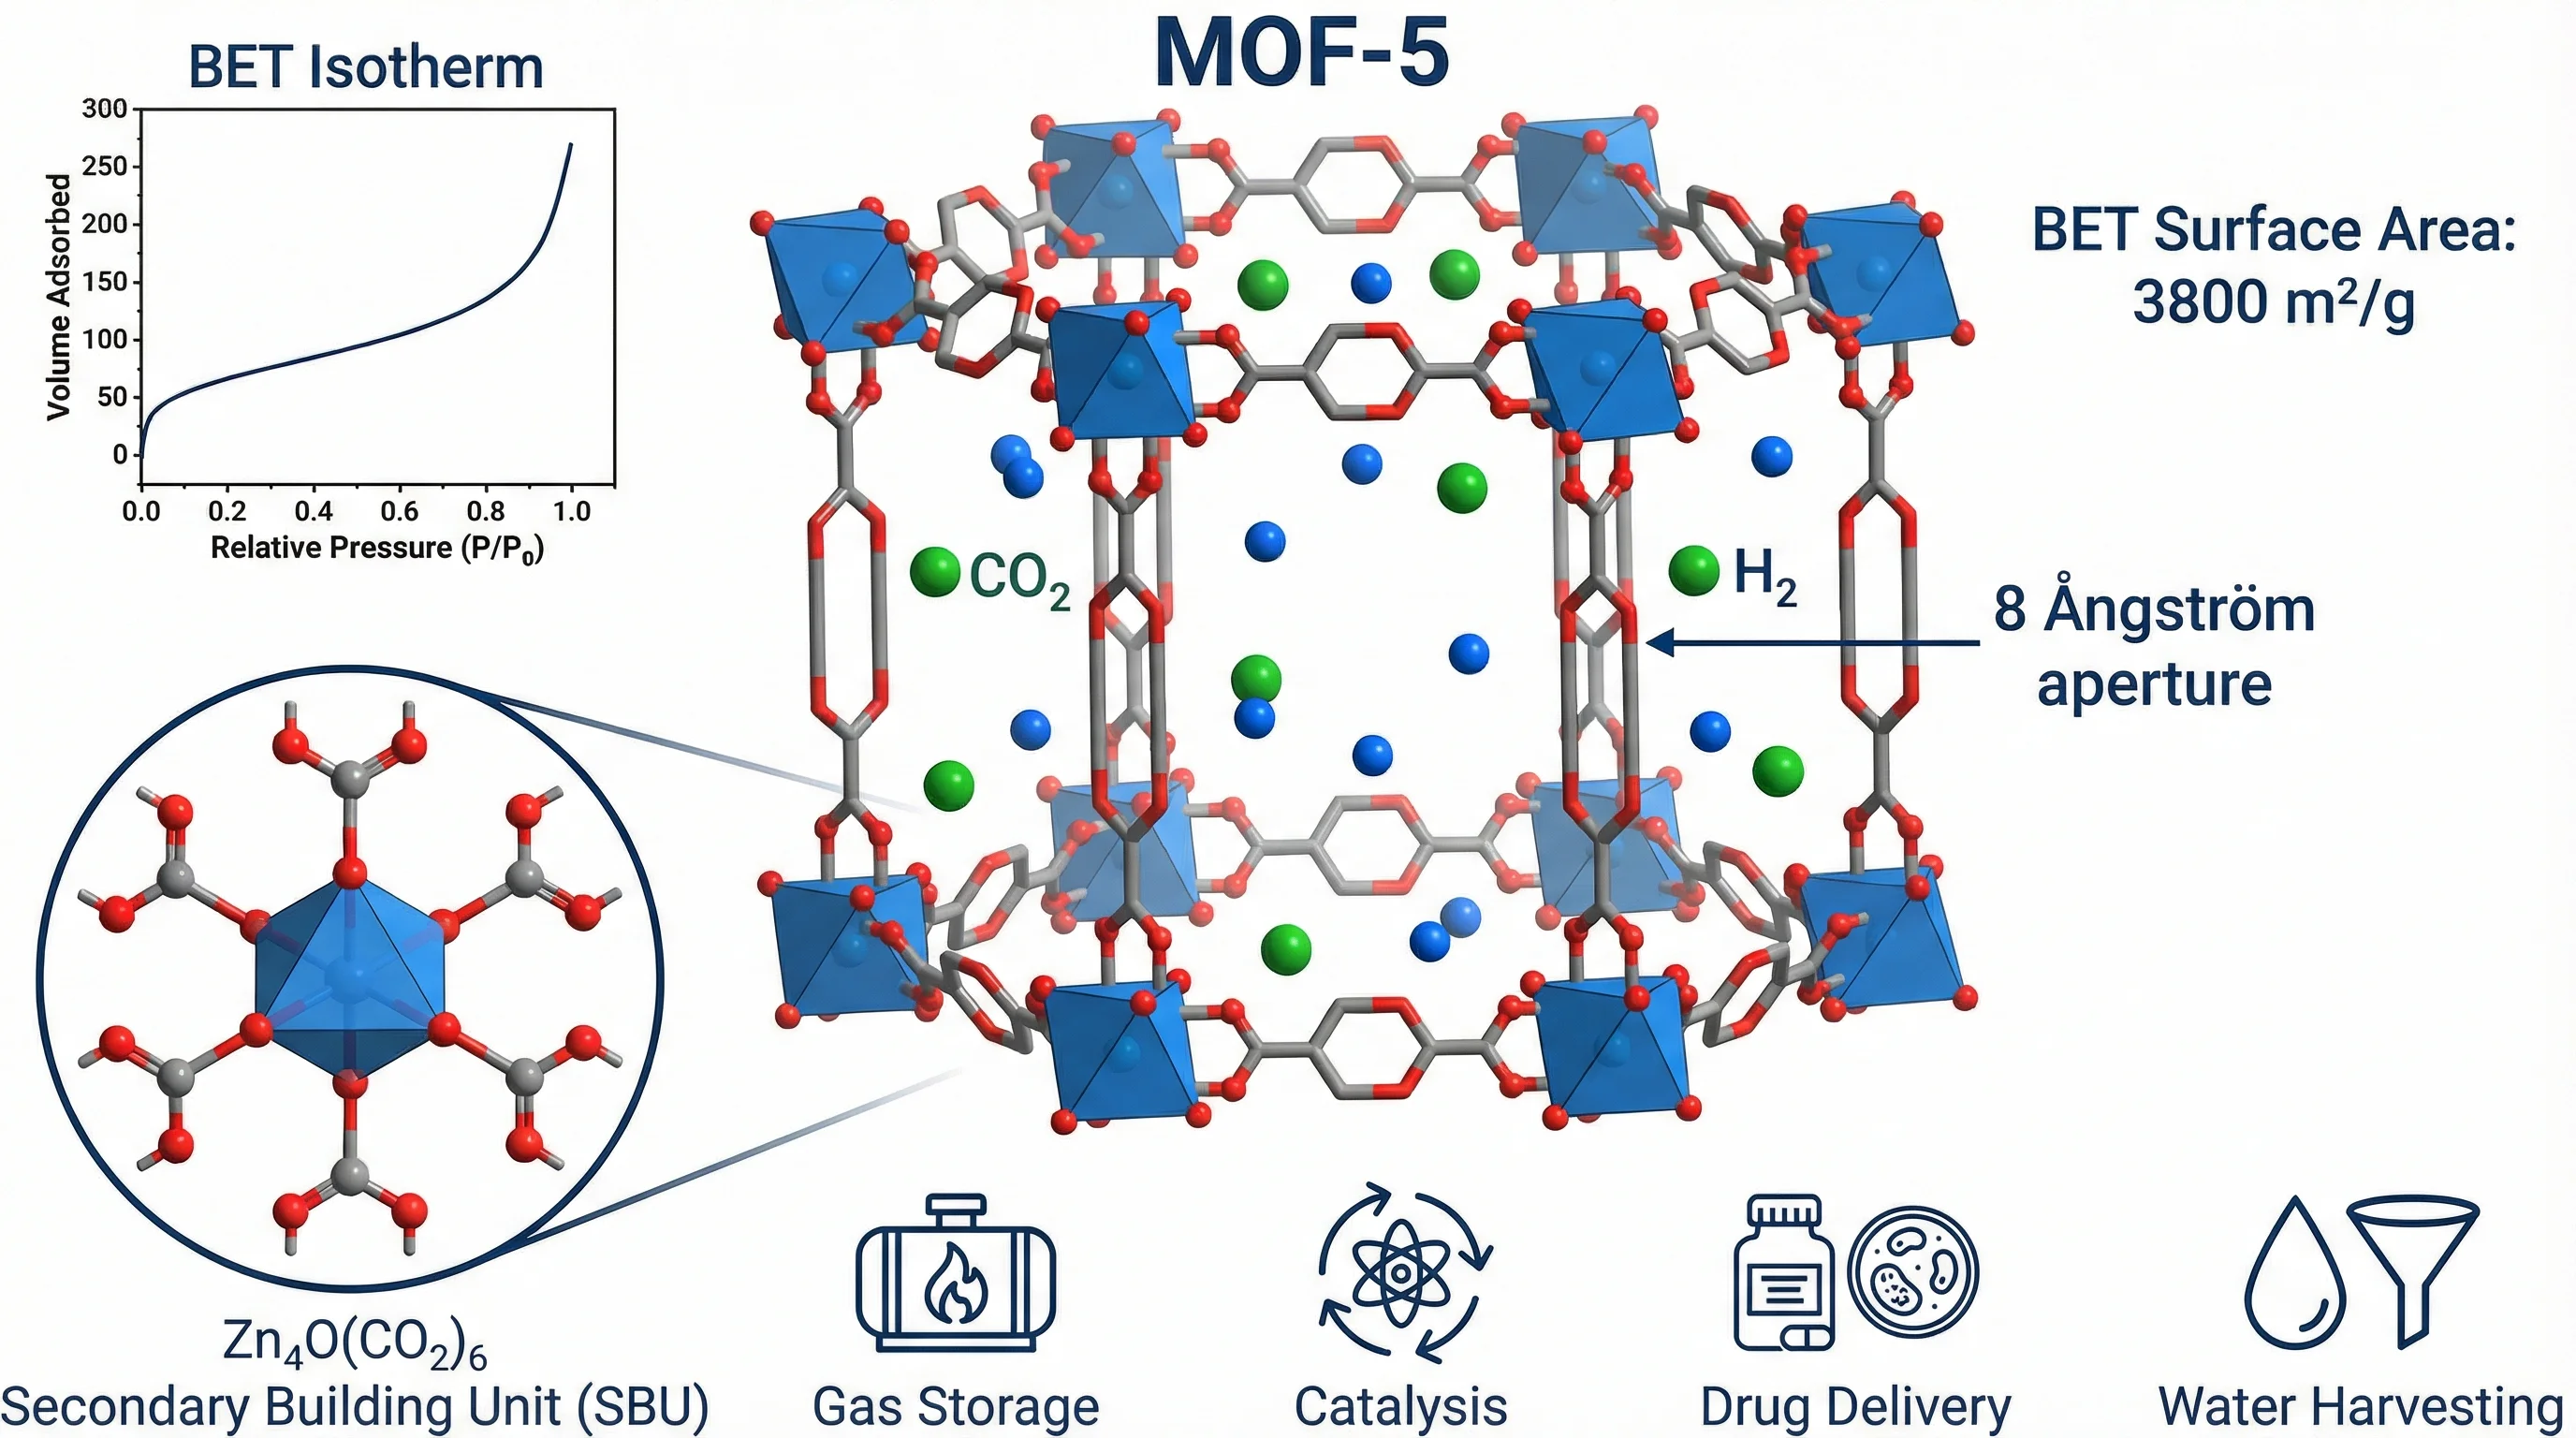
A grid showing the same scientific concept generated for biology, chemistry, medicine, physics, and engineering (Figure generated with SciFig)
What Is the Best AI for Scientific Diagrams?
Researchers searching for the best AI for scientific diagrams are usually not looking for the prettiest general image model. They are looking for the tool that most reliably turns a scientific idea into a scientific figure that still reads correctly after labels, pathways, and relationships are examined. That makes scientific diagrams a stricter problem than generic AI image generation.
In practice, the best AI for scientific diagrams is usually a domain-tuned generator whose output stays editable. A strong first result matters, but being able to change any label, arrow or layout matters more. That is why workflows built around text-to-figure, sketch-to-figure, and vector-canvas outperform beautiful-but-rigid image models once a reviewer starts checking details. The same test applies whether you need the best AI image generator for scientific illustrations or the best AI image generator for scientific diagrams: check how quickly you can fix a wrong label, count or arrow without regenerating the whole figure.
A Note on AI Medical Images
Medical figures deserve their own caution. AI-generated medical illustrations — anatomy, pathology, mechanism-of-action — carry a higher bar because errors can mislead clinical understanding, and because journals and ethics rules scrutinize them more closely. Two rules apply. First, use a tool tuned for scientific accuracy whose output you can edit element by element, such as SciFig, so every anatomical detail matches your reference source. Second, never present an AI-generated image as a real patient image or real medical imaging — generated illustrations are schematic, and journals require drawings rather than reproduced patient photos in many cases anyway. For the policy landscape on AI figures in publications, see are AI-generated figures allowed in journals?.
Free vs Paid + Publication Compliance
SciFig users own their generated scientific figures and have publication and commercial use rights. You can download a license PDF for free. When comparing tools for a submission, three points are useful: the commercial/publication rights of the output, whether the tool discloses training-data licensing (relevant for Firefly and others), and your journal's AI policy — you can disclose AI use according to it, often as a short note in the Methods section or figure legend.
On the free side, SciFig lets you start free, no card required: 150 credits on day one (3 figures), daily check-in credits that grow with your streak (up to 150 a day) — up to about 44 figures in your first month. Invite a friend and you both get 200 more credits. Editing, saving and exporting are free, and failed tasks refund their credits automatically.
SciFig also offers paid plans that bring higher output, more advanced editing and stronger AI capabilities. Starter is $8.33/month with a yearly subscription ($100/year), paid credits never expire (your balance stays even after you cancel), and students, educators and researchers get an extra 20% off one new purchase, on top of yearly savings. See pricing for details.
A practical compliance reference: use a tool whose output rights are documented (SciFig's license PDF covers this), keep figures editable so any detail can be adjusted, and disclose AI use according to your journal's AI policy.
How to Prompt for Publication-Grade Output
Tool choice is half the result; a clear description is the other half. Name counts ("two scFv variable domains"), directions ("phosphorylation precedes dimerization"), and labels the way you would in a figure caption. Mastering Scientific AI Prompts has worked examples, but the one-line version is: describe the science the way you'd write a figure caption, then edit any element you want to change.
This is also why an editable workflow matters. With SciFig's text-to-figure tool, the generated scientific figure drops into a vector canvas where you change the one label or count you want directly, in a minute — rather than re-rolling the whole image and hoping the next draft doesn't introduce a different error. To see real prompt-to-figure results, browse the inspiration gallery.
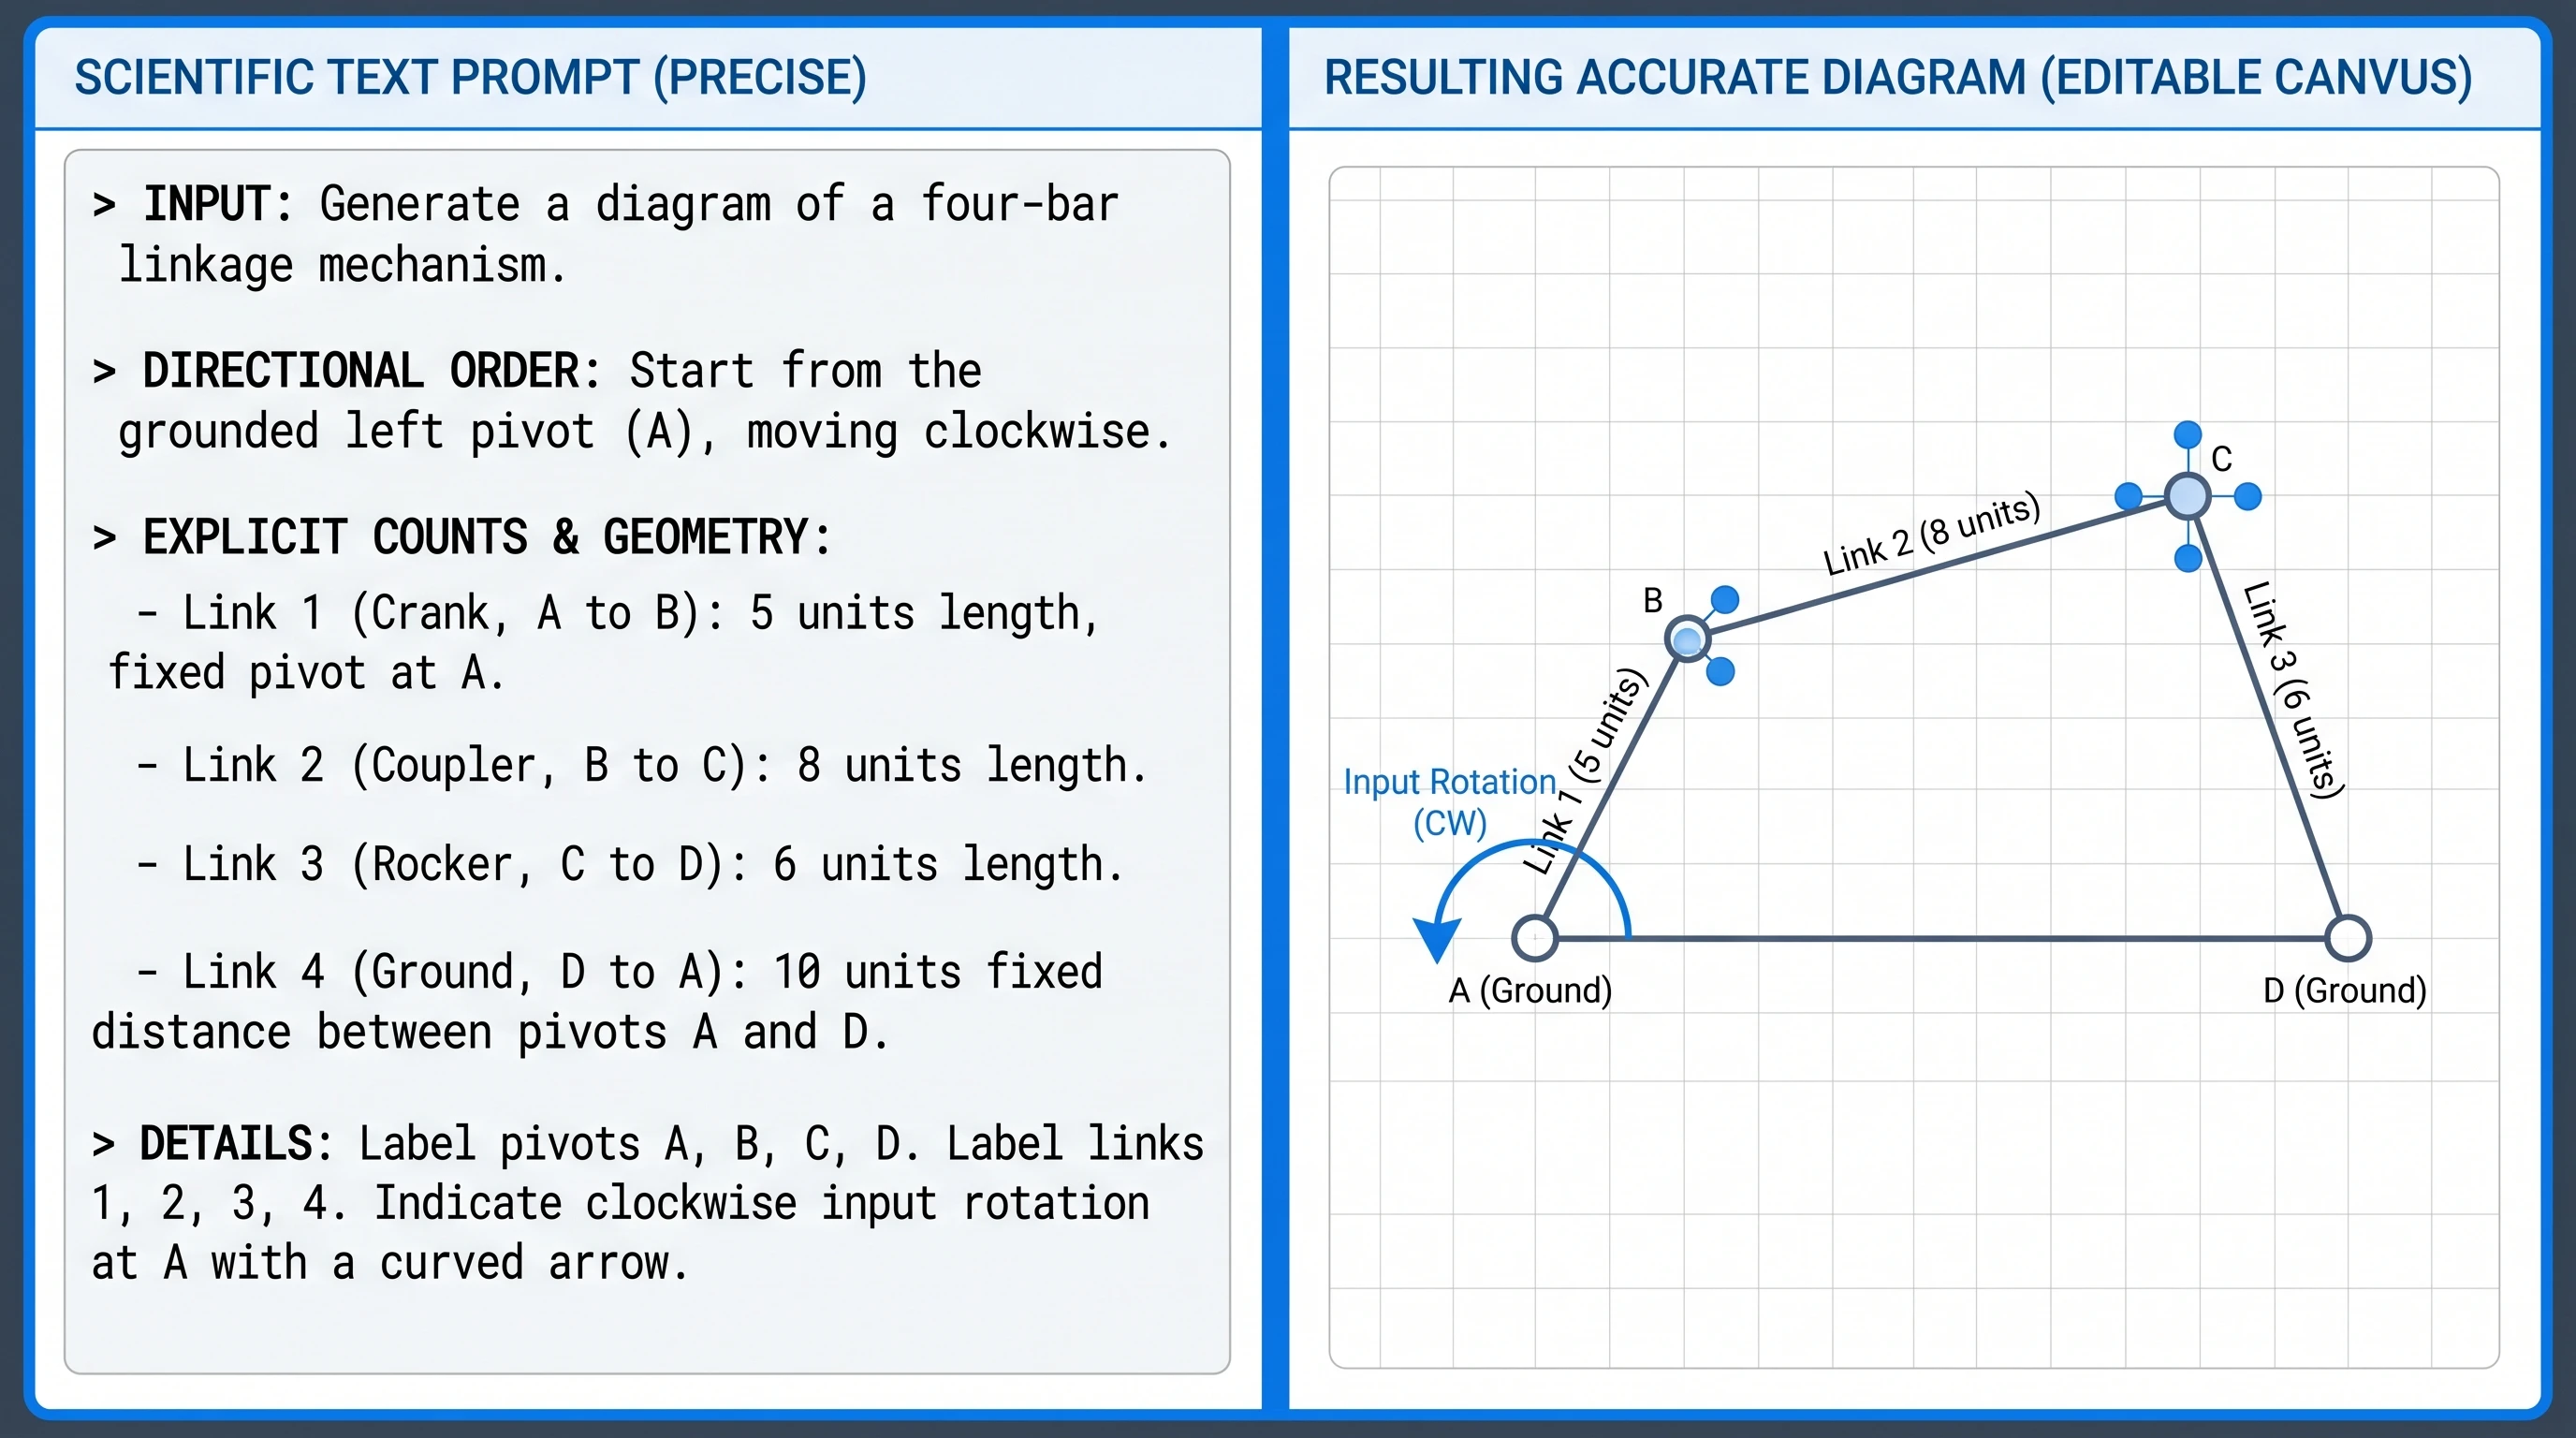
A prompt-to-figure demo: a precise scientific prompt on the left, an accurate generated mechanism diagram on the right (Figure generated with SciFig)
Create Scientific Figures Now
Describe your scientific figure in natural language — get publication-ready illustrations in minutes.
What Makes the Best Website for a Scientific Figure Generator
The best website for a scientific figure generator is not the site with the flashiest gallery. It is the one that closes the loop from prompt to correction to export — which is also what makes it the best AI for figure generation in real research use. Researchers do not just need an image. They need a site that helps generate a scientific figure, edit any element, and move it into a paper or poster without restarting from zero.
That usually means three things:
multiple input modes rather than text alone
an editing surface for labels, layout, and emphasis
outputs that survive journal, poster, and slide use
If a site cannot do those three jobs, it may still be a good AI image generator. It is just weaker as a scientific figure generator.
If you want a direct product-level starting point rather than another comparison, SciFig's AI scientific image generator is the clearest bridge from this list into a real figure workflow. For more control, move from that tool page into text-to-figure or vector-canvas once you know what kind of figure you need.
Frequently Asked Questions
SciFig is the best fit for most scientific figures, including biology diagrams. A good-looking image is easy; a wrong label that forces a redraw is the real problem. SciFig lets you edit every label and arrow after generation and vectorize the figure into editable SVG; SciFig DataChart plots your data accurately, and SciFig FlowChart outputs native SVG diagrams — ready for papers, theses, posters and slides.
It depends on the journal, the type of figure, and how it was made. Many journals ask for disclosure where applicable, and some venues restrict generated images or require prior editorial permission. The specific journal's current instructions are your reference, and SciFig's free license PDF documents your output rights. See AI figure policies at major journals.
Usually yes for illustrations and schematics. You can disclose the AI tool according to the journal's policy, typically in the Methods or figure legend, and a generated image never stands in for experimental data such as micrographs or blots. Some publishers restrict generated images more strictly, so the specific journal's instructions are the reference; our summary of AI figure policies at major journals covers the main publishers.
Most scientists combine several programs: Adobe Illustrator or the free Inkscape for vector illustration and panel assembly, GraphPad Prism for statistical graphs, ChemDraw for chemical structures, PowerPoint for quick schematics, and icon libraries such as BioRender, Servier Medical Art or Bioicons for biology components. SciFig now covers mechanism illustrations, data charts and flowcharts in one workspace, with editable SVG and PPTX export whenever you want to continue in those programs.
Describe the counts, structures, compartments, labels, and arrow directions you need. In SciFig you can also add a sketch, reference image or PDF for the layout and scientific objects, then edit any element in the editable SVG.
Yes. SciFig is a free AI image generator to start with: no credit card, 3 figures on day one and up to about 44 in your first month, with free editing and export. SciFig users own their generated scientific figures and can use them for publication and commercial purposes. For medical figures, SciFig's editable SVG lets you adjust any anatomical detail to match your reference; never present a generated image as a real patient image.
SciFig is built for scientific diagrams: SciFig AI Illustration creates mechanism and concept figures you can vectorize into editable SVG, SciFig FlowChart creates native SVG workflows and model architectures, and SciFig DataChart generates charts accurately from your data. Every label, connection and layout element stays editable, so a wrong arrow is a quick change rather than a redraw.
SciFig is built around the whole research-figure workflow, which is what makes a scientific figure generator website useful: generation, revision, export, and publication rights. Generate from text, a sketch, a reference image or a PDF; edit any label, arrow or layout on the vector canvas; plot data with SciFig DataChart and diagrams with SciFig FlowChart; then export SVG, PNG or PPTX with a free license PDF. A flashy gallery is not enough if the site cannot help you fix labels or adapt the figure for a paper or poster.
This article surveys ten AI image generators across the science landscape to help you choose a category of tool. The GPT Image 2 vs Nano Banana Pro comparison is a deep two-model head-to-head with discipline-by-discipline testing. Use this list to narrow your options; use that comparison when you've shortlisted those two strong general models and need the detailed verdict.
Keep going
Recommended resources
Templates, tools, and further reading for your research