AI Scientific Figure Maker: How to Pick One (2026)
How to choose an AI scientific figure maker in 2026: research figure generation, software for scientific papers, biology diagrams, and publication-ready output.
SciFig Team
SciFig editorial team
"AI figure generator" returns a dozen tools that all claim to make scientific figures, and they are not interchangeable. Some generate from text, some assemble from icons, some are general art models wearing a science label. Pick the wrong one and you'll spend more time fixing wrong molecular topology than you'd have spent drawing the figure by hand. Pick the right one and a publication-quality scientific figure takes minutes.
This is a decision guide, not a feature dump. Three questions narrow the field fast, then a focused comparison shows which AI scientific figure maker fits each answer. If you'd rather see the full survey of every option first, our 10 best AI image generators for science covers the landscape; this guide is about choosing — getting you to the right tool with the least deliberation.
A quick disambiguation: this article is about AI tools that make scientific figures and diagrams. It is not about Figure AI, the humanoid-robotics company — a common search mix-up. If you're here for research figures, read on.
A researcher choosing an AI scientific figure maker, with a decision path branching toward the right tool (Figure generated with SciFig)
Choose a model and continue the figure
Compare Nano Banana 2.1 and GPT Image 2.5 for scientific figures, from labels and layouts to focused edits. The comparison guide includes a short prompt structure and selected scientific image examples; the Flare/Sunburst comparison helps you choose a version.
You can pick the right tool by answering three questions in order. Each one eliminates options, so by the third you're usually down to one or two.
Do you need to generate from a description, or assemble from existing parts? If your figure is a standard composition of common objects (a generic labeled cell), an icon library is fast. If it's a specific, novel, or mechanism-heavy scientific figure, you want a generative tool that produces it from a prompt.
Does it need to be publication-accurate? If the scientific figure goes in a manuscript and a reviewer will check molecular detail, you need a tool tuned for scientific correctness — not a general art model that optimizes for looking plausible. If it's a teaching slide or concept image, a general model is fine.
What's your budget and volume? A few figures a year fits a free tier; dozens with full publication rights changes the math. Free icon-and-editor toolchains cost nothing but your time; AI subscriptions cost money but save hours per scientific figure.
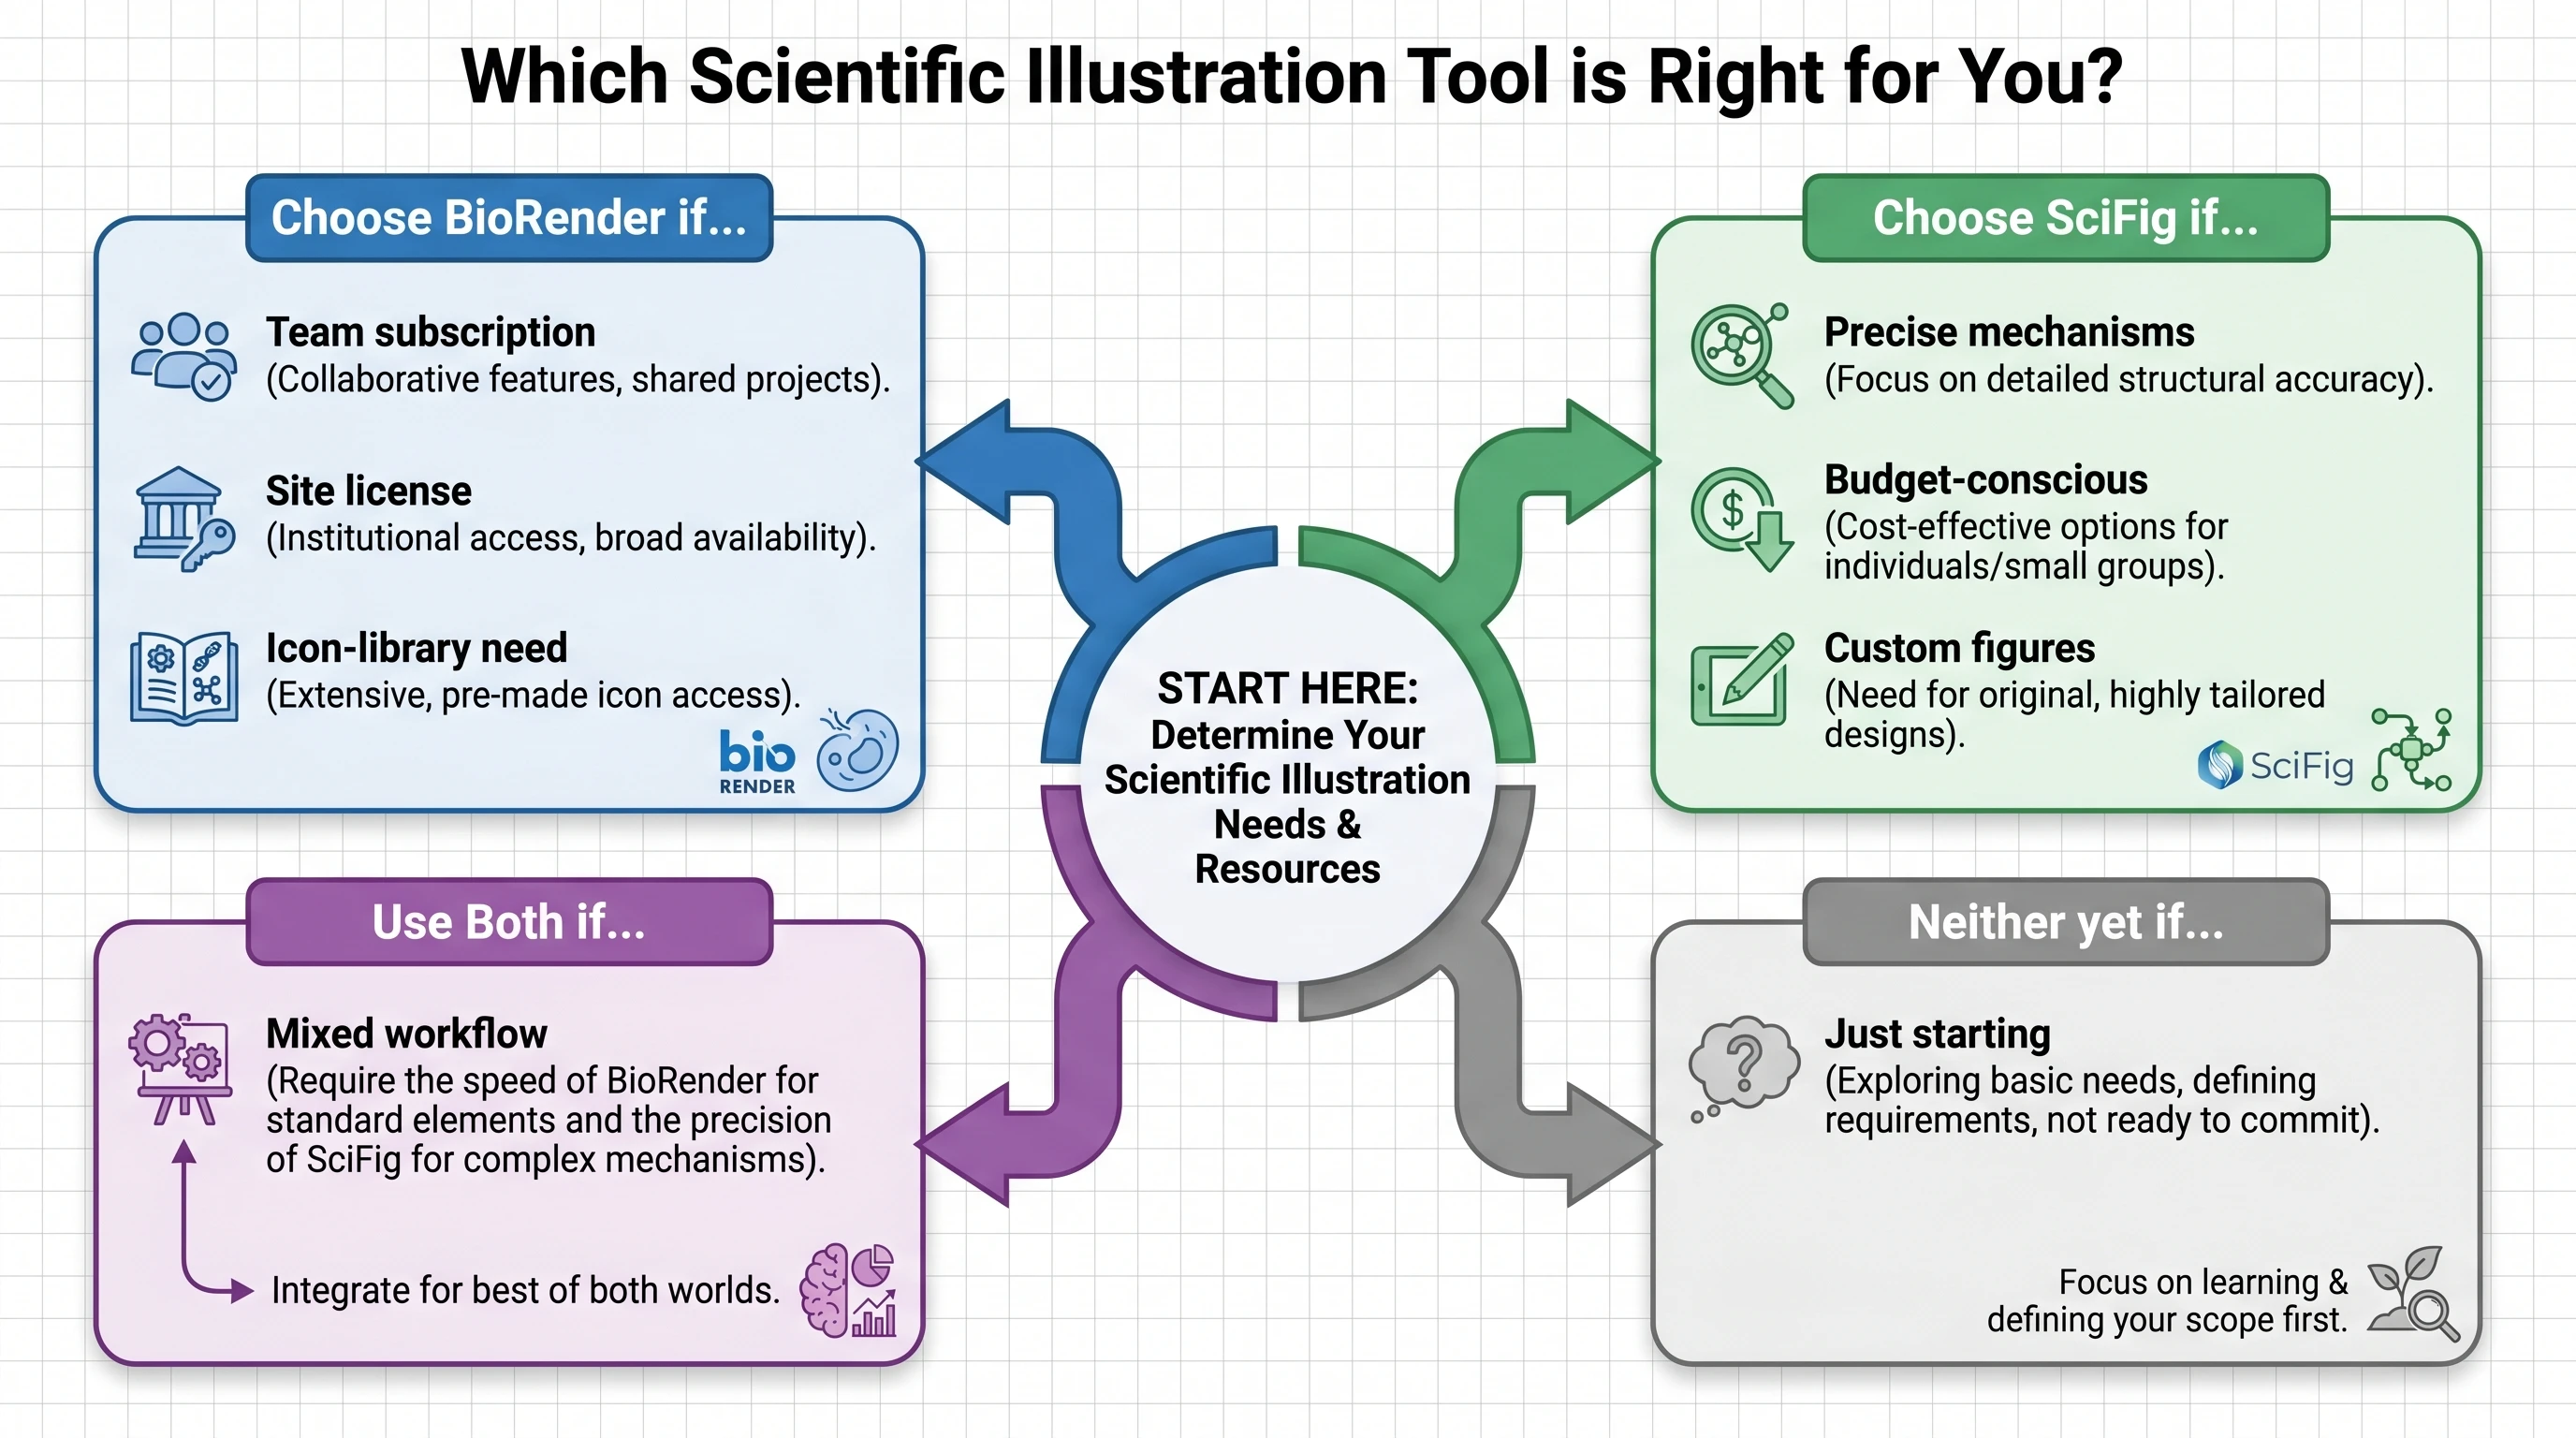
The pattern: generative + accurate + reasonable volume points to a science-tuned AI tool. Standard objects + low volume points to an icon library or a free editor. The decision tree below maps the branches.
A three-question decision tree for choosing an AI scientific figure maker, branching to generative AI, icon library, or vector editor (Figure generated with SciFig)
AI Scientific Figure Makers Compared
With your three answers in hand, here's how the main options map. This is a tighter list than a full survey — the tools most researchers actually shortlist.
Tool
Core ability
Best when
Pricing shape
SciFig
SciFig AI Illustration (convert to editable SVG), SciFig DataChart (charts from your data), SciFig FlowChart (native editable SVG)
Mechanisms, data-accurate charts, and editable diagrams in one workspace
Free tier + low-cost subscription
BioRender
Curated icon library + AI assist
Your figure fits the catalog; on an institutional license
Free (capped) + paid tiers
Mind the Graph
Icon library + infographic templates
Graphical abstracts, slide visuals
Freemium
paper-banana
Generative (general)
Quick drafts before a redo
Varies
illustrae
Stylized scientific illustration
Polished graphical-abstract look
Varies
sci-draw
Figure/icon library
Browsable ready-made assets
Varies
SciFig AI Illustration (AI scientific illustration) creates figures from your instructions and reference material, and every result converts to editable SVG so you can adjust any structure, count, orientation, or label. SciFig DataChart (data-driven charts) and SciFig FlowChart (flowcharts and diagrams) cover data plots and editable diagrams in the same workspace.
See AI Scientific Figure Generation in Action
Watch how researchers create publication-ready scientific figures from text descriptions.
Yes — the gate isn't whether AI made the figure, it's whether you disclosed it and reviewed it. Major journals accept AI-generated figures when the work is human-supervised and the AI use is disclosed, typically in the Methods section, and when the output carries publication rights. In practice, journals look for human supervision, a short AI-use note at submission, and publication rights; SciFig output is editable element by element, and you can download a free SciFig license PDF that documents publication and commercial use rights.
What changes the risk is accuracy, which loops back to question two. A scientific figure from a science-tuned tool that you've reviewed is low-risk; a figure from a general art model that you trusted without checking is where desk-rejections and corrections come from. For the full policy picture across journals, see are AI-generated figures allowed in journals?.
How to Prompt for the Best Result
Once you've chosen a generative tool, a few specifics go a long way. Scientific prompting means stating the things the model won't infer: exact counts, directional order, and explicit labels. "A JAK/STAT pathway" gives the model latitude to reverse the steps; "JAK phosphorylation, then STAT dimerization, then nuclear translocation, labeled in order" doesn't. The full method is in Mastering Scientific AI Prompts — the short version is to write the prompt with the precision of a figure caption.
This is also where an editable result earns its keep: with SciFig's text-to-figure tool, the generated scientific figure lands in a vector canvas where one wrong label is a one-minute fix, instead of a re-roll that risks a new error elsewhere.
From Sketch to AI Figure
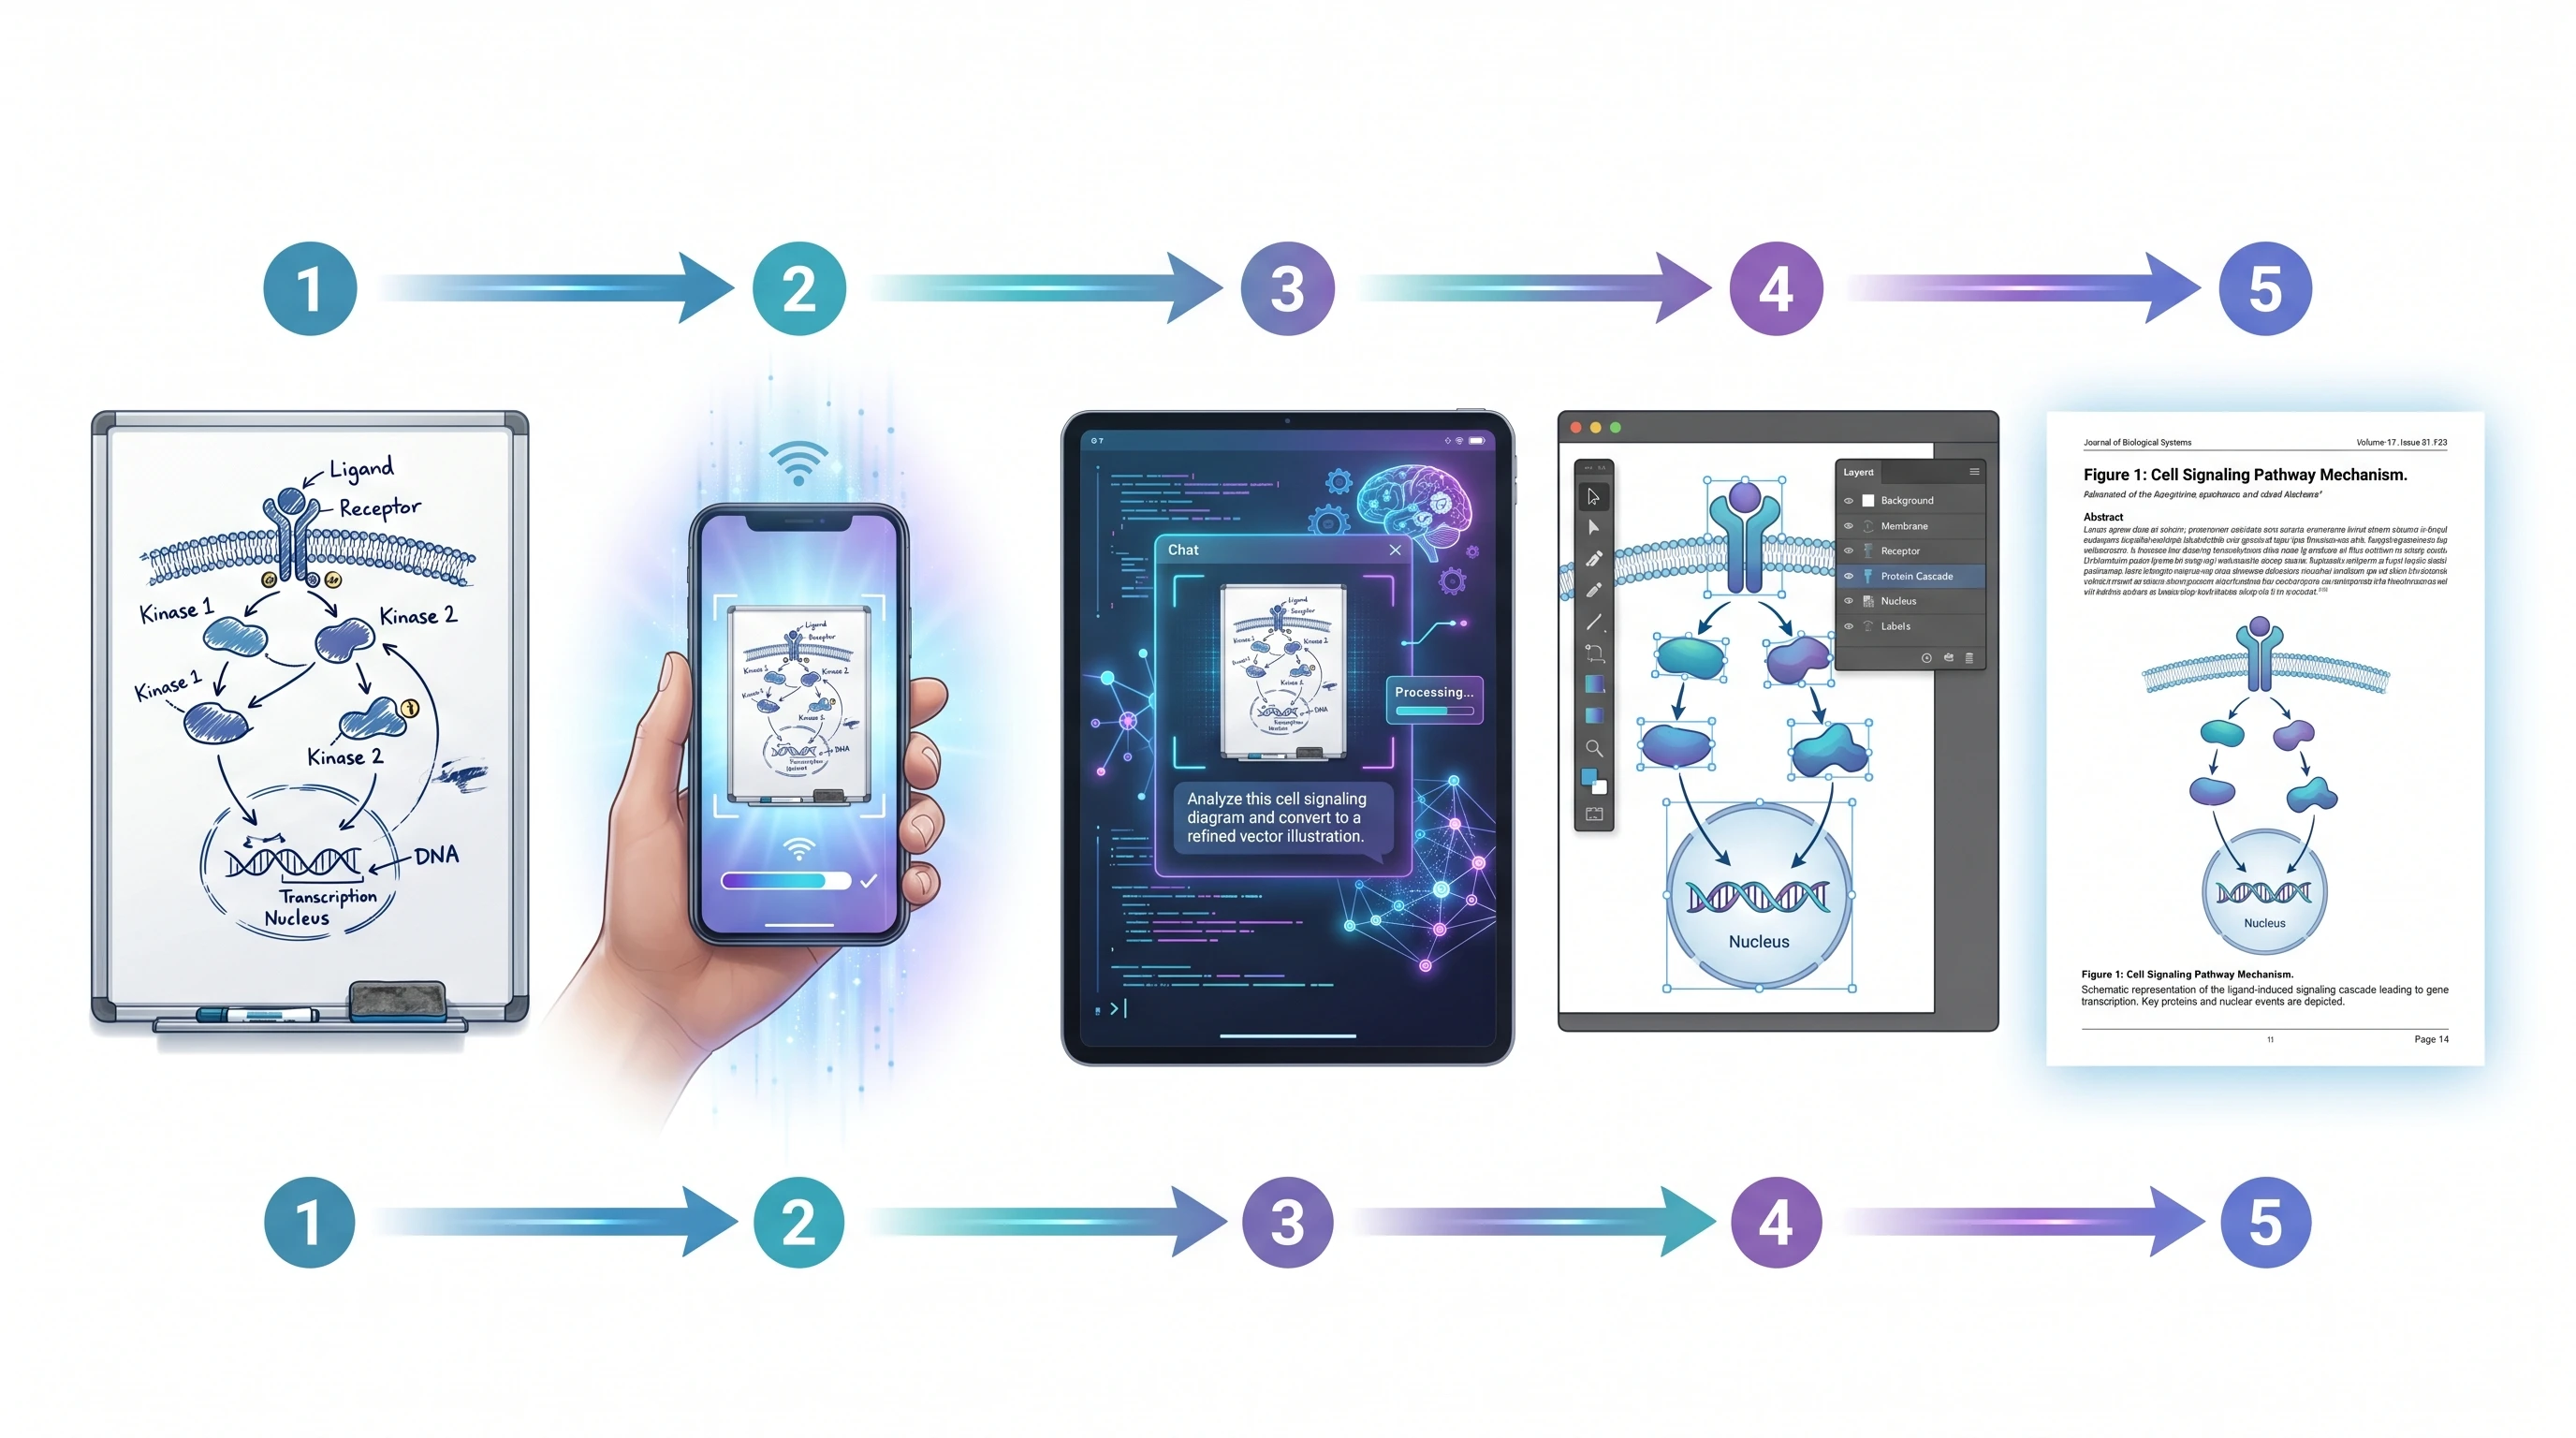
Not every figure starts as text. If you already have a whiteboard sketch or a rough hand drawing — which is how most mechanism figures actually begin — a tool that accepts image input skips the translation step. In SciFig, choose AI Illustration and provide the sketch as reference material. Describe the intended layout and key scientific details, then convert the result to editable SVG to adjust any element. This matters for the decision because it changes question one: if your input is a sketch, you want a generative tool that ingests images, which narrows the field immediately. See from sketch to science for the full workflow.
A rough sketch beside a conceptual illustration created with AI (Figure generated with SciFig)
You can also use reference illustrations or equipment and setup photos you have the right to provide to guide a conceptual figure. For examples of conceptual artwork, browse the inspiration gallery, or compare the models in GPT Image 2 vs Nano Banana Pro.
A prompt-to-figure demonstration showing a scientific prompt and a mechanism figure ready to convert to editable SVG (Figure generated with SciFig)
Create Scientific Figures Now
Describe your scientific figure in natural language — get publication-ready illustrations in minutes.
When evaluating software to make figures for scientific papers, distinguish conceptual mechanisms, plots calculated from original data, editable workflows, and multi-panel composition. Pick the workflow for the task and look for output you can edit element by element and export as vector.
SciFig covers each type: SciFig AI Illustration for mechanism and concept illustrations, SciFig DataChart for charts generated precisely from your original table, and SciFig FlowChart for native editable SVG workflows and model architectures. SciFig DataChart offers 49 scientific chart types, including scatter plots, box plots, and heatmaps; SciFig FlowChart generates native SVG for editing labels, shapes, and connections. SciFig AI Illustration images convert to editable SVG so you can modify any element.
For researchers still comparing broad categories rather than products, it helps to connect this page to the other layers in the stack: our best AI image generators for science guide for the wider market, and best scientific illustration tools for the AI-vs-traditional decision. This page is the narrowest one: how to choose the right figure creator for papers once you already know a generic design canvas is not enough.
Frequently Asked Questions
SciFig covers the three figure types papers need in one place: SciFig AI Illustration for mechanisms you can convert to editable SVG, SciFig DataChart for charts generated precisely from your data, and SciFig FlowChart for native editable SVG diagrams. Icon libraries such as BioRender or Mind the Graph are an option when ready-made library objects already cover the figure; figure type, editing needs, budget, and volume decide the rest.
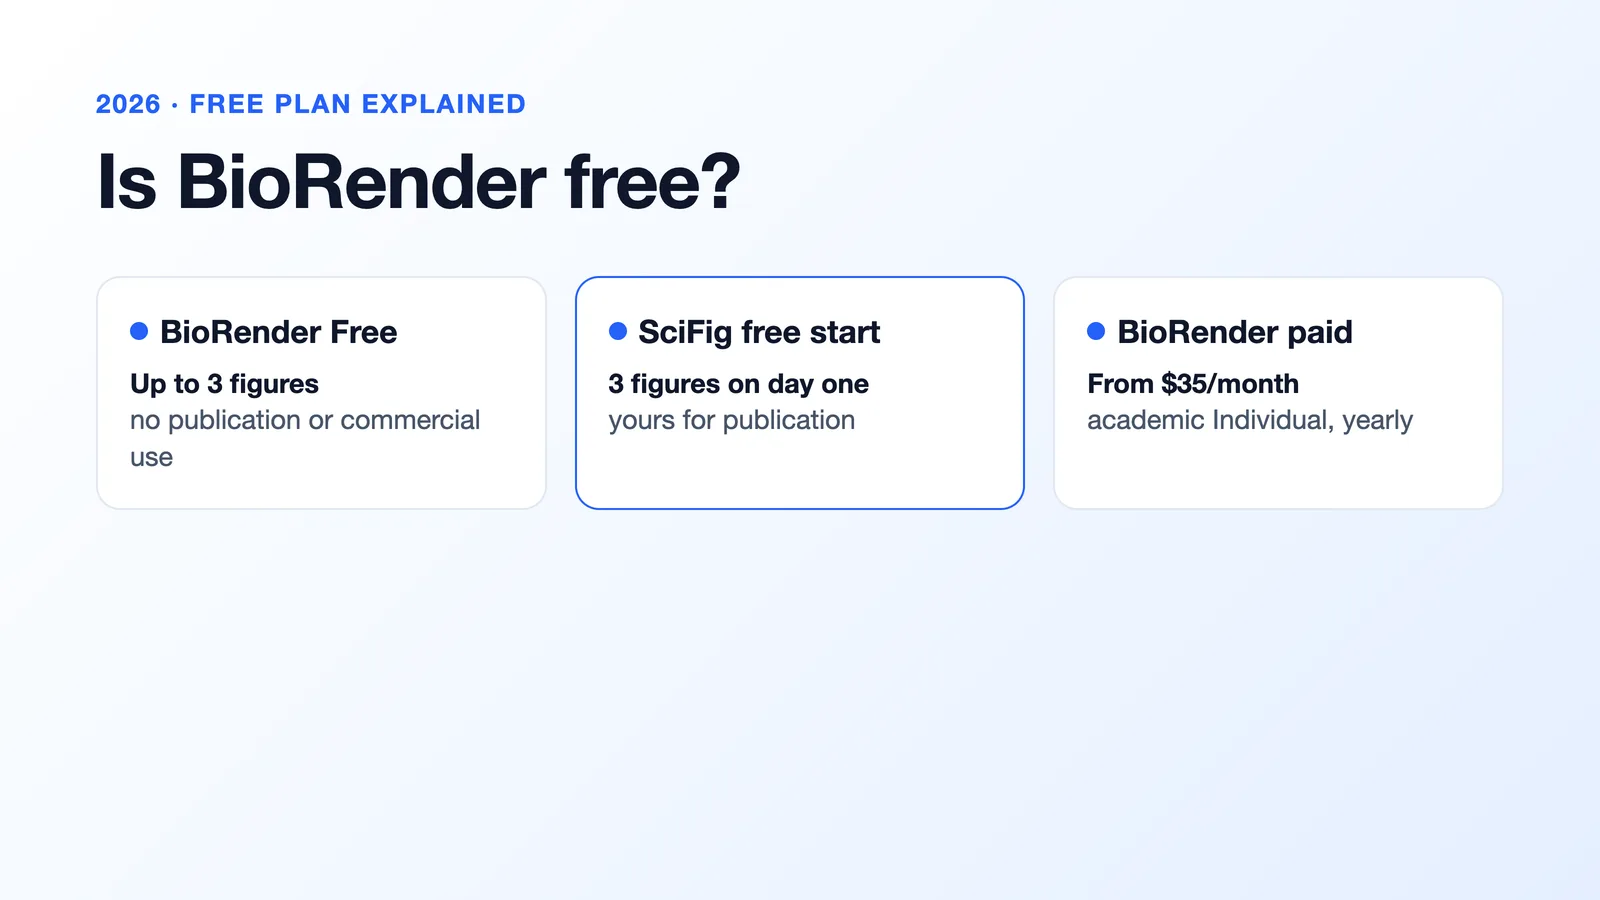
Yes. SciFig offers a free tier (100 signup credits plus a daily check-in of 50–150 credits, about 2,100 credits over a full 30-day streak, with consecutive check-ins earning up to 150 credits a day) that covers up to about 44 figures in your first month without a card or watermark. Free icon libraries (bioicons) paired with a free vector editor (Inkscape) are another zero-cost path, at the price of manual assembly. You can download a SciFig license PDF for free to document your figure’s publication and commercial use rights.
Yes. SciFig AI Illustration creates mechanism and concept images you can convert to editable SVG, SciFig FlowChart generates native editable SVG workflows, and SciFig DataChart plots your original table precisely. Adjust any label, connection, or layout element, then export in the format your manuscript needs. Describe the actual AI-assisted preparation steps when the journal requests disclosure.
No — and it's a common mix-up. "Figure AI" most often refers to Figure AI, a humanoid-robotics company, not a figure-making tool. An AI scientific figure maker is software that generates research figures and diagrams from a description, sketch, or reference. If you're searching for a tool to create scientific figures, look for terms like "AI figure generator for science" or "scientific figure maker" to avoid the robotics results.
This guide helps you decide which tool to use via three narrowing questions and a focused shortlist. Our 10 best AI image generators for science is the broader survey of every option with discipline-by-discipline notes. Use this guide when you want a fast decision; use the survey when you want to explore the full range of tools before deciding.
Yes. SciFig AI Illustration creates mechanism and concept images from descriptions, sketches, or reference material, and you can convert the result to editable SVG to adjust any element.
SciFig covers all three: SciFig DataChart for charts generated precisely from your table, such as scatter plots, box plots, and heatmaps, with downloadable Python plotting code; SciFig AI Illustration for conceptual images you can convert to editable SVG; and SciFig FlowChart for native editable SVG workflows.
SciFig AI Illustration creates biology diagrams from your references and explicit counts or directions, and converts them to editable SVG so you can revise any component, compartment, or interaction. When comparing tools, look at how clearly each represents the required components and whether its output can be edited.
Keep going
Recommended resources
Templates, tools, and further reading for your research