That gap between intent and output is not an AI limitation. It is a prompting problem, and it is entirely solvable.
Experienced researchers who generate dozens of publication-ready illustrations per week are not doing anything exotic. They are following a simple mental framework: they tell the model what to draw, how to arrange it, what it should look like, and how much detail to include. That four-part structure — once you internalize it — transforms your outputs from adequate to exceptional.
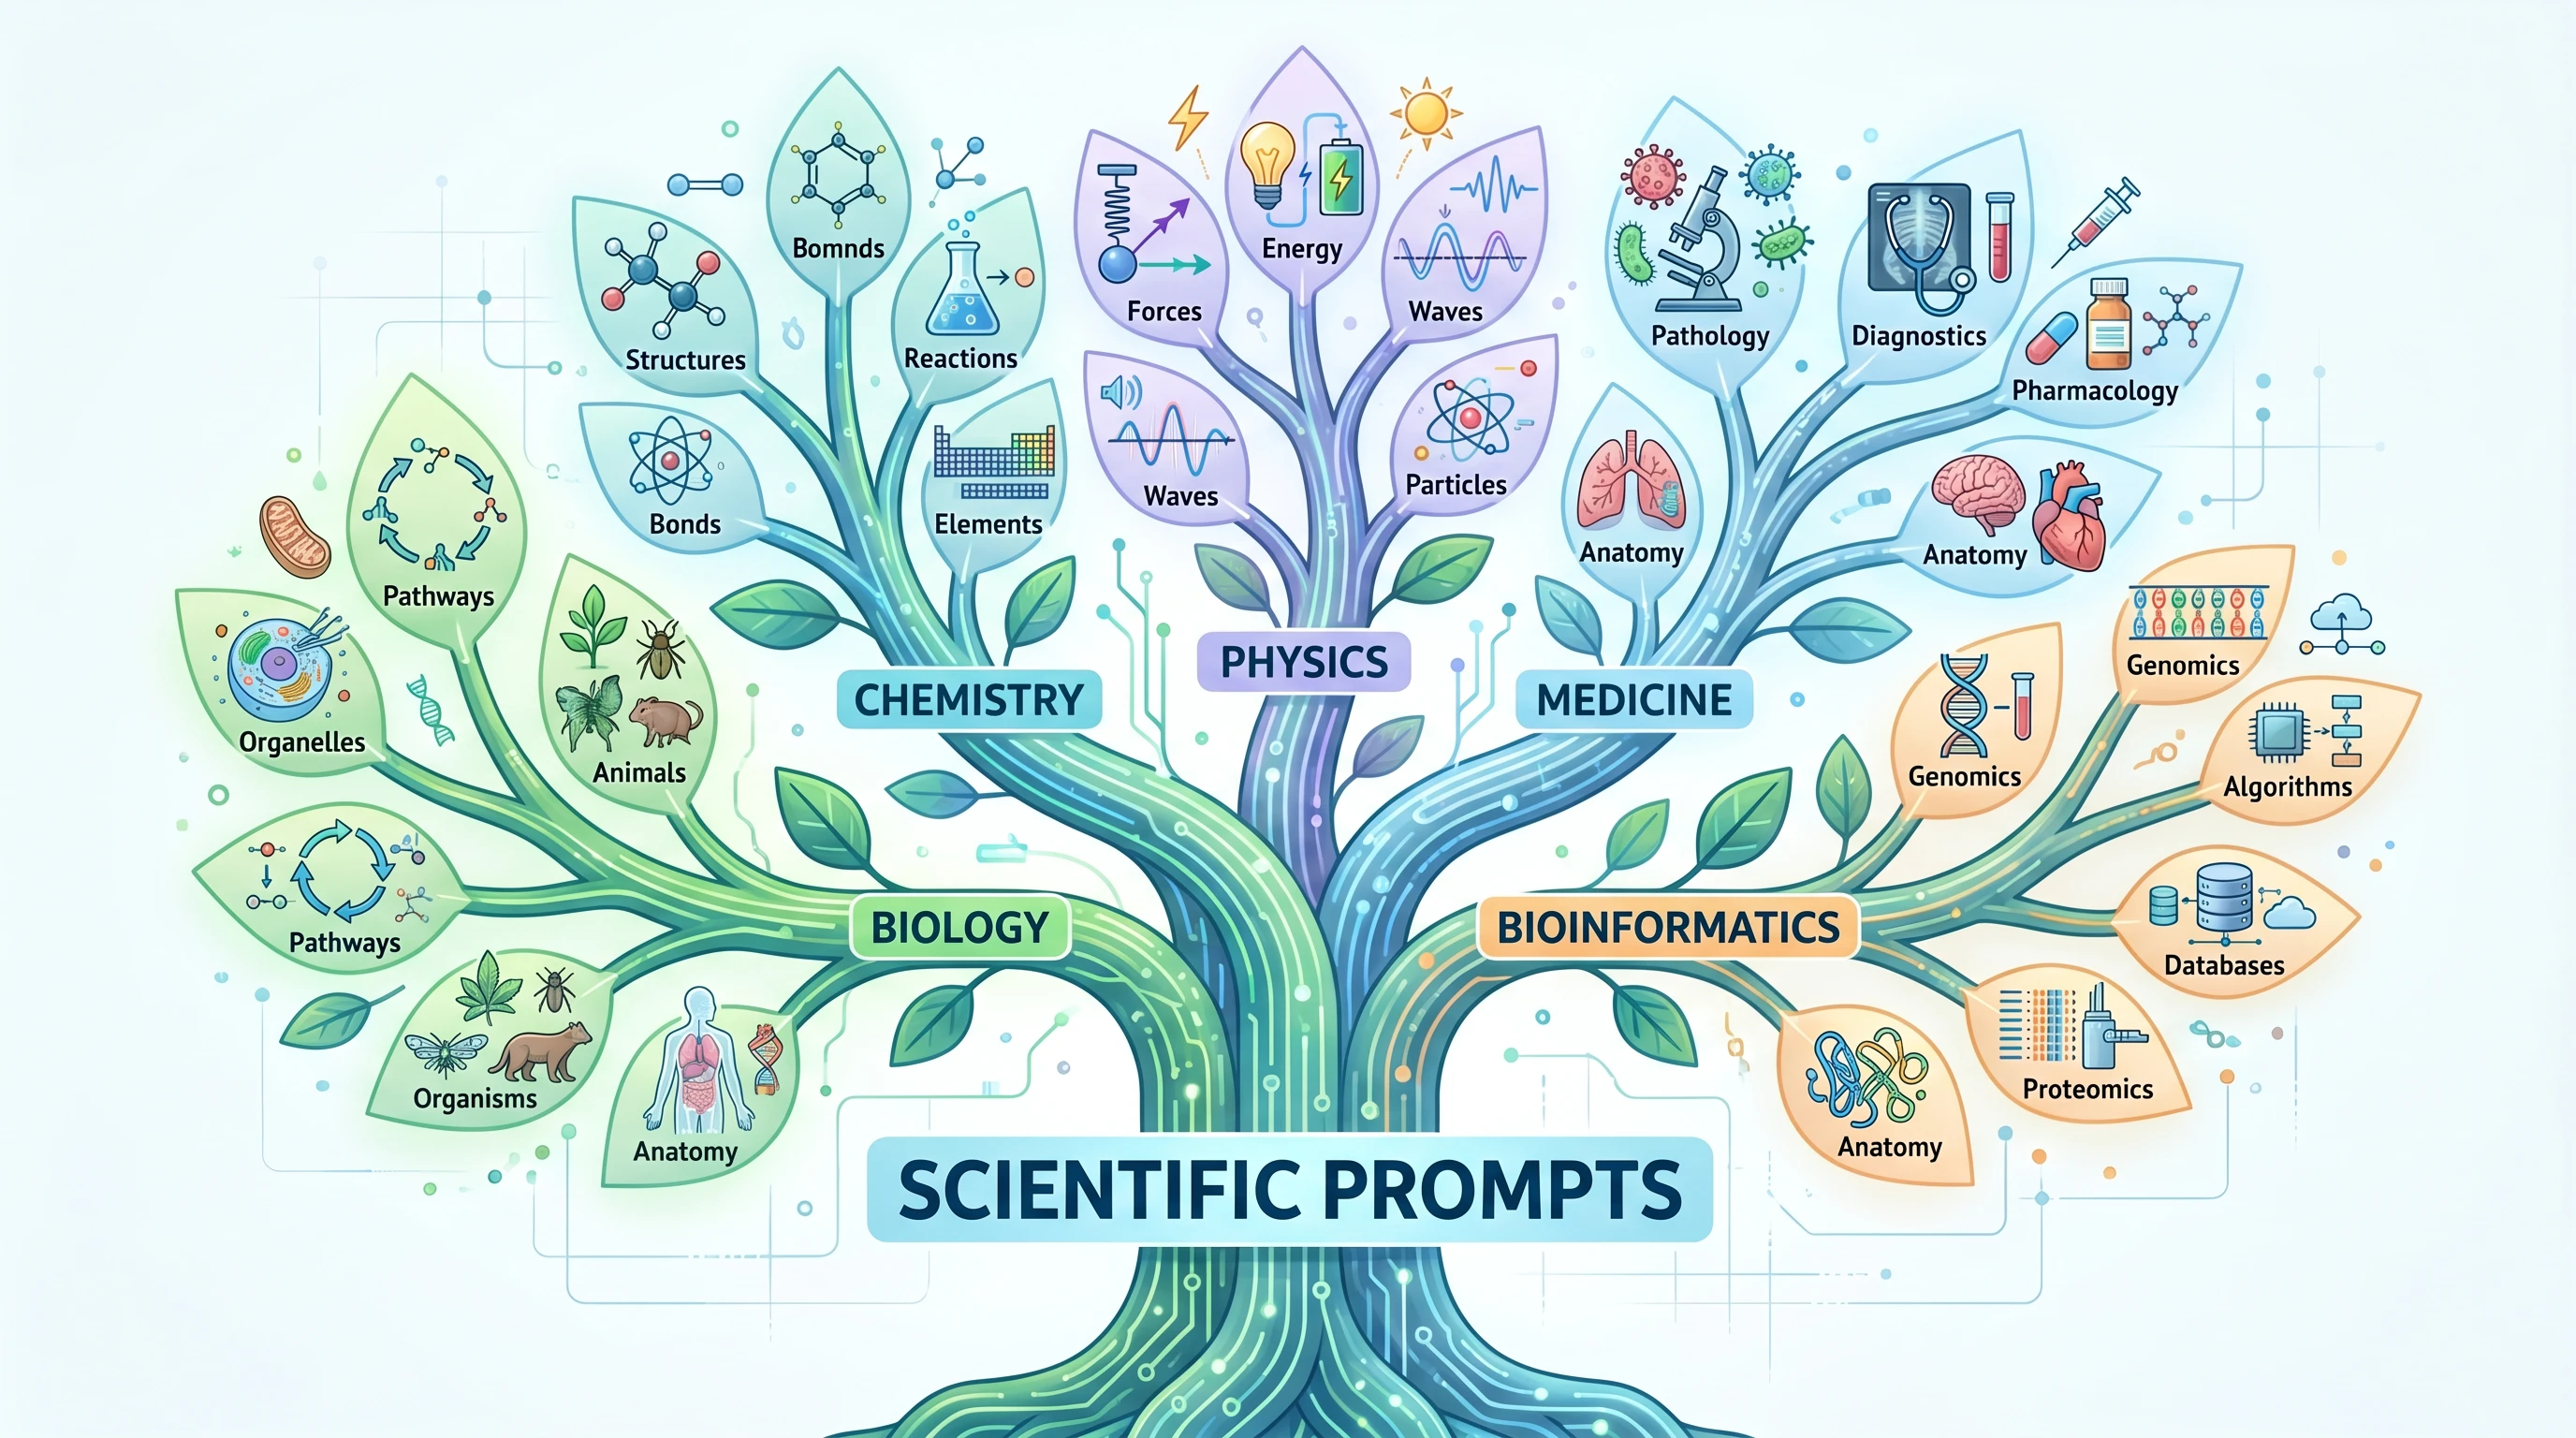
The Anatomy of a Perfect Scientific Prompt
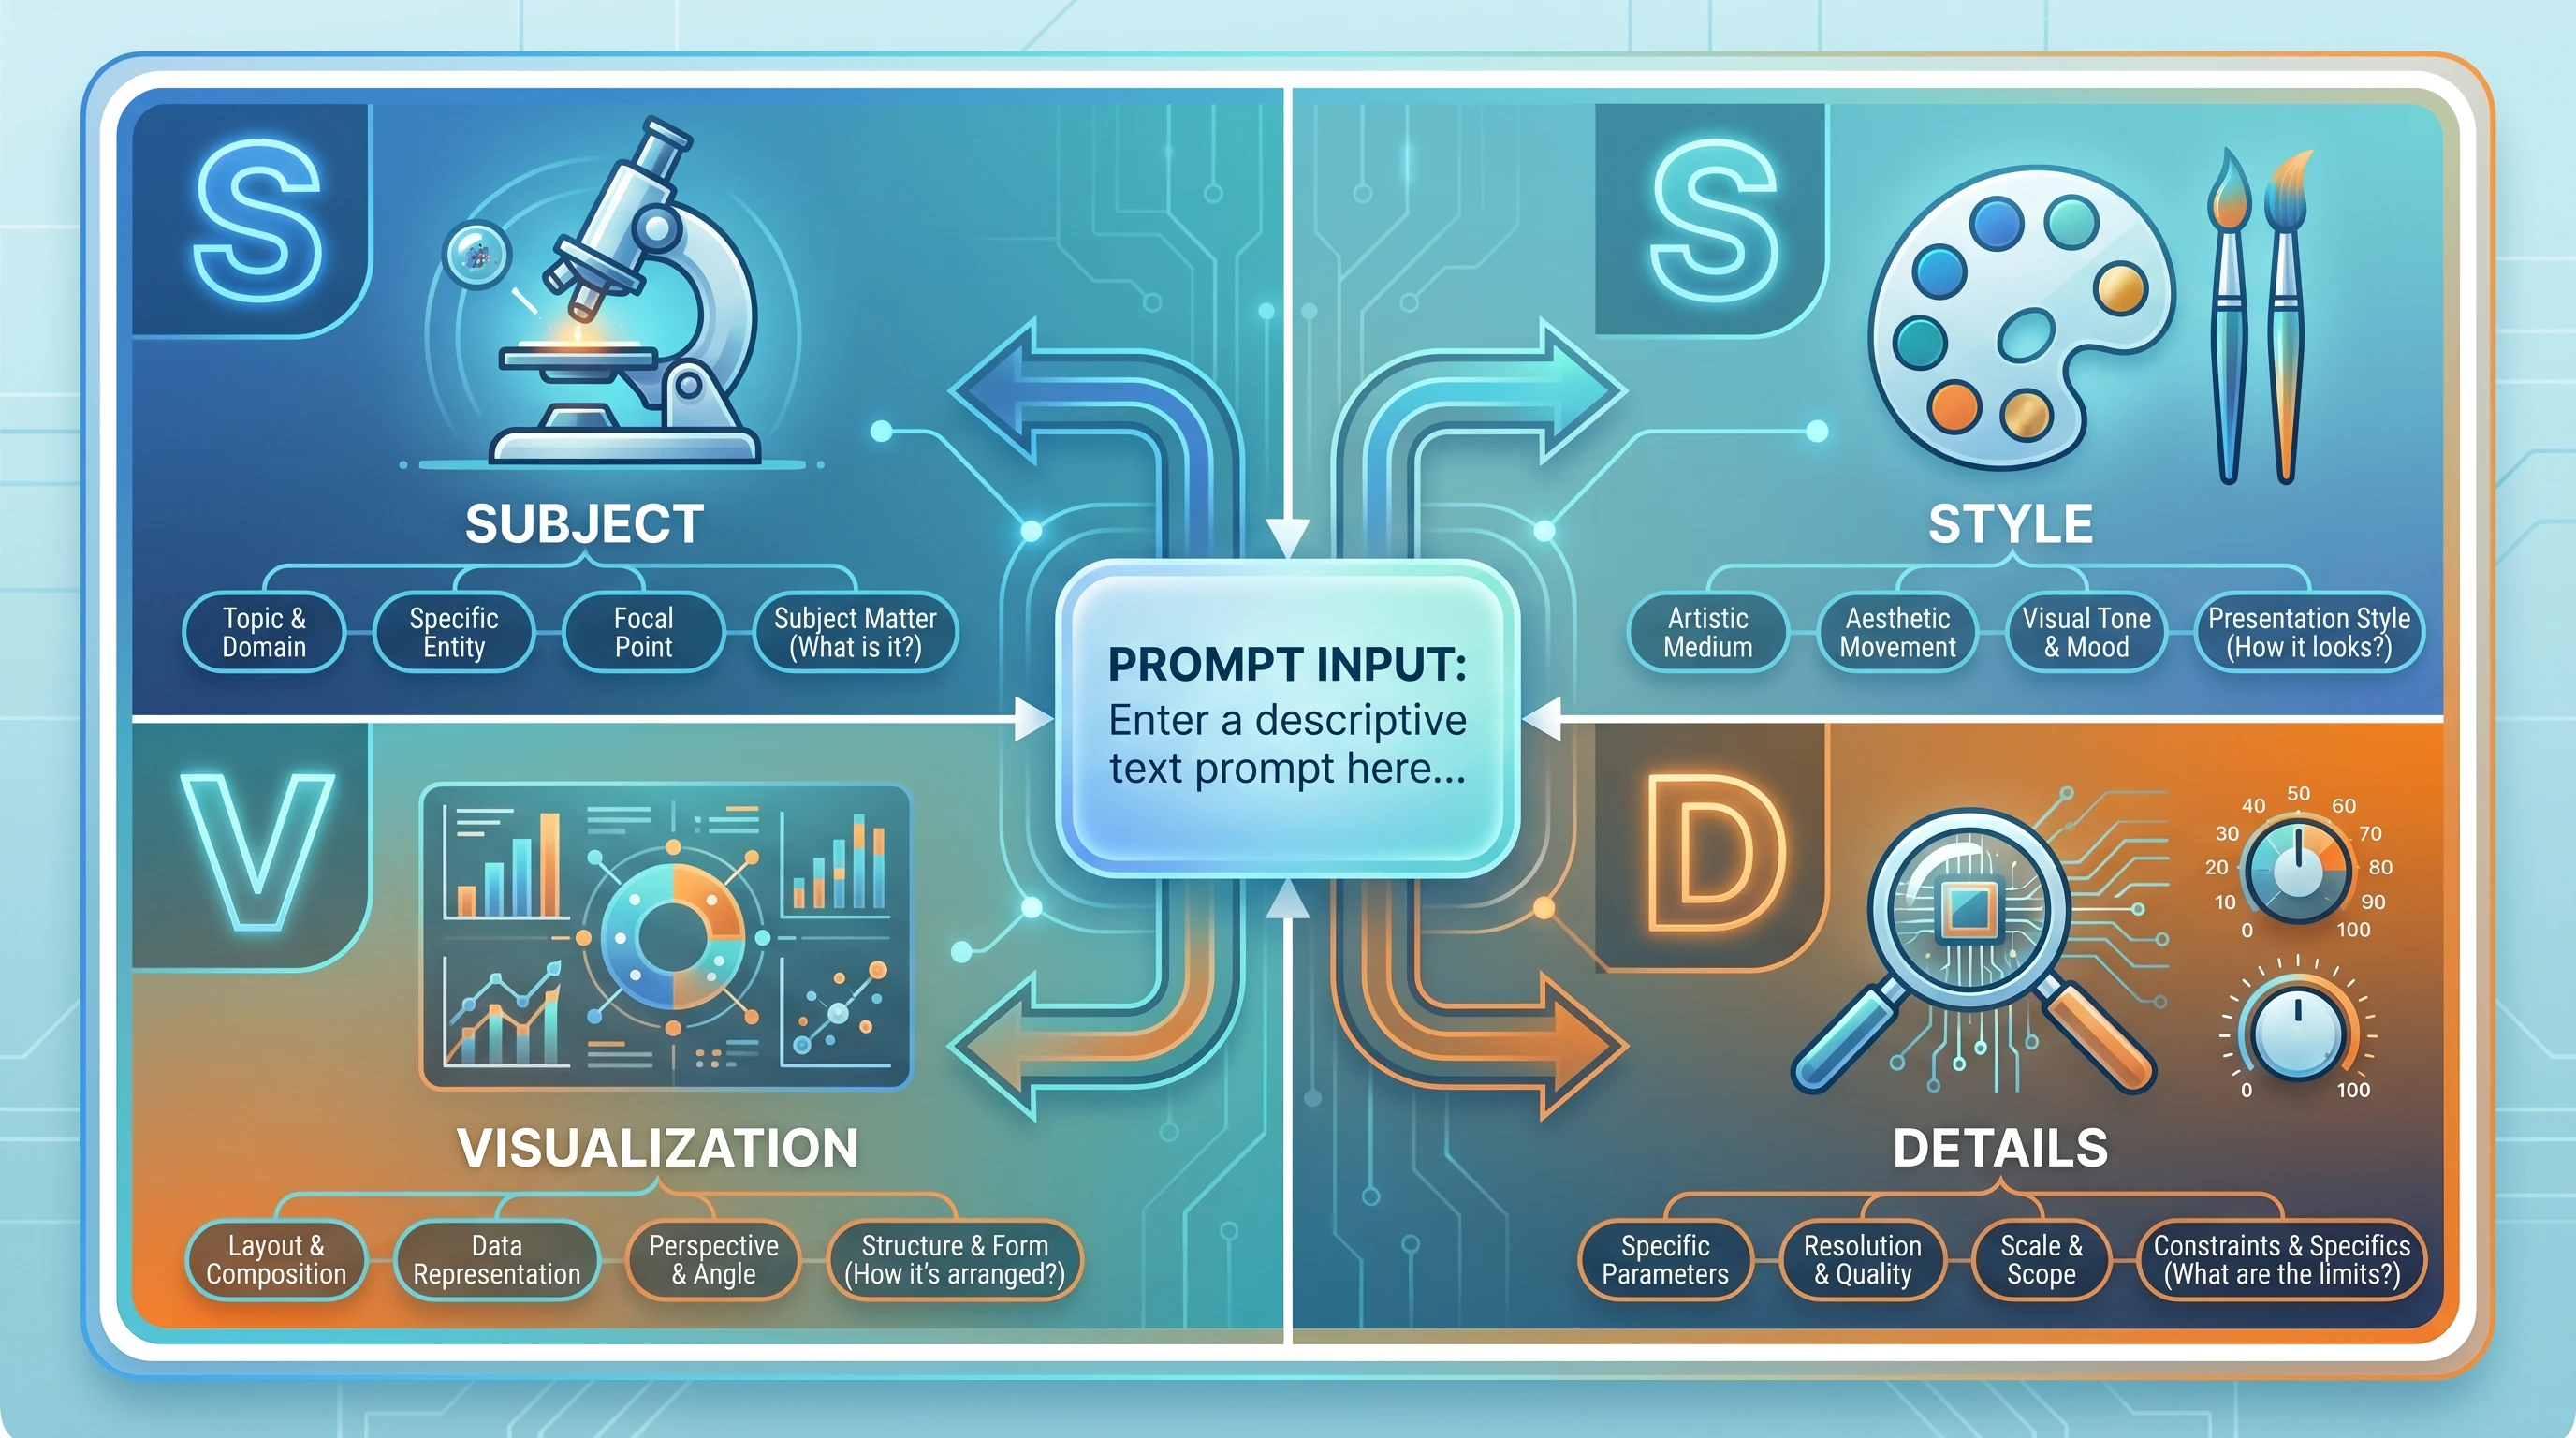
- S — Subject: What biological, chemical, or physical system are you depicting? Name the specific molecules, structures, or entities involved, using standard nomenclature (HGNC gene symbols, IUPAC names, anatomical terms).
- S — Structure: How should the elements be spatially arranged? Which components are upstream or downstream? What relationships — hierarchical, sequential, branching — need to be communicated?
- V — Visual Style: What color scheme, line weight, label style, and aesthetic conventions apply? Should it read like a Nature methods figure or a teaching illustration? (Avoid these common style mistakes.)
- D — Detail Level: What should the model include, and what should it leave out? More is not always better — a busy figure obscures the message.
| Dimension | Question to Answer | Example |
|---|---|---|
| S — Subject | What system or concept? | NF-κB signaling pathway |
| S — Structure | How are elements arranged? | Linear cascade, left to right |
| V — Visual Style | What aesthetic? | Clean vector, Nature-style |
| D — Detail Level | What to include/exclude? | Key proteins only, no cofactors |
Think of S.S.V.D. as a checklist you run through before submitting any prompt. A prompt that covers all four dimensions consistently outperforms one that addresses only one or two. The time investment is minimal — adding these details rarely takes more than thirty seconds — and the reduction in revision cycles is dramatic.
Here is the same request written two ways:
The second prompt requires perhaps forty additional words. It will save you two or three revision cycles.
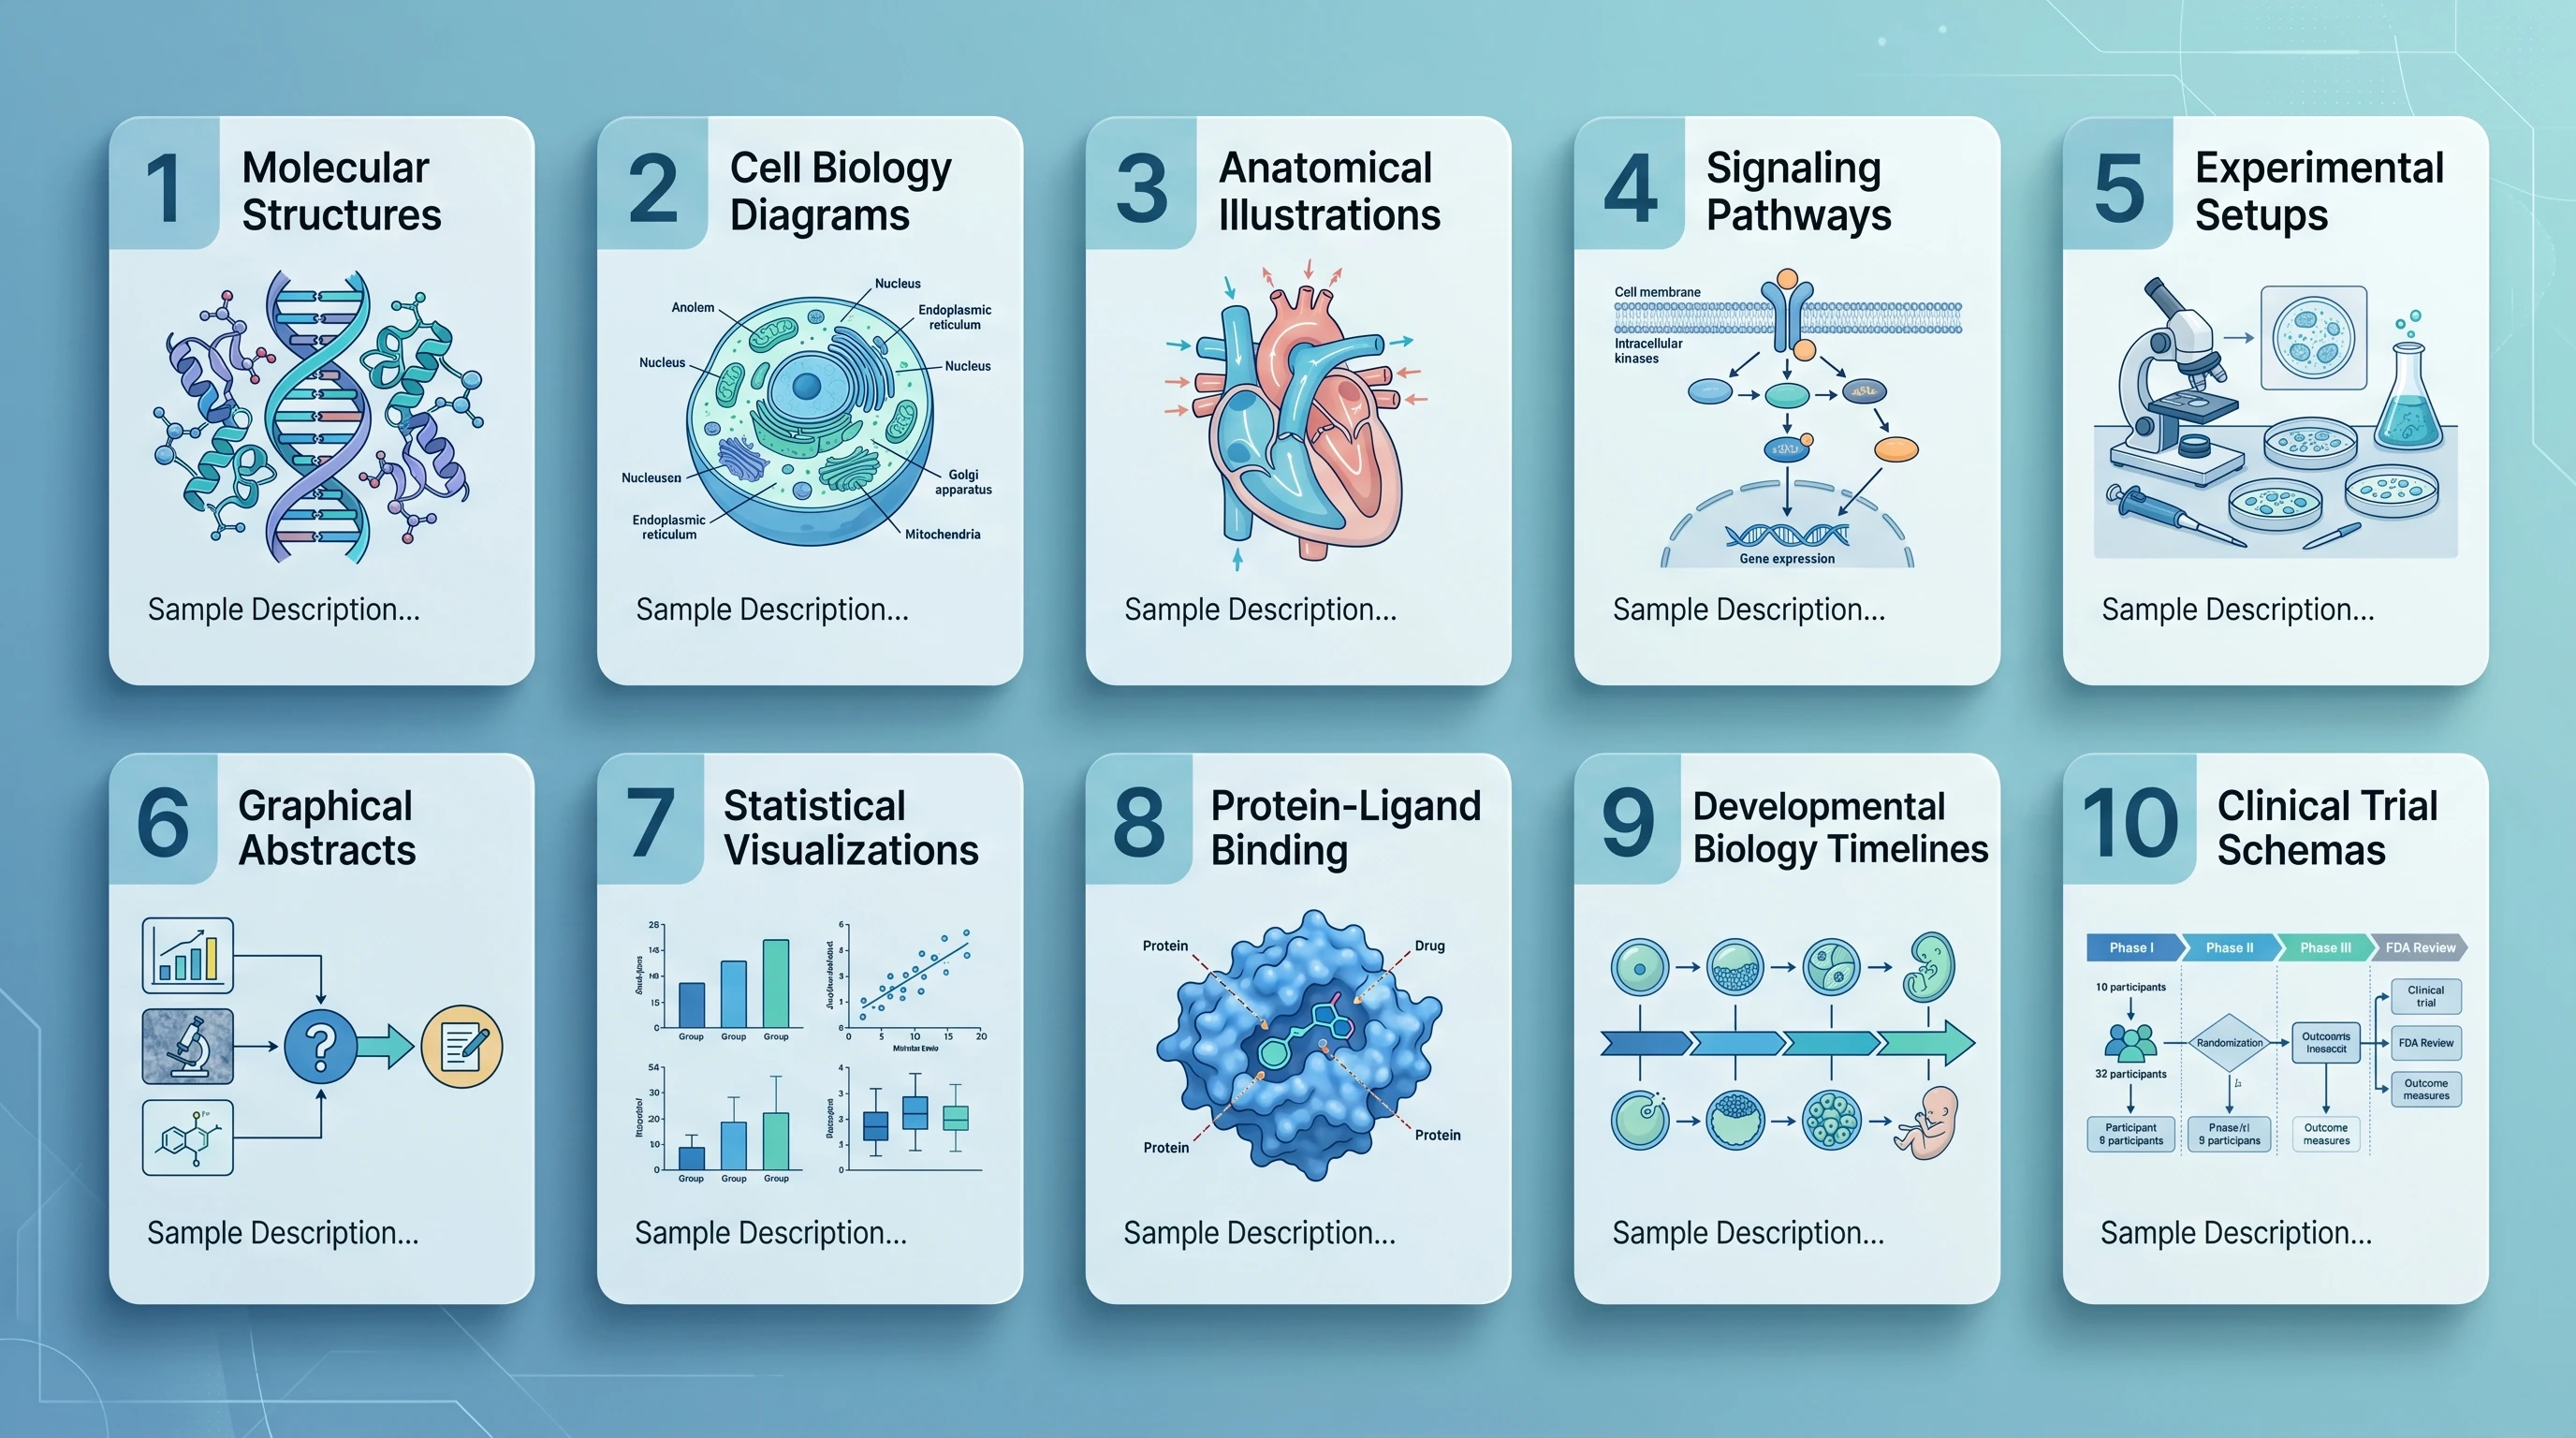
10 Ready-to-Use Prompt Templates
The following templates are designed to be copied, modified, and submitted directly. Replace the bracketed placeholders with your specific molecules, organisms, or experimental details.
1. Cell Signaling Pathway
"Create a publication-ready cell signaling pathway diagram illustrating [pathway name, e.g., PI3K/AKT/mTOR]. Begin at the receptor ([receptor name]) at the plasma membrane and trace signal propagation through [key intermediates] to downstream effectors [transcription factors or functional outputs]. Use distinct arrow styles for phosphorylation (circled P), ubiquitination (circled Ub), and translocation events. Apply a white background with a two-color scheme ([primary color] for active components, grey for inactive). Label all proteins with their standard HGNC symbols. Include subcellular compartment labels (plasma membrane, cytoplasm, nucleus)."
2. Protein Structure Diagram
"Generate a schematic diagram of [protein name] domain architecture. Show the following domains from N-terminus to C-terminus: [list domains with approximate residue ranges, e.g., PH domain (aa 1–100), kinase domain (aa 150–400), regulatory C-tail (aa 401–480)]. Indicate known post-translational modification sites: phosphorylation at [residue numbers], ubiquitination at [residue numbers]. Use color-coded blocks for each domain with a consistent legend. Include a linear scale bar. Style: clean academic illustration suitable for a review article figure panel."
3. Experimental Workflow / Protocol
"Create a step-by-step experimental workflow diagram for [protocol name, e.g., chromatin immunoprecipitation followed by sequencing (ChIP-seq)]. Depict the following sequential steps: [list steps in order]. Use rectangular boxes connected by downward arrows for each step. Inside each box, include the step name in bold and a one-line procedural note. Use [color] to highlight critical quality-control checkpoints at steps [numbers]. Apply a clean white background with light grey box fills and black text. Add estimated time annotations on the right margin."
4. Organ / Tissue Cross-Section
"Illustrate a labeled cross-sectional diagram of [organ or tissue, e.g., human kidney cortex at the cellular level]. Show the following cellular layers and structures: [list layers/structures]. Use a naturalistic color palette ([skin/tissue tones]). Include leader lines with anatomical labels in a clean sans-serif font positioned outside the illustration boundary. Add a scale bar indicating [dimension]. Style should be suitable for a medical journal or textbook — scientifically accurate, not stylized."
5. Chemical Reaction Mechanism
"Draw a step-by-step organic reaction mechanism for [reaction name, e.g., serine protease-catalyzed peptide bond hydrolysis]. Show all intermediates: [list intermediates]. Use standard curved-arrow notation for electron movement. Label nucleophilic, electrophilic, and leaving-group species. Display partial charges (δ+ and δ−) at transition states. Arrange steps left-to-right in a single horizontal sequence. Use black structures on a white background. Include compound labels below each structure and reaction condition labels (pH, temperature) above each arrow."
6. Nanoparticle Drug Delivery System
"Create a scientific illustration of a [type of nanoparticle, e.g., lipid nanoparticle] drug delivery system for [therapeutic application, e.g., siRNA delivery to hepatocytes]. Depict the nanoparticle cross-section showing: outer PEG corona, lipid bilayer shell, aqueous core containing [cargo]. Show the delivery sequence in four panels: (1) systemic circulation, (2) receptor-mediated endocytosis at the target cell, (3) endosomal escape, (4) intracellular cargo release. Use a consistent color scheme: [color] for the particle, [color] for the biological membranes. Label all components. Include a particle size scale (~[diameter] nm) in the first panel."
7. Gene Expression Cascade
"Illustrate the gene expression cascade from extracellular signal to protein output for [signaling context, e.g., interferon-γ stimulation of macrophages]. Show the sequential steps: ligand binding → receptor activation → JAK kinase phosphorylation → STAT transcription factor dimerization → nuclear import → promoter binding at [target gene loci] → mRNA transcription → cytoplasmic translation → functional protein. Arrange vertically from extracellular space (top) to cytoplasm (bottom). Use dashed boxes to delineate nuclear events. Apply a blue-to-orange gradient to indicate signal progression. Label all molecular players."
8. Microscopy Comparison Panel
"Create a multi-panel scientific comparison figure with [N] panels showing [experimental conditions, e.g., control, treatment A, treatment B, treatment C]. Each panel should simulate a [microscopy type, e.g., confocal fluorescence] field with the following channels: [channel 1 color], [channel 2 color], merge. Include: a 10 µm scale bar in the bottom-right of each panel; consistent brightness/contrast across conditions; panel labels (A, B, C, D) in white text, upper-left corner. Add a single-row annotation below each panel indicating the key phenotypic feature. Style: black background for fluorescence panels, clean academic layout."
9. Clinical Trial Design Flowchart
"Design a CONSORT-style clinical trial flowchart for a [trial type, e.g., phase III randomized controlled trial] studying [intervention] in [patient population]. Show: enrollment and eligibility screening (n = [number]); randomization with allocation ratios; [number] intervention arms with arm labels and dosing; follow-up time points at [weeks/months]; primary and secondary endpoint assessment; dropout/loss-to-follow-up at each stage. Use standard flowchart boxes (rectangles for processes, diamonds for decisions). Apply a clean white background with [color] shading for the intervention arms. Include placeholder n-values at each node."
10. Ecosystem Interaction Diagram
"Create a scientific ecosystem interaction diagram for [ecosystem or community, e.g., coral reef trophic network]. Show [N] key species or functional groups: [list species]. Represent trophic interactions with directed arrows (arrow points to consumer). Distinguish interaction types: predation (solid lines), mutualism (dashed lines), competition (double-headed lines). Size nodes proportional to biomass [or trophic level]. Use a consistent species color scheme from primary producers (green) to apex predators (red). Position nodes to reflect trophic levels vertically. Include a legend. Style: clean academic illustration with white background."
See AI Scientific Figure Generation in Action
Watch how researchers create publication-ready scientific figures from text descriptions.
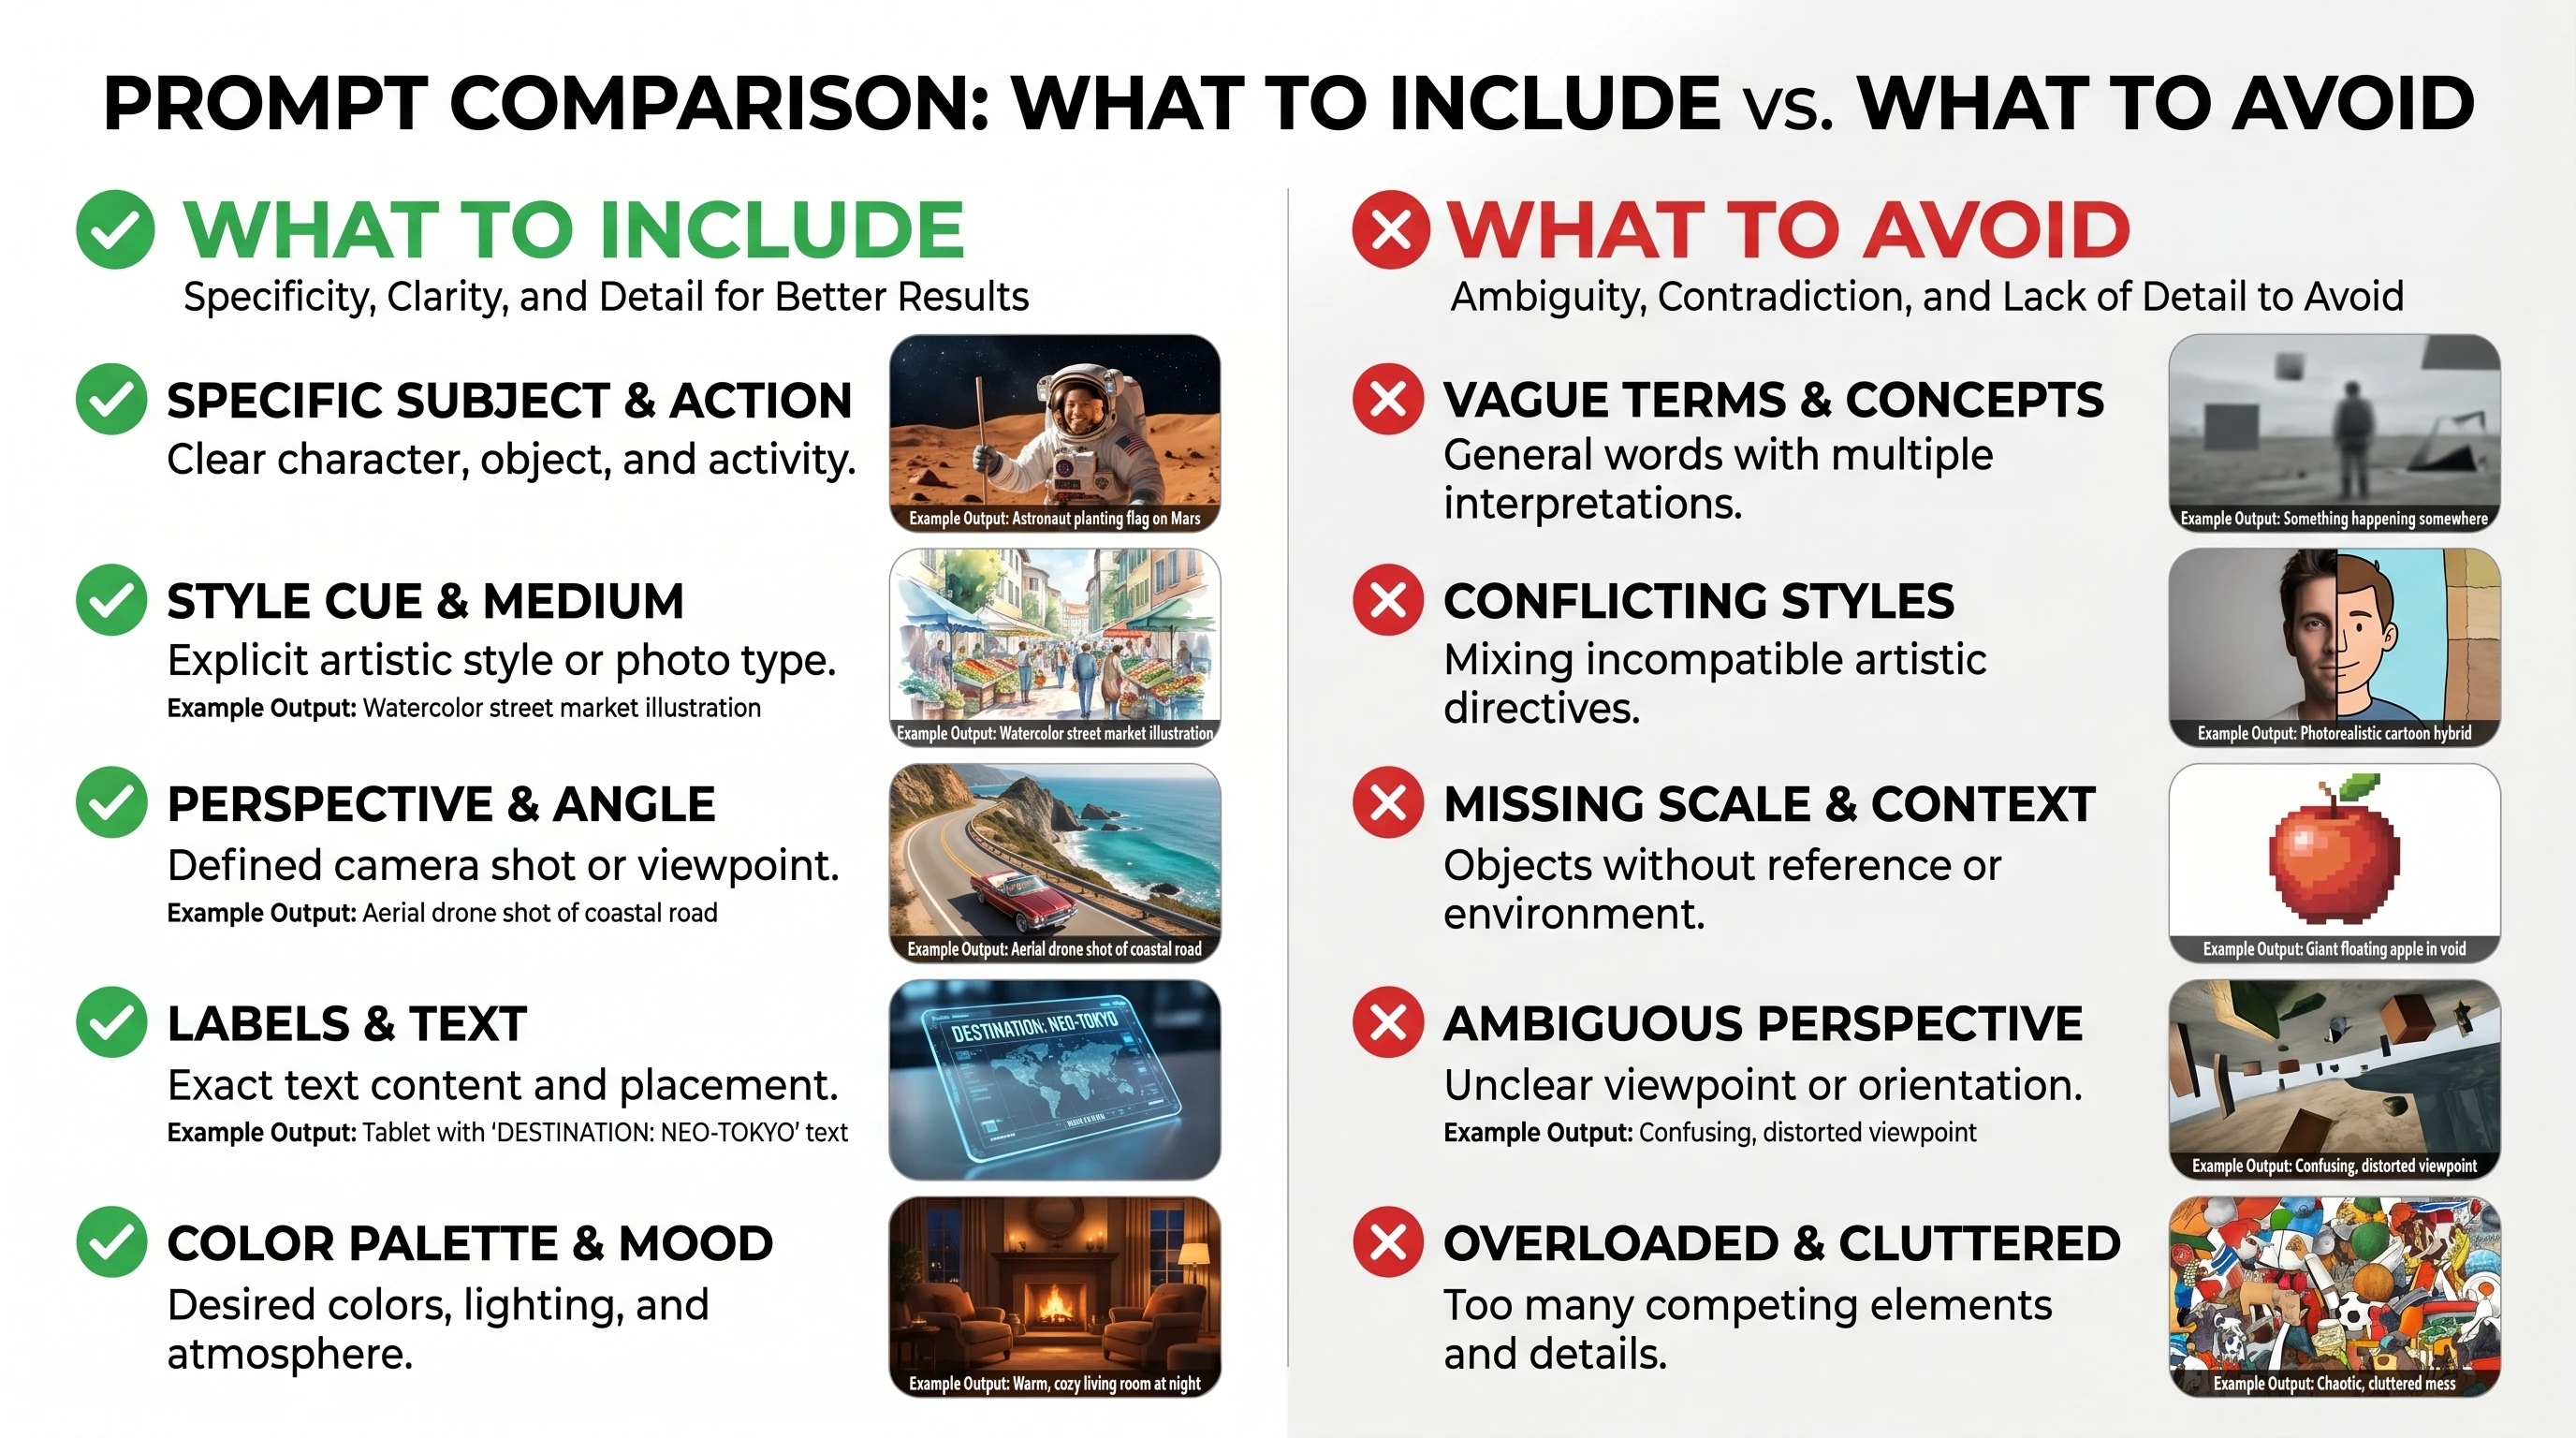
Explore the ToolCommon Prompt Mistakes (And How to Fix Them)
Even researchers familiar with AI tools like SciFig fall into a handful of predictable traps. Recognizing these patterns lets you self-correct before submitting.
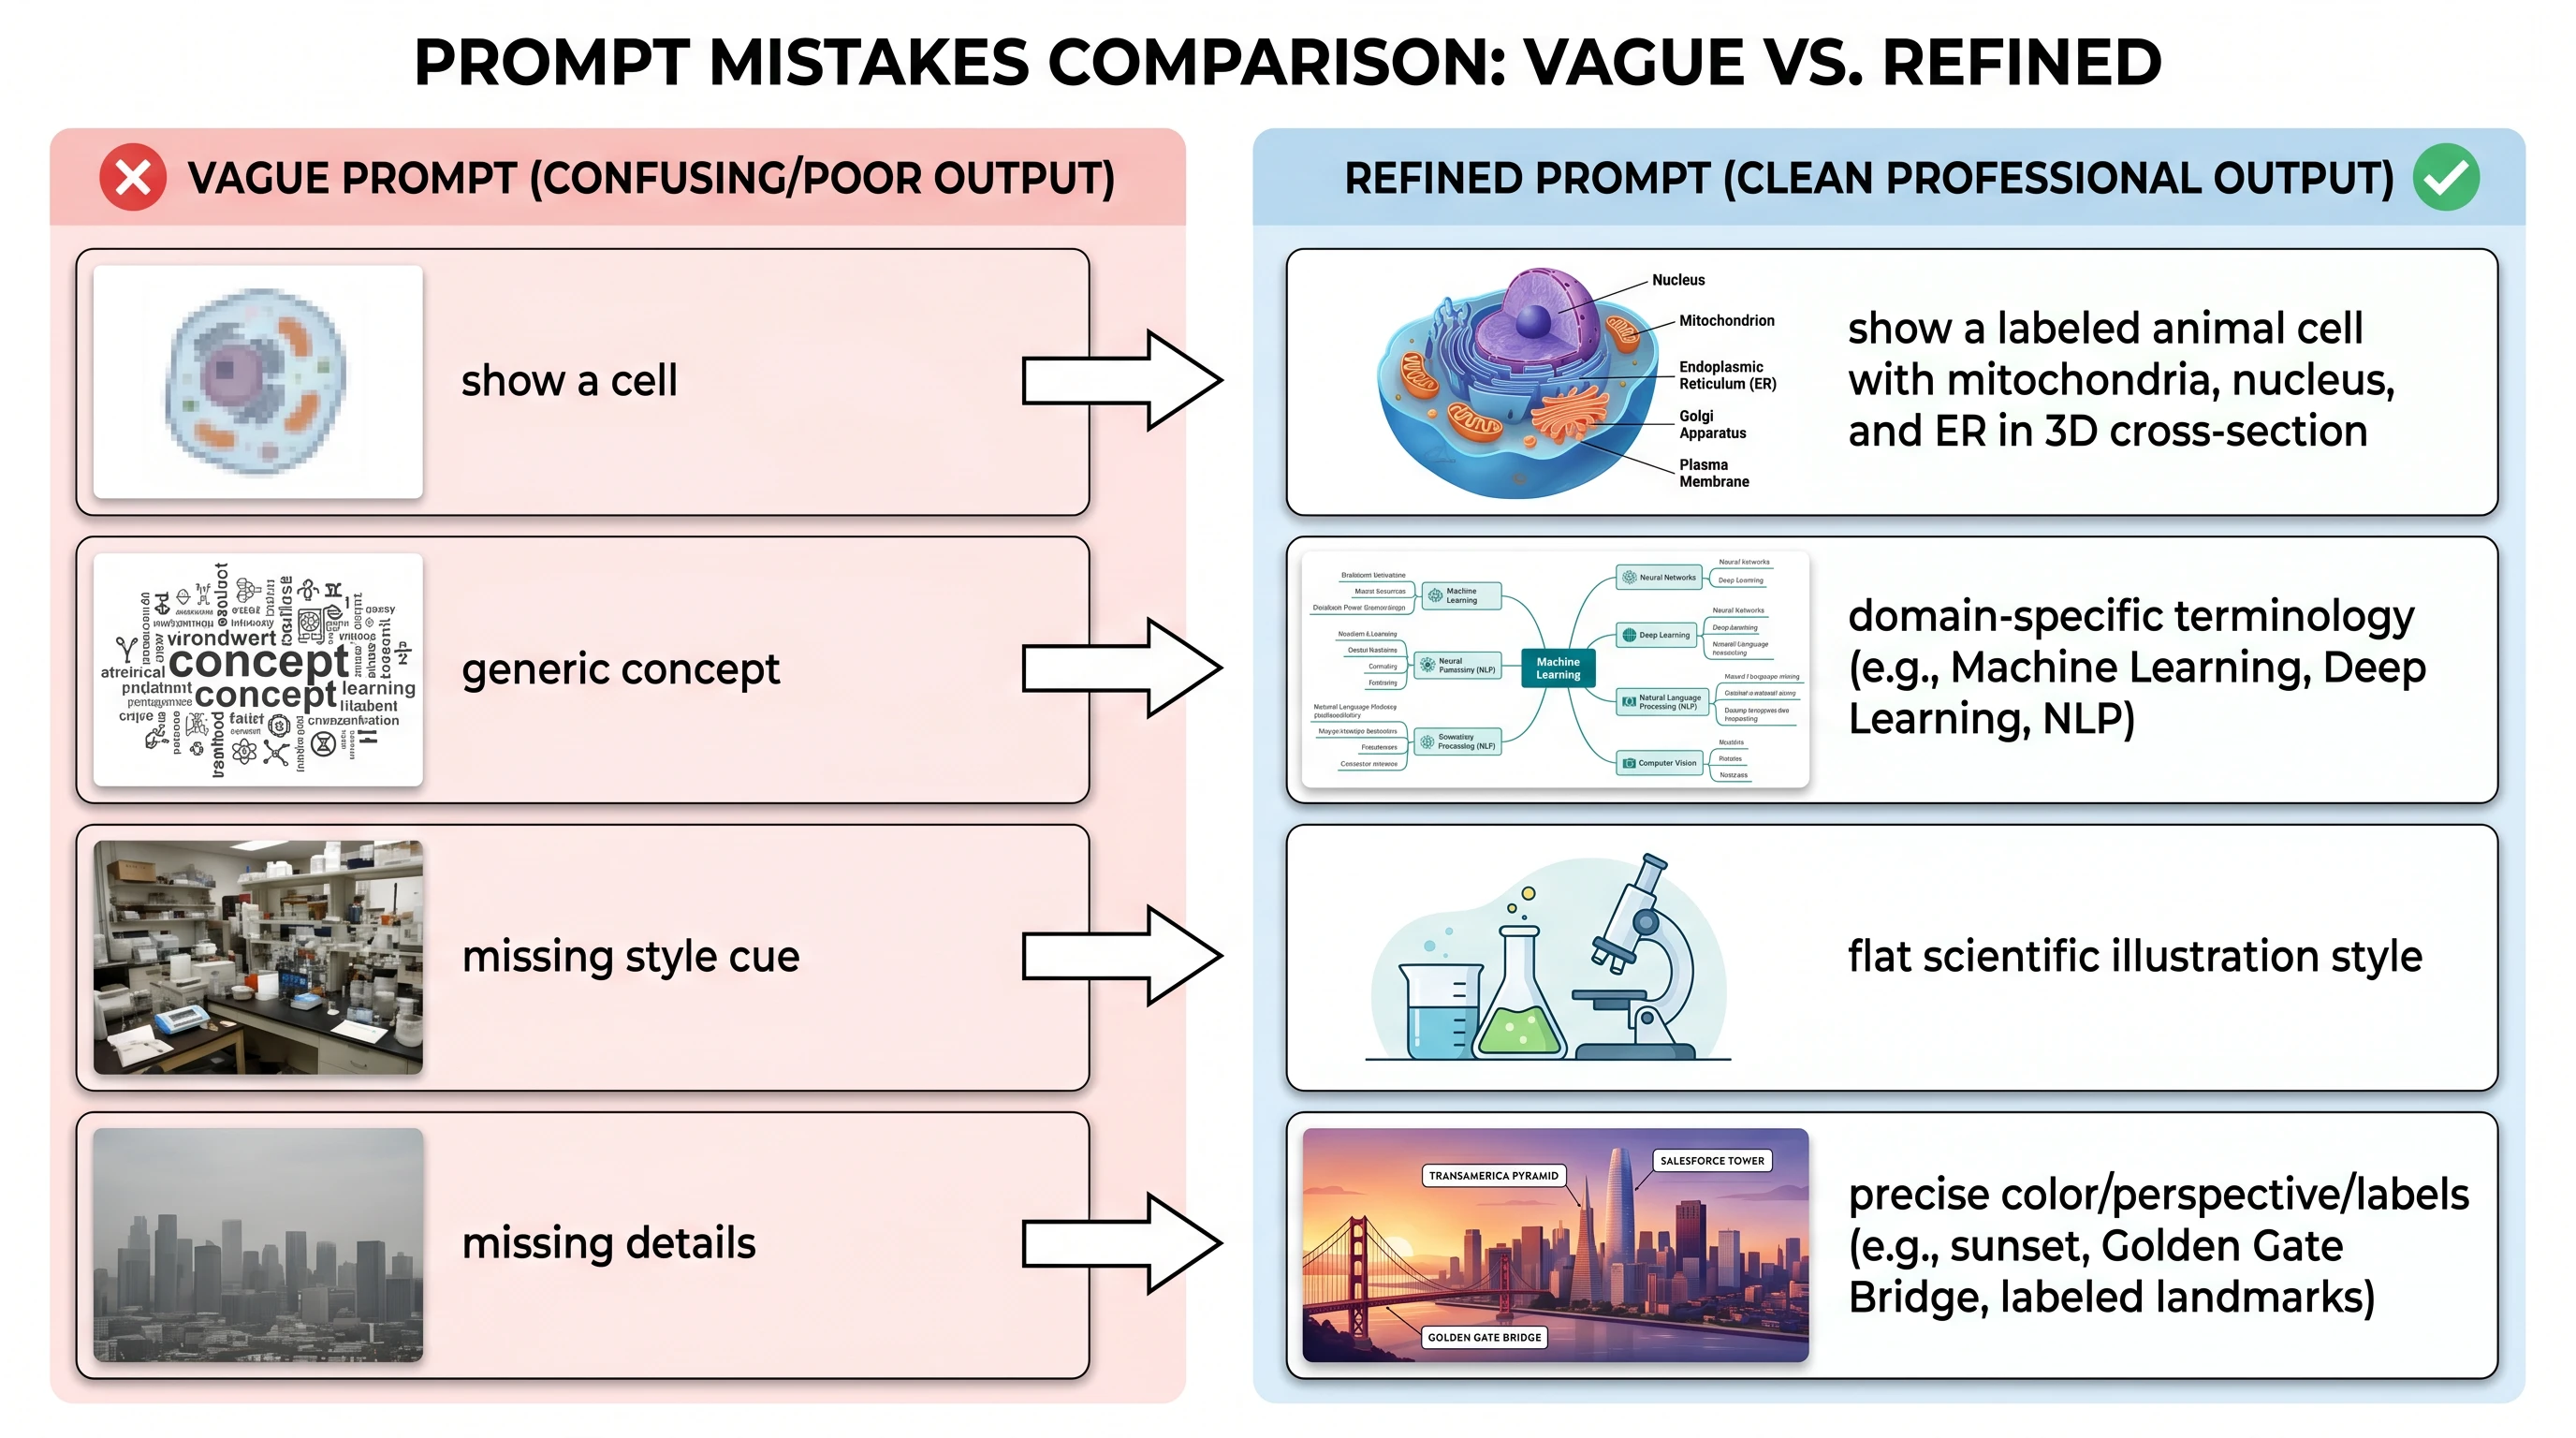
Mistake 1: Using generic category names instead of specific identifiers
Mistake 2: Forgetting spatial and relational context
Mistake 3: Leaving visual style undefined
Mistake 4: Requesting too much in a single prompt
Then iterate: "Add the ERK-mediated negative feedback phosphorylation of SOS at Ser1132."
Mistake 5: Omitting output constraints
Advanced Techniques: Iterative Refinement
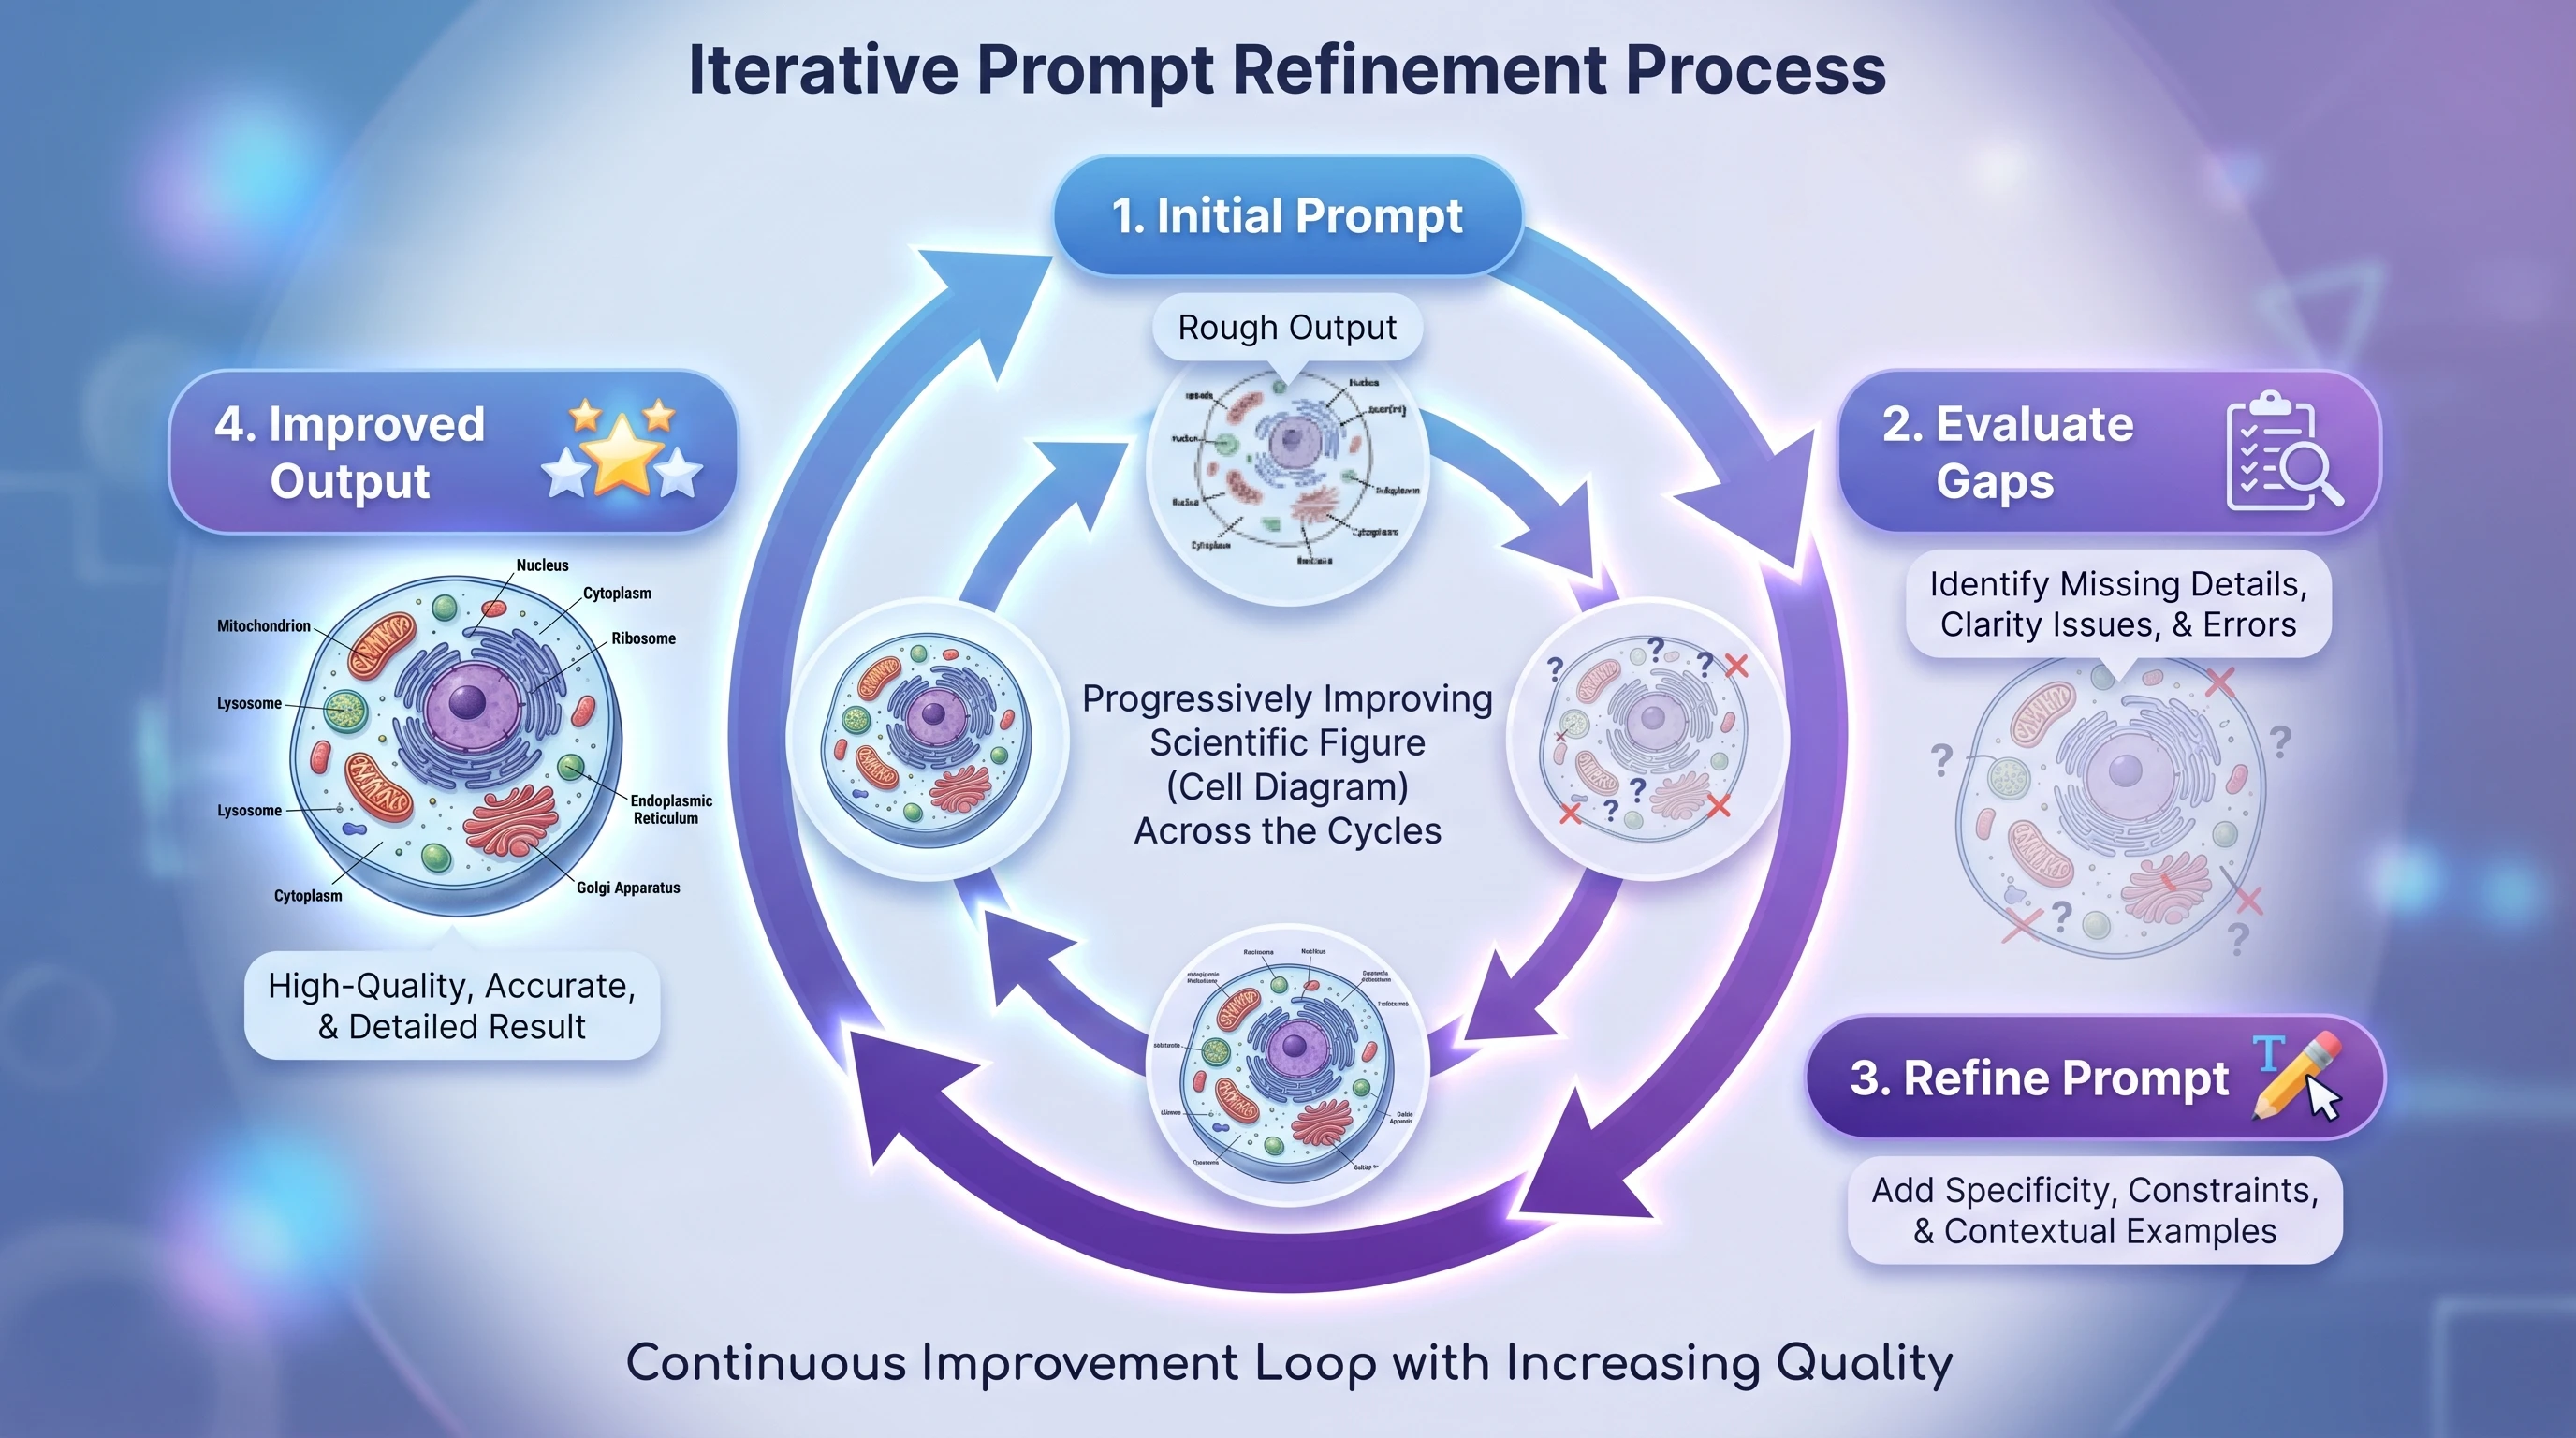
The workflow has four stages:
This staged approach is faster than trying to specify everything in round one, because early stages run quickly and confirm that the conceptual structure is correct before you invest time in visual details. If Stage 1 reveals that the model's understanding of a pathway is incomplete, you can correct it cheaply with a targeted addition — rather than discovering the problem after investing twenty minutes in prompt engineering.
Create Scientific Figures Now
Describe your scientific figure in natural language — get publication-ready illustrations in minutes.
Try FreeTip
The single highest-impact prompt improvement you can make is replacing generic category terms with specific molecular identifiers. Switching from "a receptor tyrosine kinase" to "EGFR (HER1)" — four words — typically improves output accuracy more than doubling the total prompt length. When in doubt, be specific about the molecules first, then worry about style.