How AI text-to-figure converts natural language descriptions into publication-ready scientific illustrations across biology, chemistry, physics.
SciFig Team
Scientific Illustration Experts
You have been staring at your screen for three hours. The scientific figure you need — a clean, labeled diagram showing how a G-protein-coupled receptor activates adenylyl cyclase — is still a blank canvas. You have spent forty minutes searching a clipart library for a passable adenylyl cyclase icon, dragged nine boxes around trying to establish spatial logic, and repositioned the same phosphorylation arrow twice after it kept snapping to the wrong anchor point. Your data is ready. Your discussion section is written. The only thing standing between you and a completed manuscript is a scientific figure that a competent designer could finish in twenty minutes.
This is where most researchers lose time — not in the experiment, but in the illustration. And it is where SciFig's AI text-to-figure technology is quietly rewriting the rules.
What Is Text-to-Figure Technology?
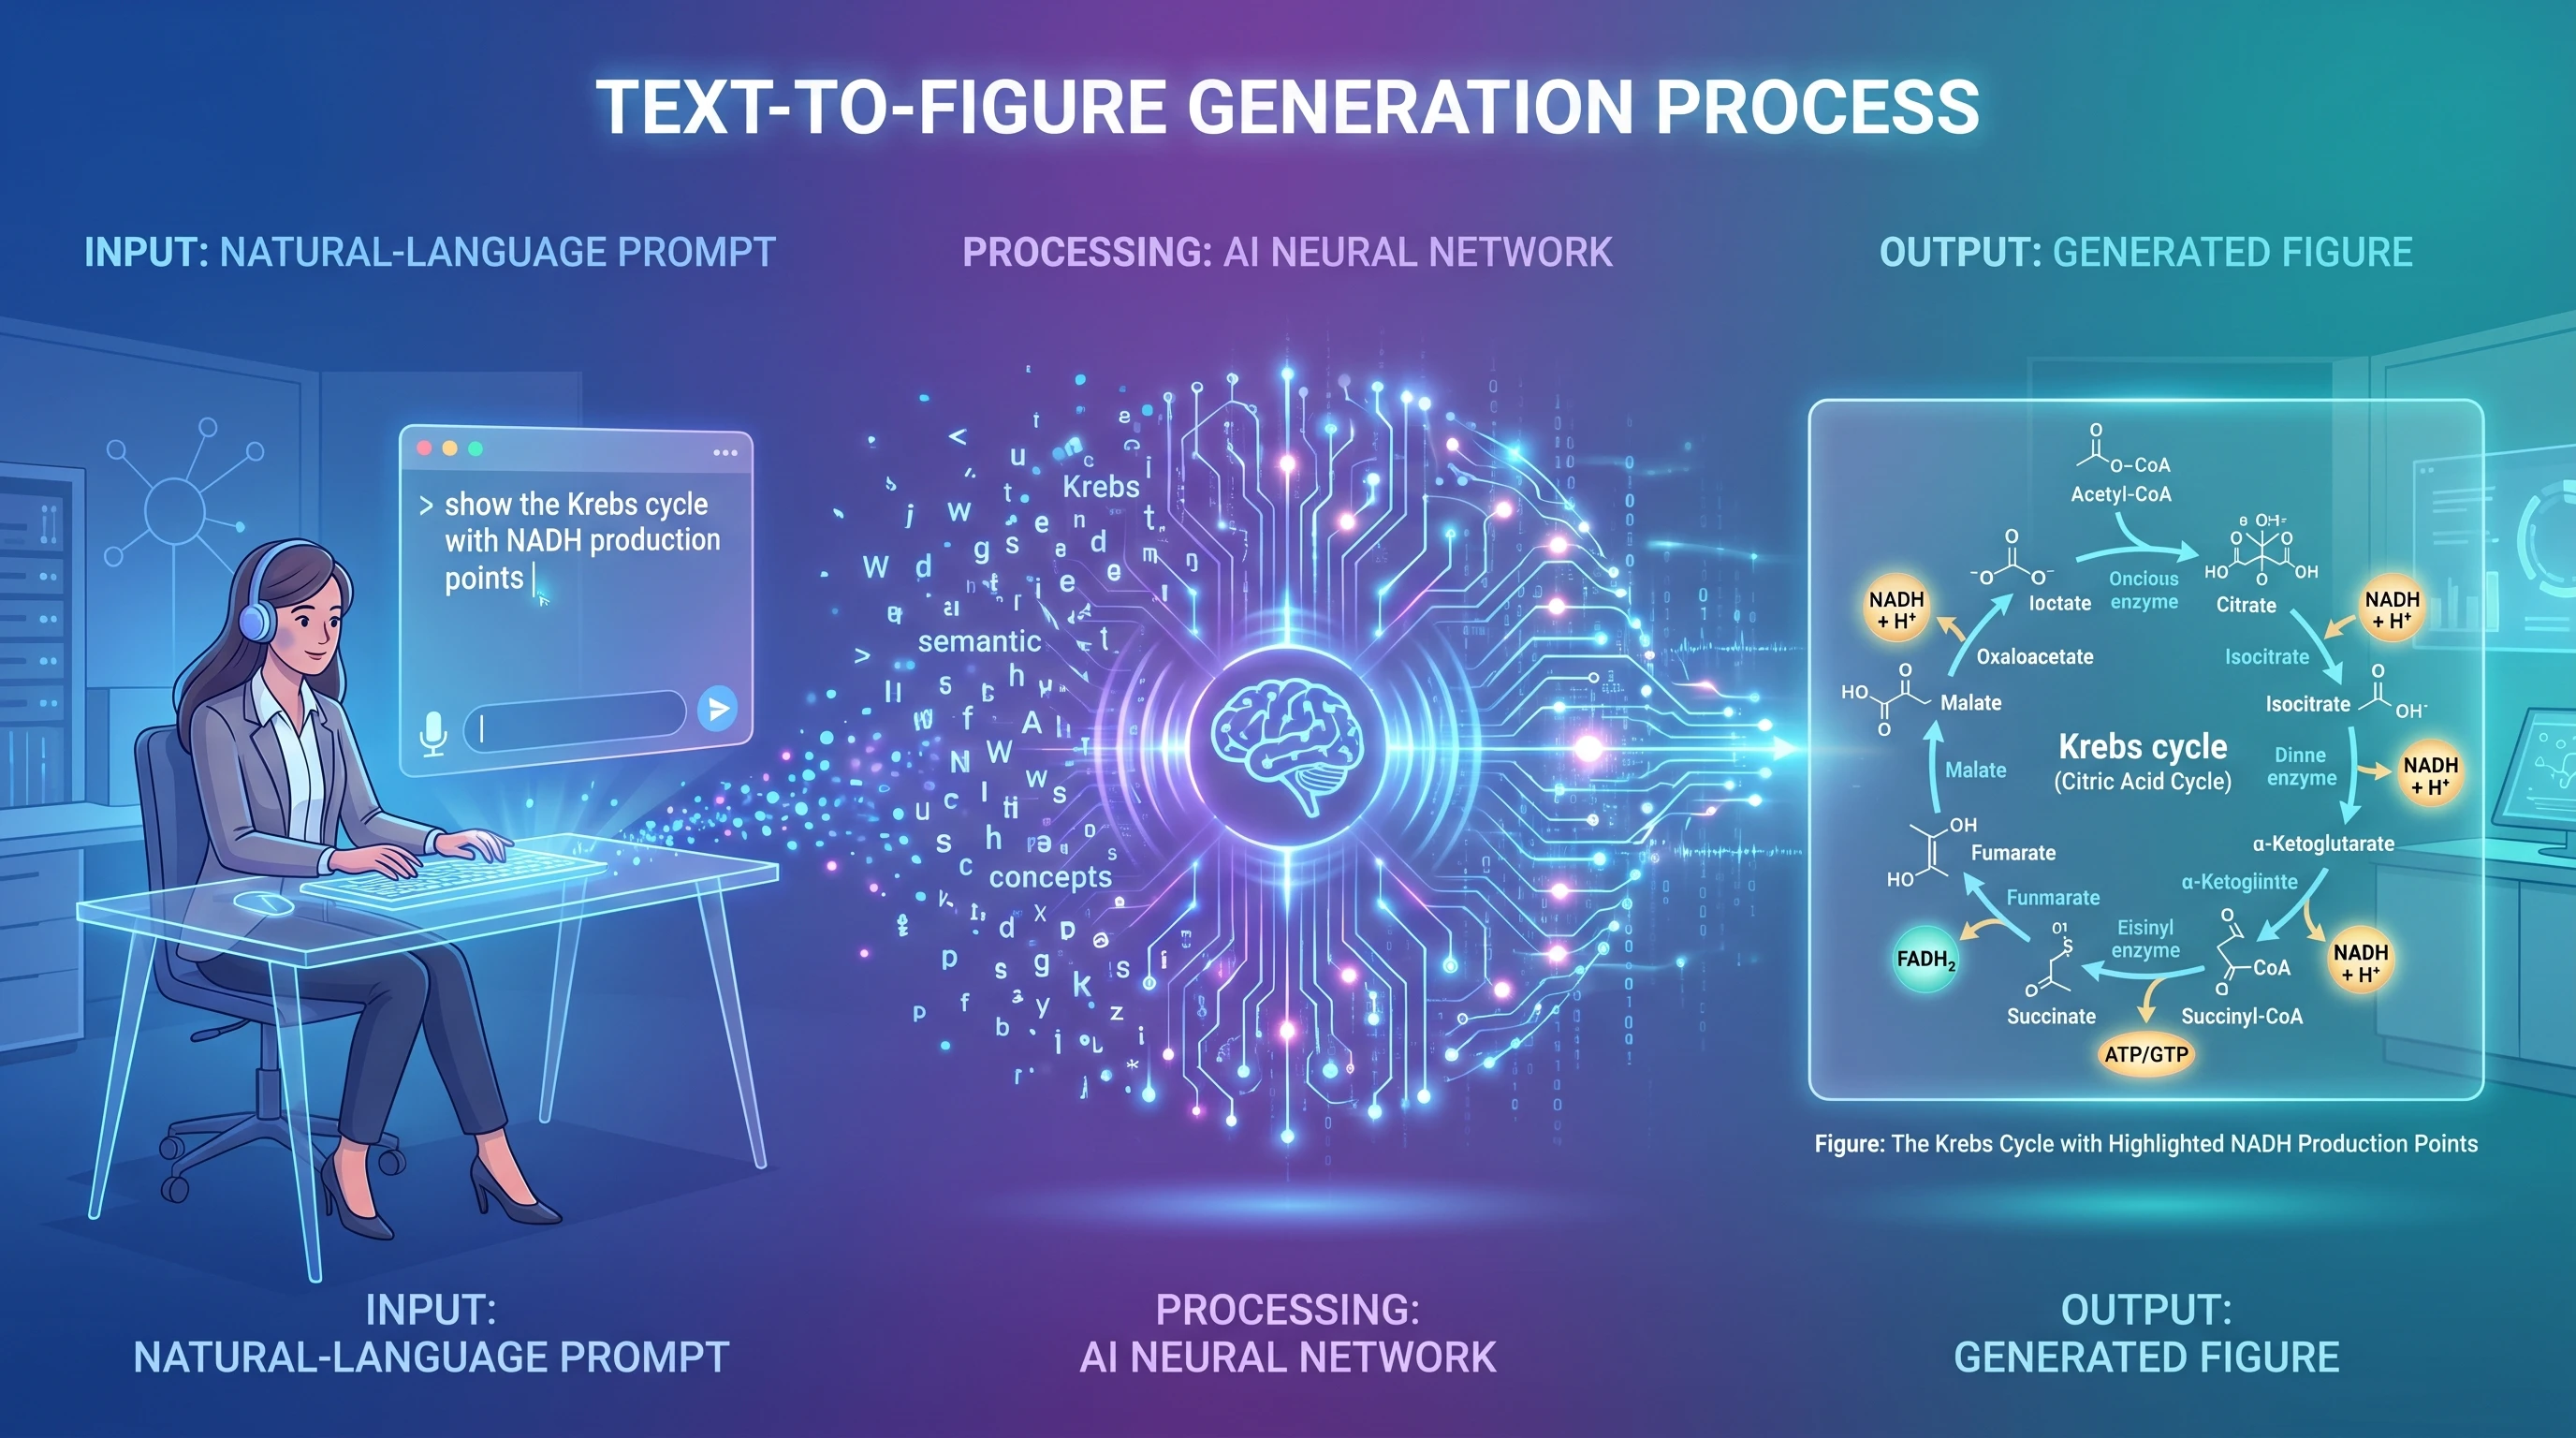
Text-to-figure is a class of AI that converts natural language descriptions into structured scientific diagrams. You write a sentence — or a paragraph — describing what you want to visualize, and a generative model interprets that description, constructs a layout, assembles the relevant visual components, and renders a publication-quality figure.
The underlying architecture combines large language models, which parse your scientific terminology and infer relationships between components, with image synthesis models trained specifically on scientific illustration conventions. The result is a system that understands not just what a "lipid bilayer" is, but that it should be rendered as two antiparallel phospholipid leaflets with hydrophilic heads facing outward — and that a transmembrane protein passing through it should span both layers with appropriate topology.
This is categorically different from a template library. A template library gives you pre-built components to arrange manually. Text-to-figure gives you a scientific figure.
The workflow is linear and fast: you describe what you need → the model interprets your scientific intent → it generates a complete layout with components and labels → you refine through additional prompts or direct editing → you export in your preferred format. The entire cycle from blank screen to draft figure can take under two minutes.
Why Traditional Tools Fall Short
The gap between what researchers need and what traditional illustration tools provide has always been significant. It has simply become more visible as publication standards have risen.
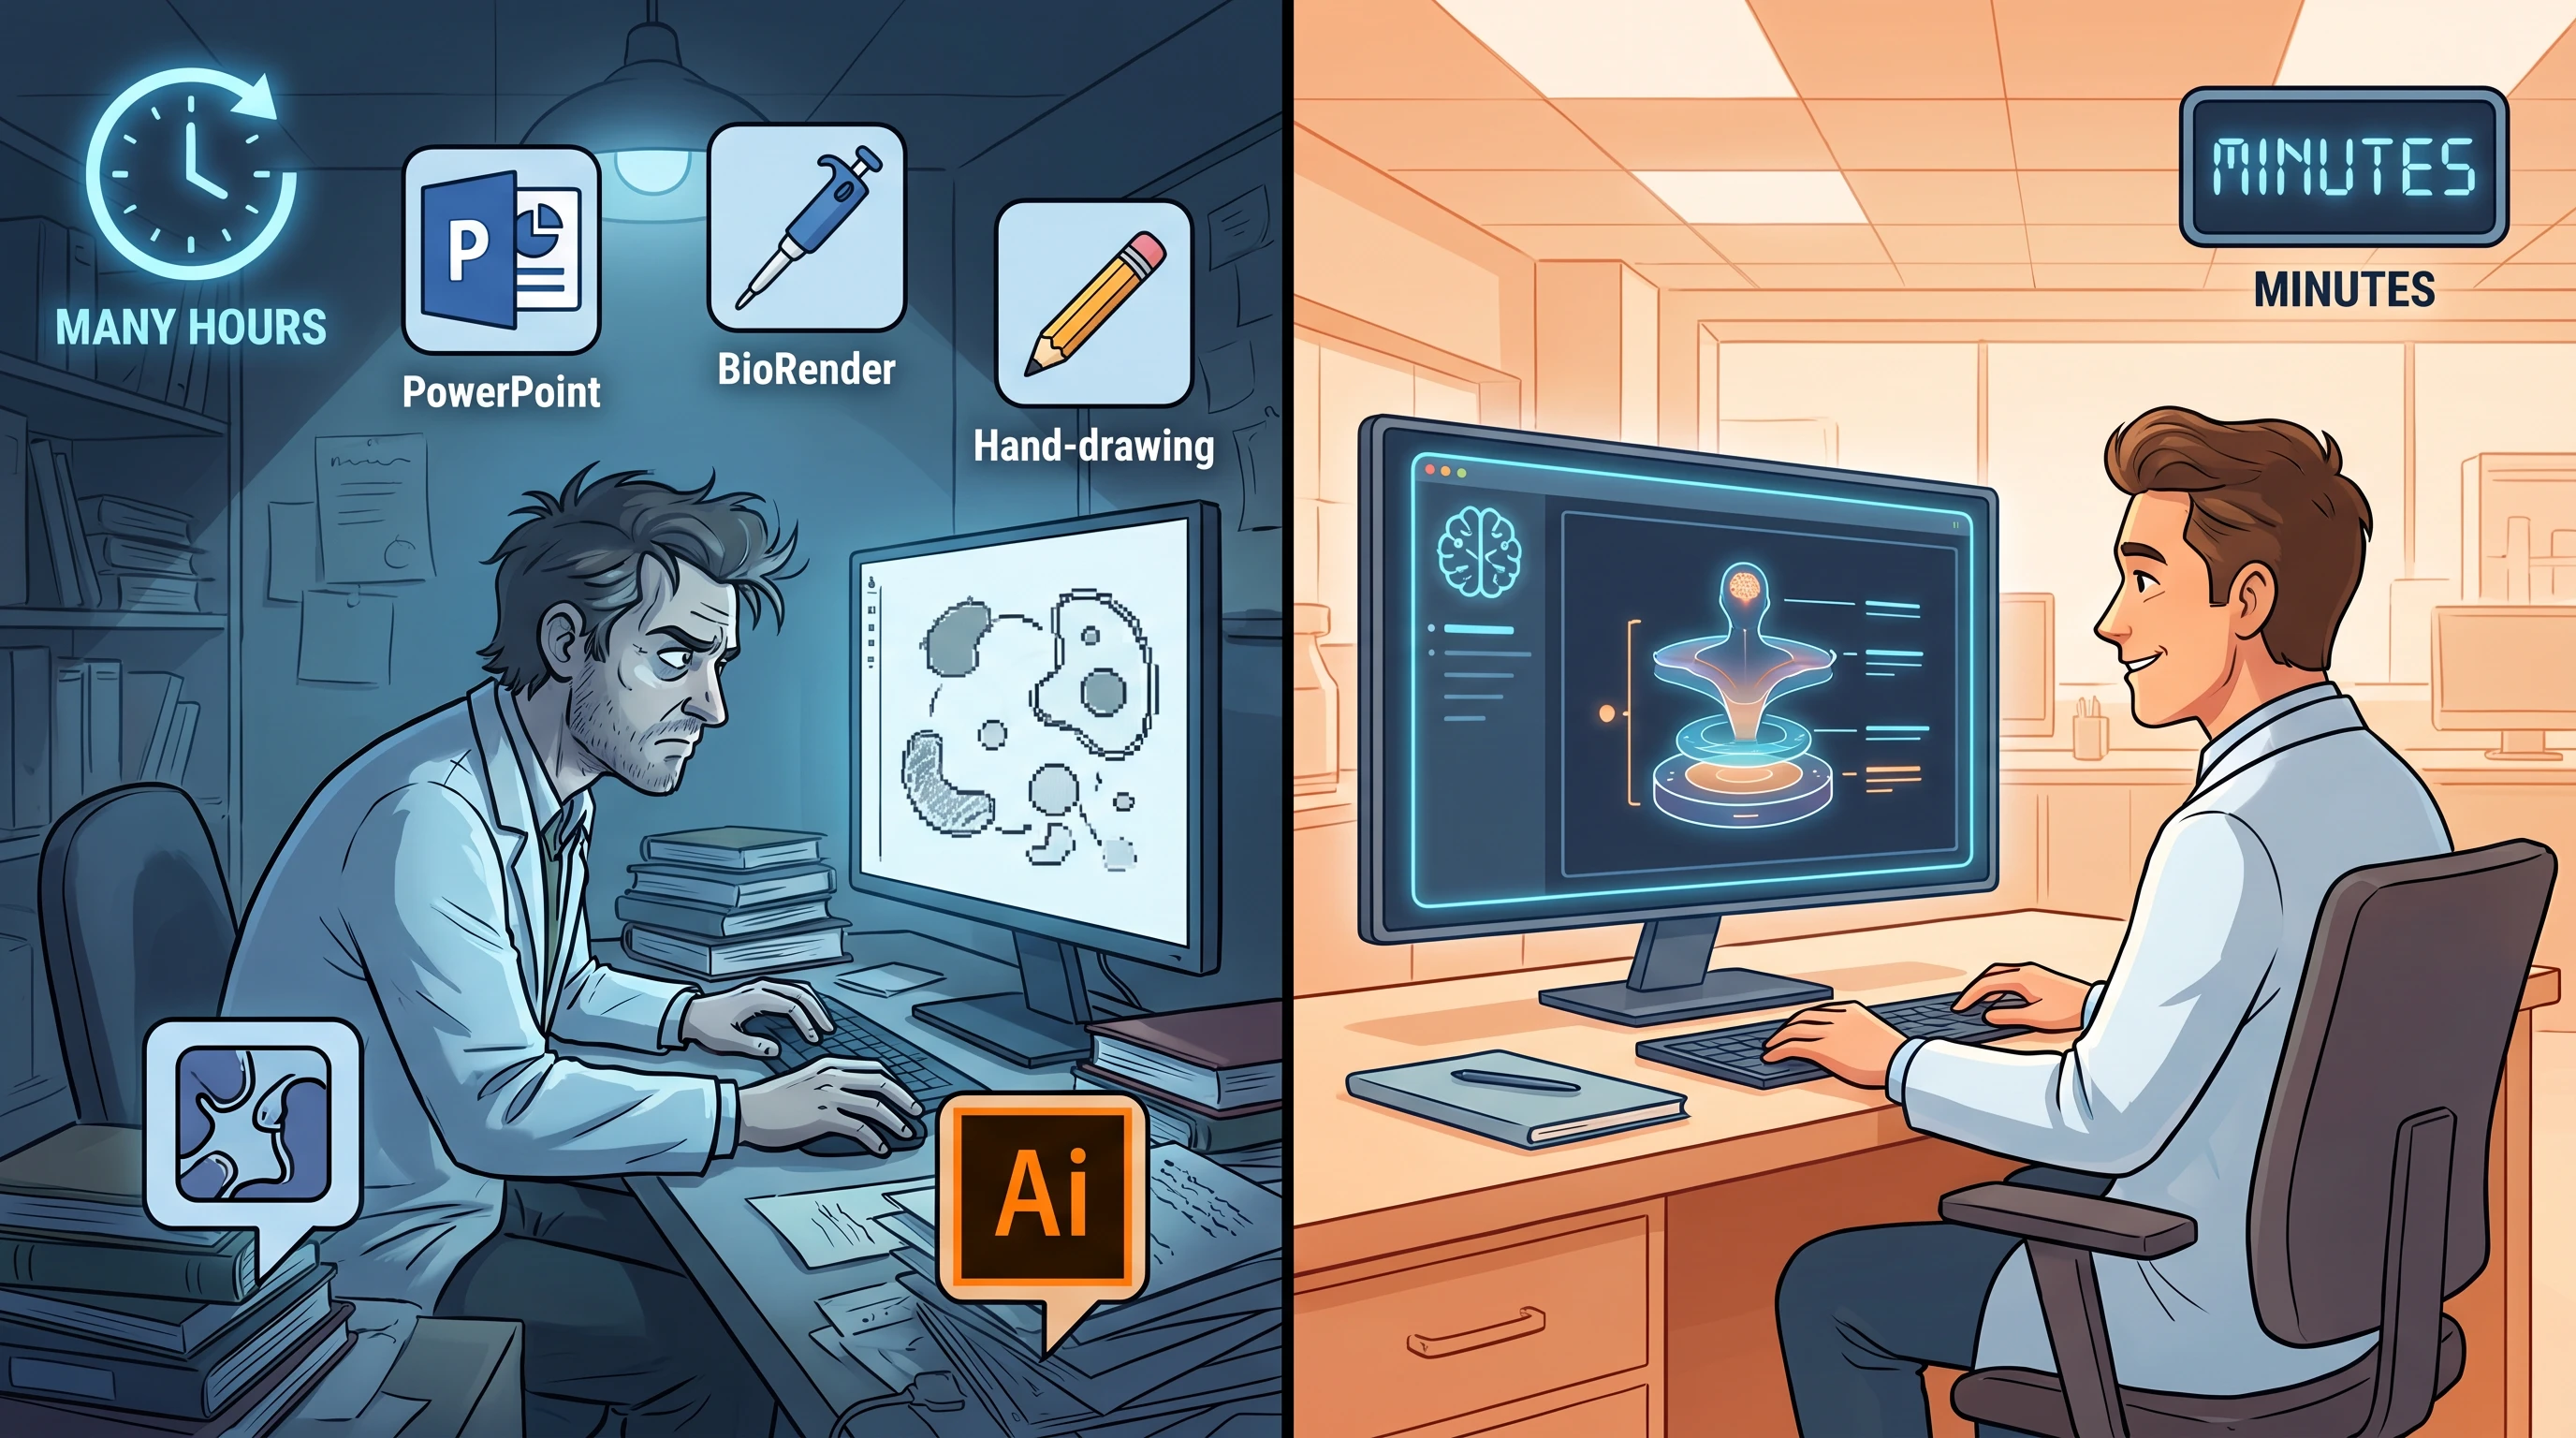
Traditional vs AI tools: frustrated researcher with 4 separate tools + unfinished diagram on left vs relaxed researcher with single AI + polished figure on right (Figure generated with SciFig)
Icon libraries are inherently finite. Biological databases like protein structure repositories contain hundreds of thousands of distinct molecules. No clipart library — regardless of how frequently it is updated — can maintain comprehensive symbolic coverage of an active research literature. The moment your work touches a recently characterized protein complex, a novel synthetic scaffold, or a non-model organism pathway, the library fails you. You resort to approximation: a generic kinase icon where a specific tyrosine kinase should be, a placeholder shape where a validated receptor structure belongs.
Design software assumes design knowledge. Adobe Illustrator and Inkscape are powerful tools, but their learning curves are calibrated to visual designers, not molecular biologists. Concepts like anchor points, bezier handles, layer management, and artboard configuration are not intuitive to someone whose expertise lies in mass spectrometry or computational fluid dynamics. The time spent mastering these interfaces is time diverted from research.
Template-based platforms impose stylistic uniformity. Subscription tools built around curated symbol libraries accelerate figure production, but they do so by standardizing output. Every figure made with the same library looks like every other figure made with that library. More critically, the underlying constraint remains: you are still assembling pre-existing parts rather than generating custom visual representations of your specific experimental setup.
Revision cycles are expensive. When your PI changes the proposed mechanism, or a reviewer requests that you add a control condition to a diagram, conventional workflows require you to reopen the source file, locate and modify the relevant elements, and recheck every alignment decision you made in the original build. A two-sentence experimental change can cost an hour of illustration time.
How AI Text-to-Figure Works
Understanding the mechanics of text-to-figure generation helps you write better prompts and anticipate what the system can and cannot do. The process unfolds in several distinct stages.
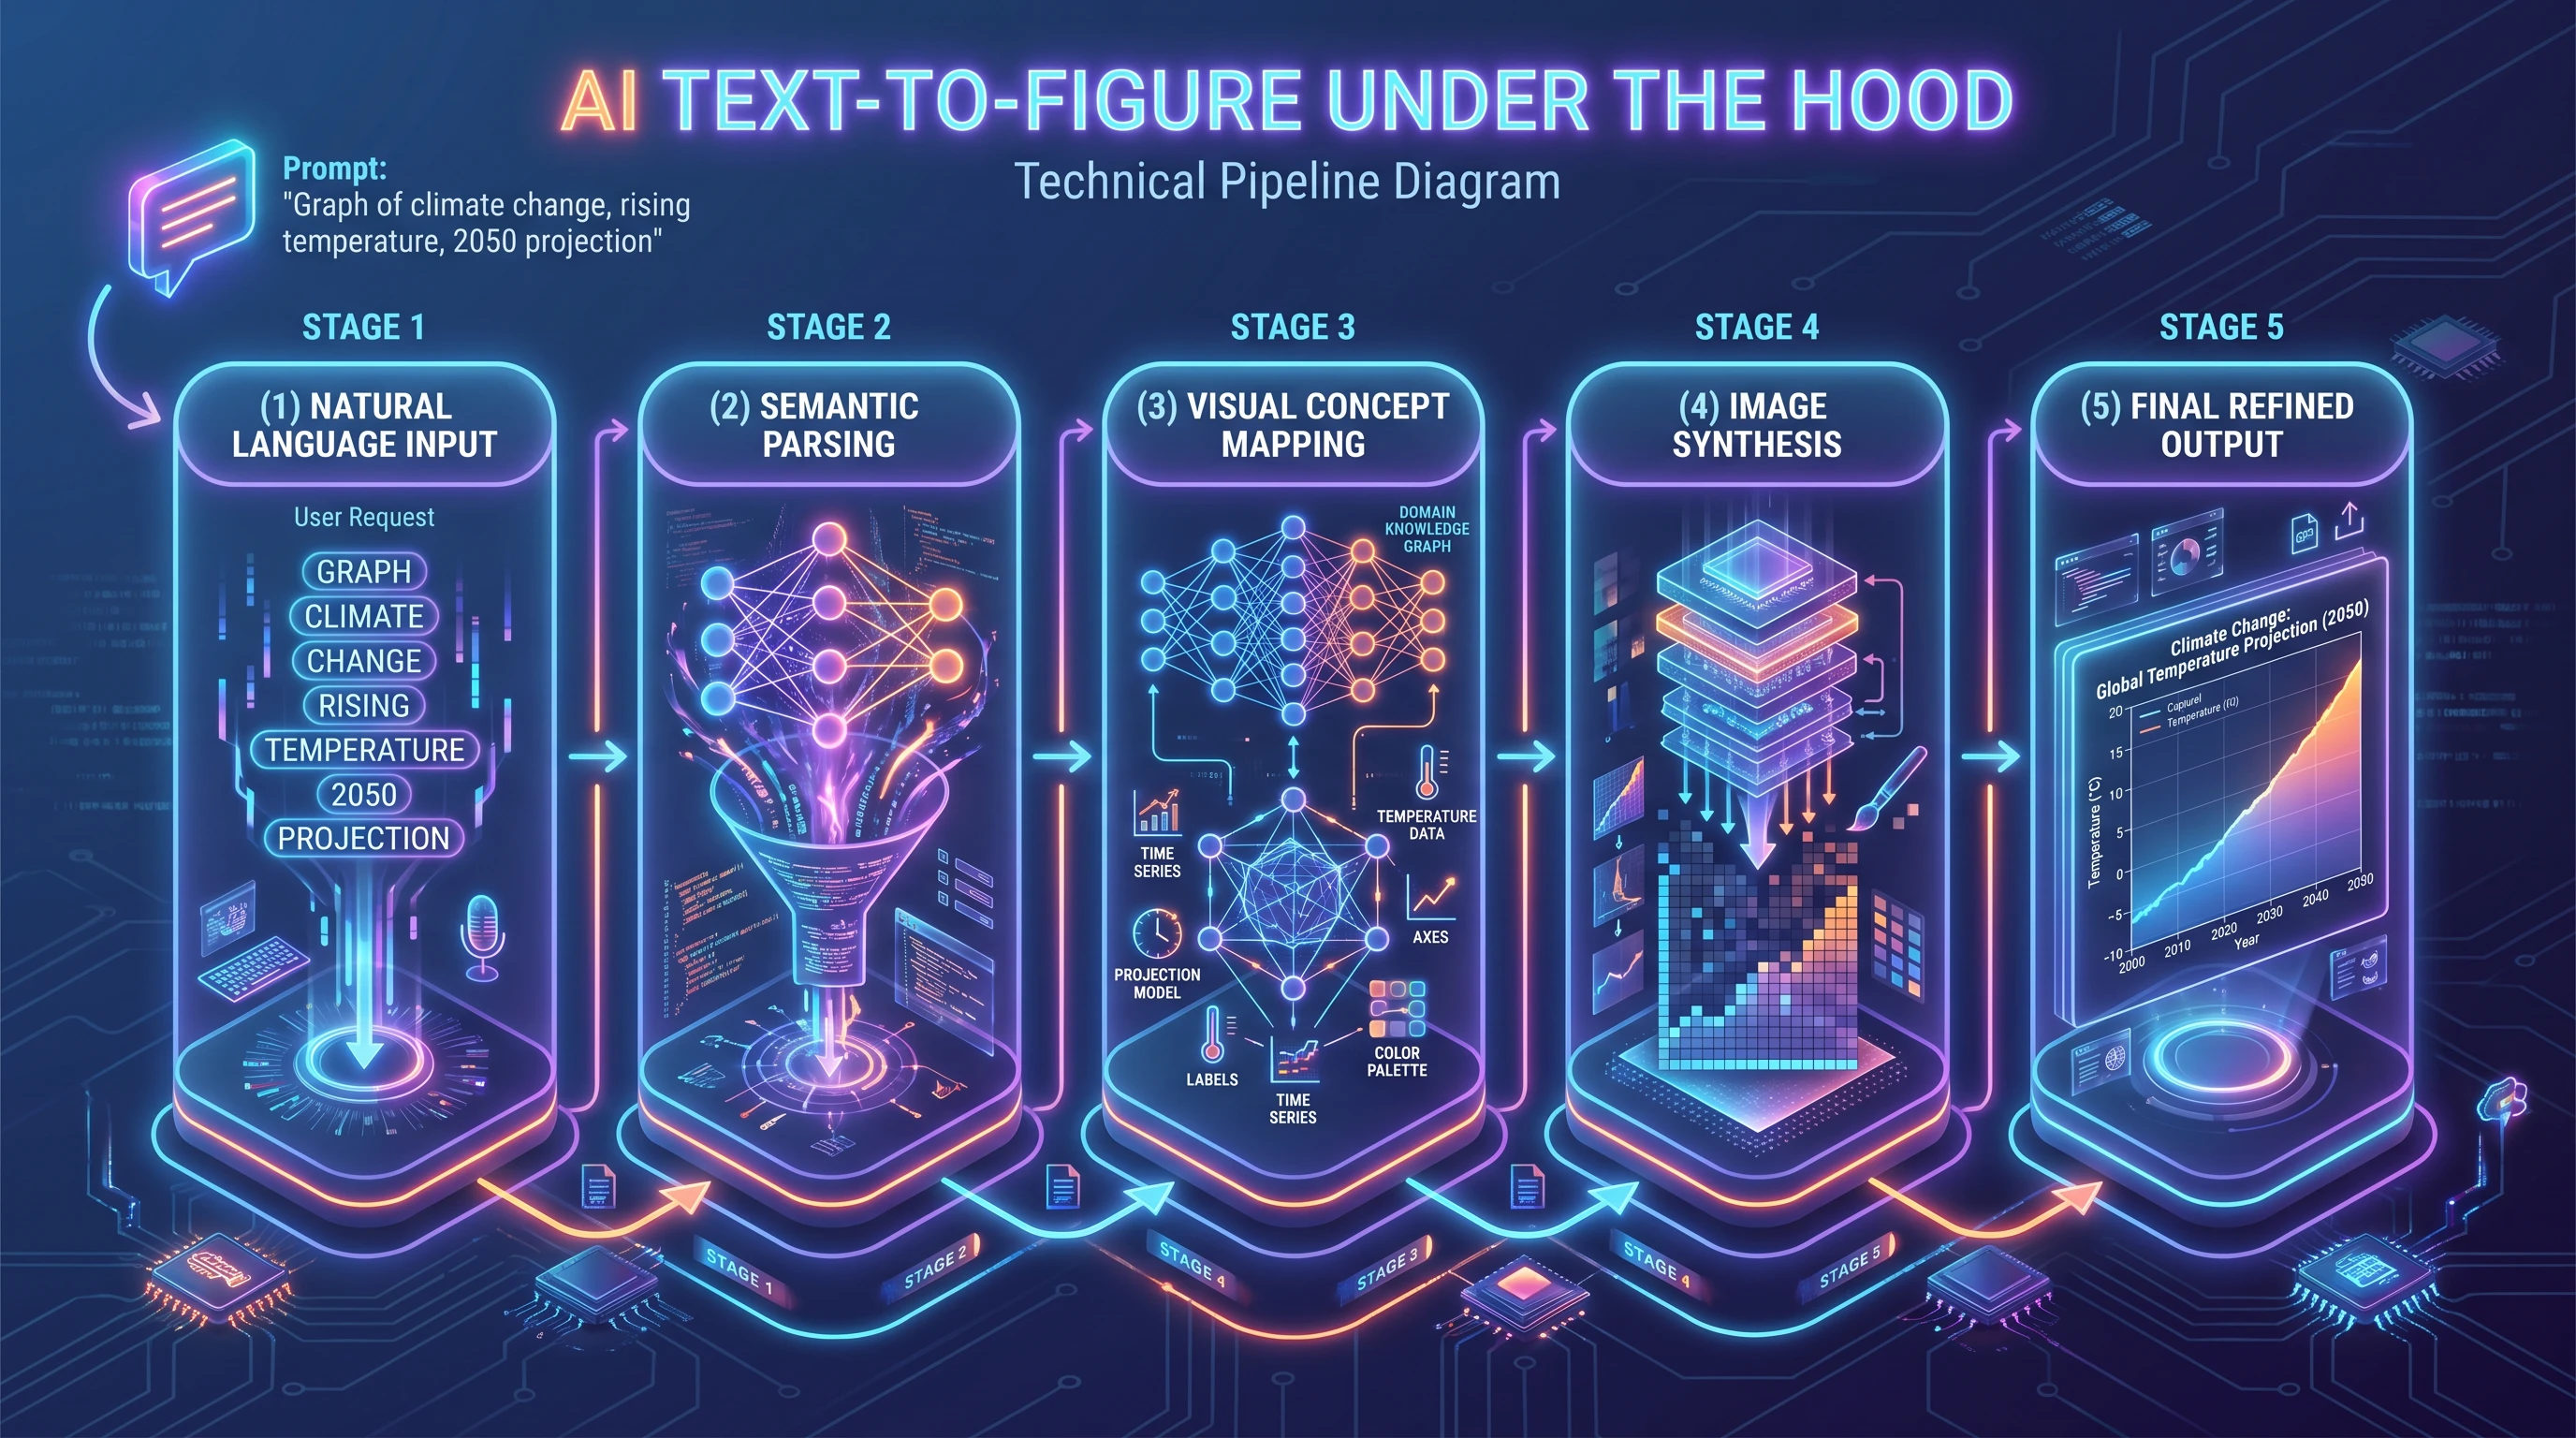
Technical AI pipeline: natural language input → semantic parsing → visual concept mapping with knowledge graph → image synthesis → refined output (Figure generated with SciFig)
Stage 1 — Natural Language Parsing. When you submit a prompt, the system's language model reads your description and extracts structured information: which entities are present (proteins, organelles, instruments, chemical species), what relationships exist between them (binds to, activates, phosphorylates, flows into), and what spatial or hierarchical logic governs the layout (membrane-bound vs. cytoplasmic, upstream vs. downstream, input vs. output).
Stage 2 — Scientific Context Resolution. The model applies domain knowledge to fill in implicit information. If you write "show EGFR dimerization upon EGF binding," the system understands that EGFR is a receptor tyrosine kinase, that it resides in the plasma membrane, that EGF is an extracellular ligand, and that dimerization involves lateral interaction within the membrane plane. You do not have to specify every detail; the model contributes what it knows about standard scientific conventions.
Stage 3 — Layout Generation. The system constructs a spatial arrangement of components consistent with your description and domain conventions. For a signaling pathway, this means upstream ligands at the top and downstream transcription factors near the nucleus. For a spectroscopy setup, this means a coherent optical path from source to detector. The layout follows visual logic specific to each discipline.
Stage 4 — Rendering and Labeling. Components are rendered as consistent vector-style illustrations with appropriate labels, arrows, and annotations. Arrow types are matched to their function: activation arrows differ from inhibition bars, material flow arrows differ from information flow arrows.
Stage 5 — Iterative Refinement. You review the draft and submit follow-up prompts to adjust components, modify labels, change color scheme, or add detail. Each iteration takes seconds rather than minutes. When the scientific figure meets your requirements, you export it as SVG, PNG, or PDF at whatever resolution your journal requires.
See AI Scientific Figure Generation in Action
Watch how researchers create publication-ready scientific figures from text descriptions.
Text-to-figure is not a tool designed for a single research domain. Its utility extends across the full breadth of scientific disciplines, each of which has developed its own visual vocabulary that the system has learned to speak.
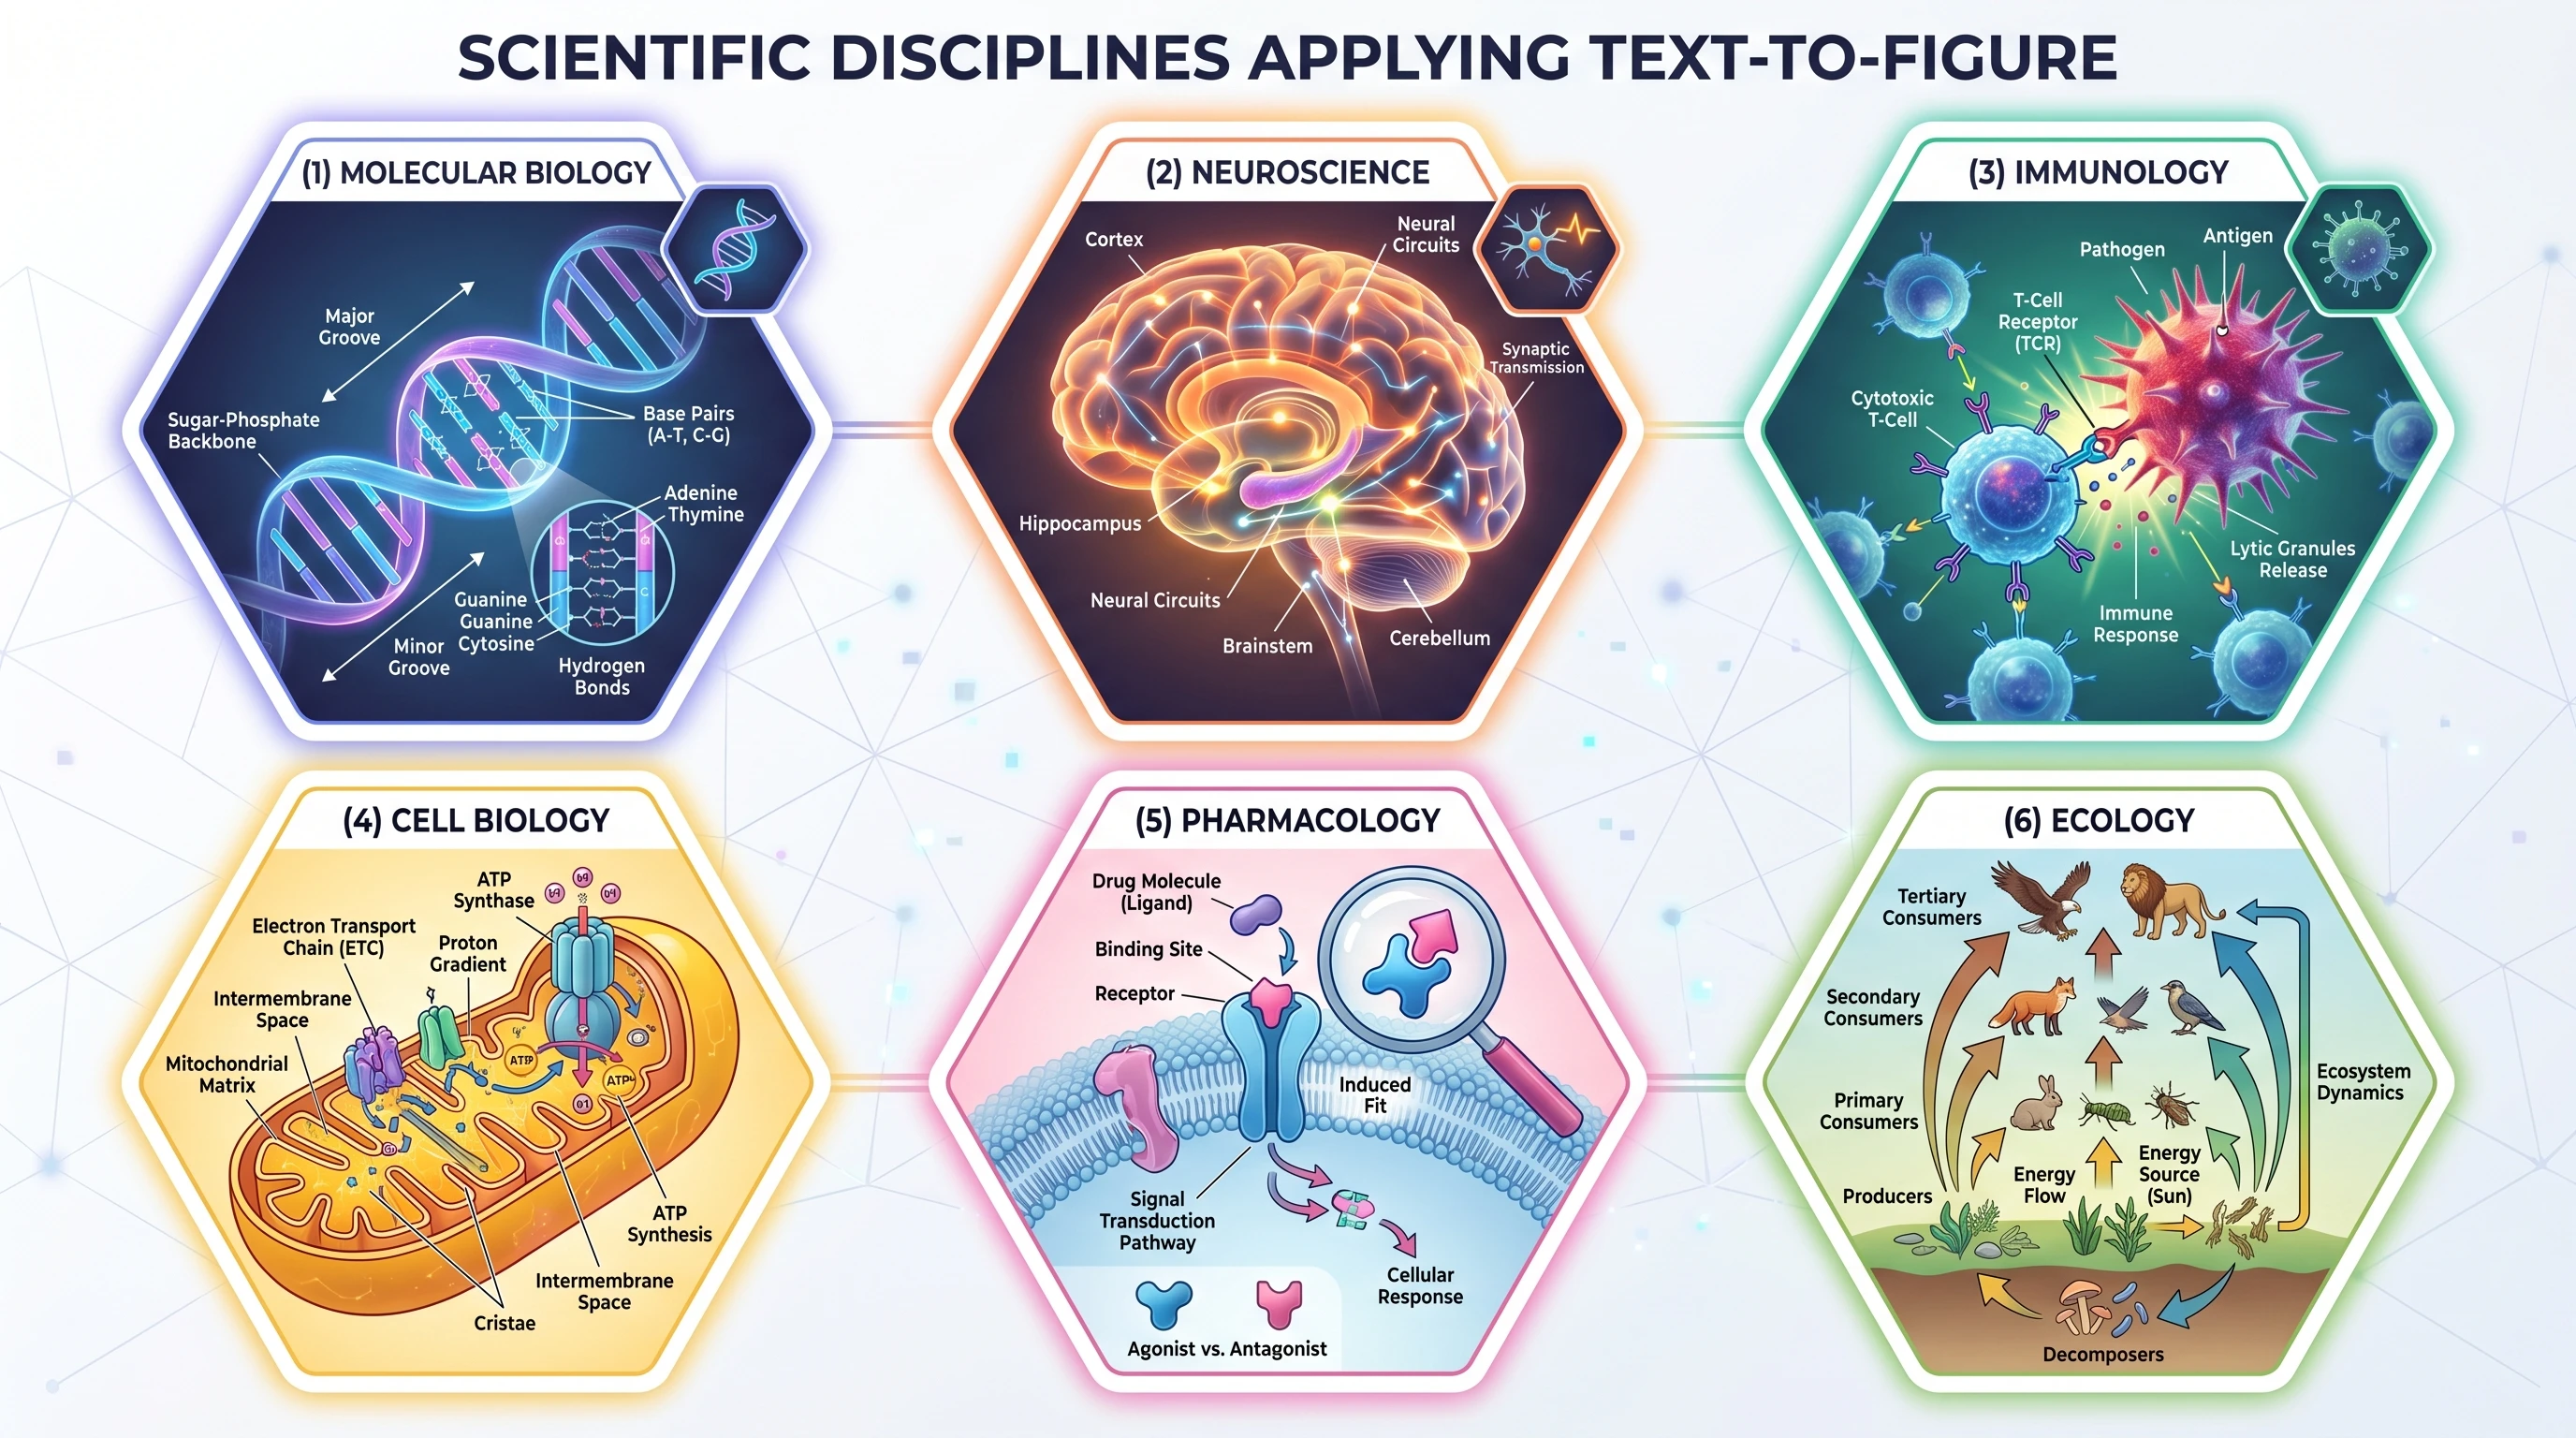
Hexagonal grid of 6 disciplines using text-to-figure: molecular biology, neuroscience, immunology, cell biology, pharmacology, ecology (Figure generated with SciFig)
Molecular Biology — Pathway Diagrams
Signaling cascades, gene regulatory networks, and metabolic pathways are the canonical use case. The density of named components, the importance of spatial compartmentalization, and the need for directional arrows with mechanistic labels all play to the strengths of AI-driven figure generation. A researcher studying the mTORC1 pathway can describe the entire regulatory hierarchy — from growth factor input through PI3K, AKT, and TSC1/2 to the mTOR kinase complex itself — and receive a correctly organized, appropriately labeled diagram without touching a single icon or drawing a single arrow manually.
The same logic applies to gene expression diagrams, where transcription factor binding sites, RNA polymerase positioning, and co-activator recruitment must be shown in precise spatial relationship to a promoter region.
Materials Science — Crystal Structures and Interfaces
Materials scientists routinely need to illustrate unit cells, grain boundary structures, thin-film layer stacks, and interface morphologies. These visualizations require precise geometric relationships that are difficult to establish by hand in general-purpose design software. A text-to-figure system that understands crystallographic notation can generate a perovskite unit cell with correct octahedral coordination geometry from a description like "show the ABX3 perovskite structure with A-site cation at the cube corner, B-site cation at the body center, and X-site anions at face centers."
Layer-by-layer thin film architectures — common in materials characterization and device fabrication contexts — are particularly well suited to text-to-figure generation. Describing layer composition, thickness ratios, and interface roughness in plain language is faster than manually building a cross-section schematic.
Physics — Experimental Setups
Optical setups, particle physics event diagrams, and thermodynamic cycle representations each have established visual conventions. A laser spectroscopy experiment might require a schematic showing a tunable laser source, a beam splitter, a sample chamber, collection optics, and a photodetector — all connected by a coherent optical path with beam direction indicated. Describing this arrangement takes roughly thirty seconds. Building it conventionally, with correct symbolic representations of each optical component, takes far longer.
Feynman diagrams, energy level diagrams, and band structure schematics are similarly amenable to text-based generation, provided the prompt uses standard physics nomenclature. A quantum optics researcher can generate a three-level lambda system energy diagram by describing the ground state, two excited states, transition energies, and the coupling fields in a single prompt.
Engineering — System Diagrams
Fluid dynamics schematics, control system block diagrams, mechanical linkage illustrations, and circuit topologies all share a need for precision in component representation and connection topology. An engineering researcher describing a feedback control loop with a plant, sensor, controller, and actuator — specifying signal flow directions and identifying where disturbances enter the system — can receive a complete block diagram in seconds. Adjusting gain values in labels or adding a feed-forward path requires only an additional sentence.
Process flow diagrams, common in chemical engineering and bioprocessing contexts, benefit similarly. Reactors, separators, heat exchangers, and mass flow streams can be described textually and rendered as complete process schematics with correct piping and instrumentation symbology.
Tips for Writing Effective Prompts
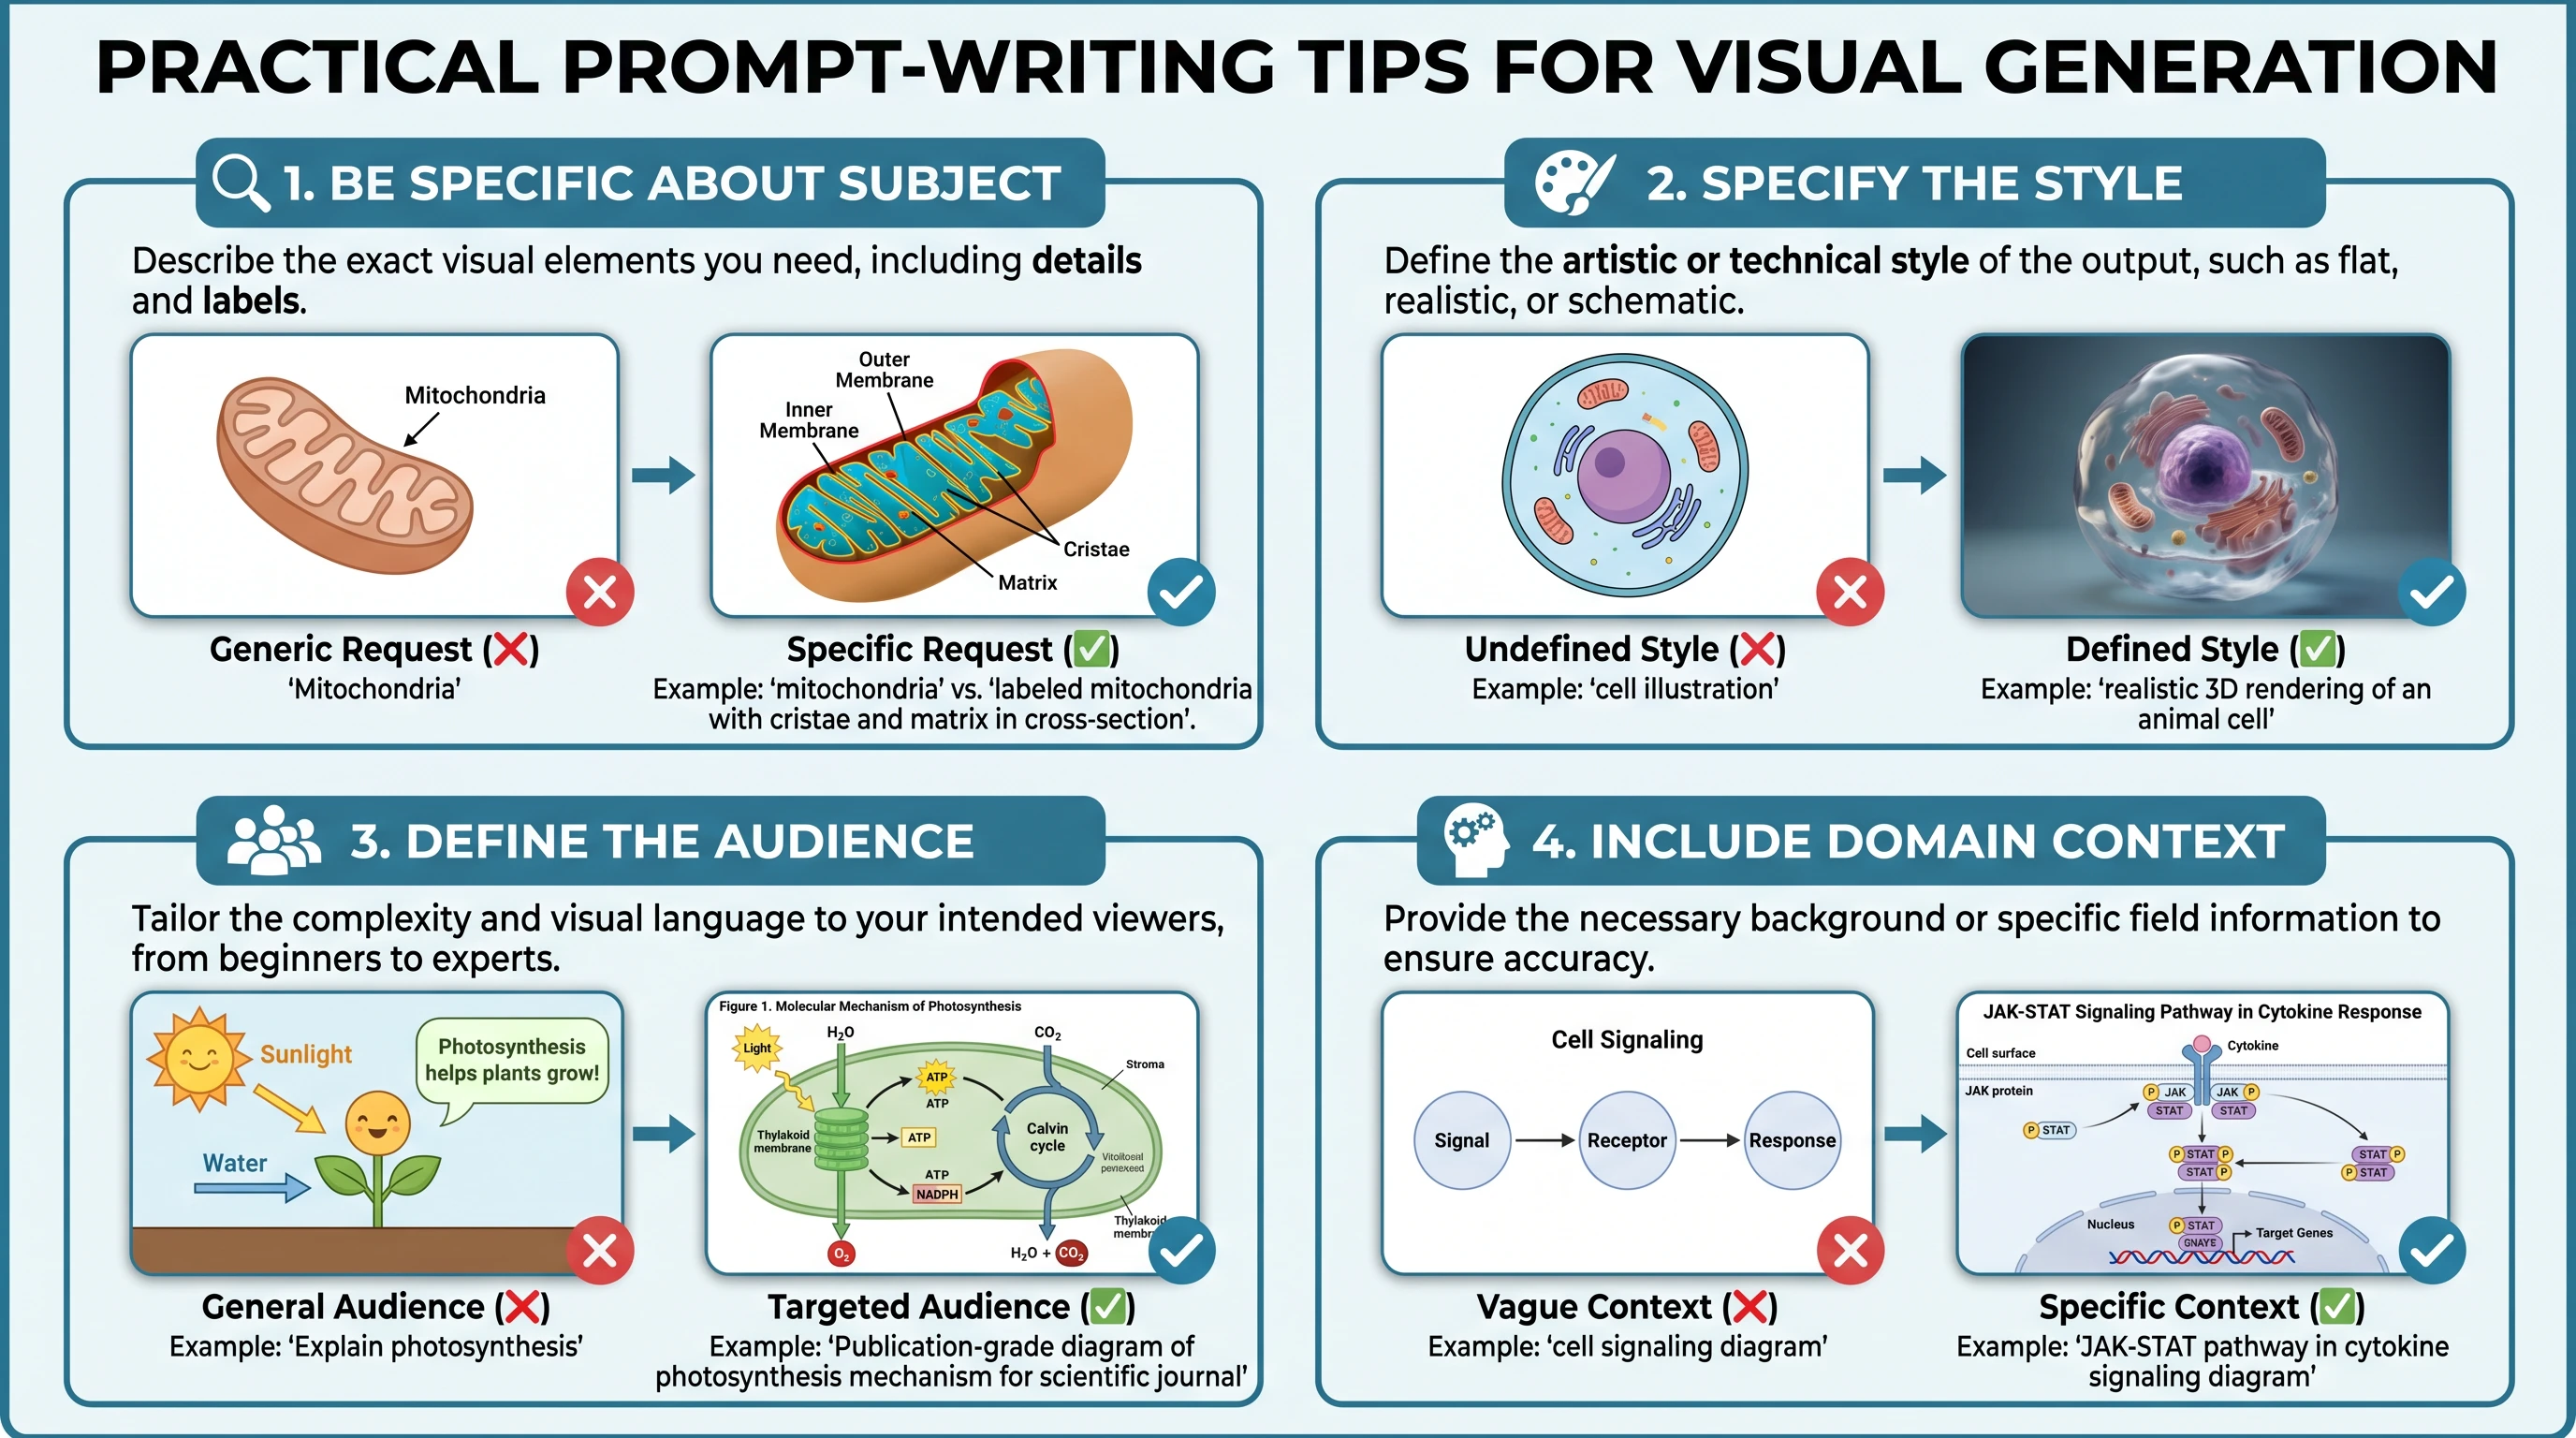
The quality of your output is directly proportional to the quality of your input. Our S.S.V.D. prompt framework is the deeper reference; the practices below summarize what matters most.
Prompt writing 2x2 tips grid: be specific about subject, specify style, define audience, include domain context — each with visual example thumbnails (Figure generated with SciFig)
Be specific about component identity. Generic terms produce generic figures. Instead of "receptor," write "NMDA receptor with GluN1 and GluN2B subunits." Instead of "crystal lattice," write "face-centered cubic unit cell with lattice parameter a." The model has substantial domain knowledge — give it enough specificity to apply that knowledge correctly.
Define spatial layout explicitly. Text-to-figure systems infer default layouts from domain conventions, but your specific figure may require a non-standard arrangement. Specify orientation: "arrange the pathway vertically with extracellular space at the top," "show the reactor in the center with feed streams entering from the left and product streams exiting to the right." Explicit spatial language prevents layout guessing.
Describe arrow types and directionality. Arrows carry meaning in scientific diagrams. Distinguish activation from inhibition, material flow from signal flow, reversible from irreversible reactions. "Use a blunt-ended inhibition arrow from PTEN to AKT" is unambiguous. "Add an arrow between PTEN and AKT" is not.
Specify stylistic constraints upfront. If your scientific figure needs to print clearly in grayscale, say so in the initial prompt. If your journal requires a minimum 300 DPI raster output or a specific font, include those constraints. Style corrections are cheaper to prevent than to fix after generation.
Label every component you care about. If a component needs a label, name it in the prompt. The system does not always know which components are important to your specific argument. If the phosphorylation site at Thr308 is scientifically significant, include "label the phosphorylation site at Thr308" in your description.
Tip
The single most effective prompt improvement is to describe relationships, not just objects. "Show ERK phosphorylating RSK with a labeled phosphorylation arrow" produces a better figure than "show ERK and RSK." Verbs are the most important words in a scientific illustration prompt.
Create Scientific Figures Now
Describe your scientific figure in natural language — get publication-ready illustrations in minutes.
The current generation of text-to-figure tools is already producing genuine productivity gains. But the trajectory of the technology suggests that the changes ahead are more fundamental than efficiency improvements.
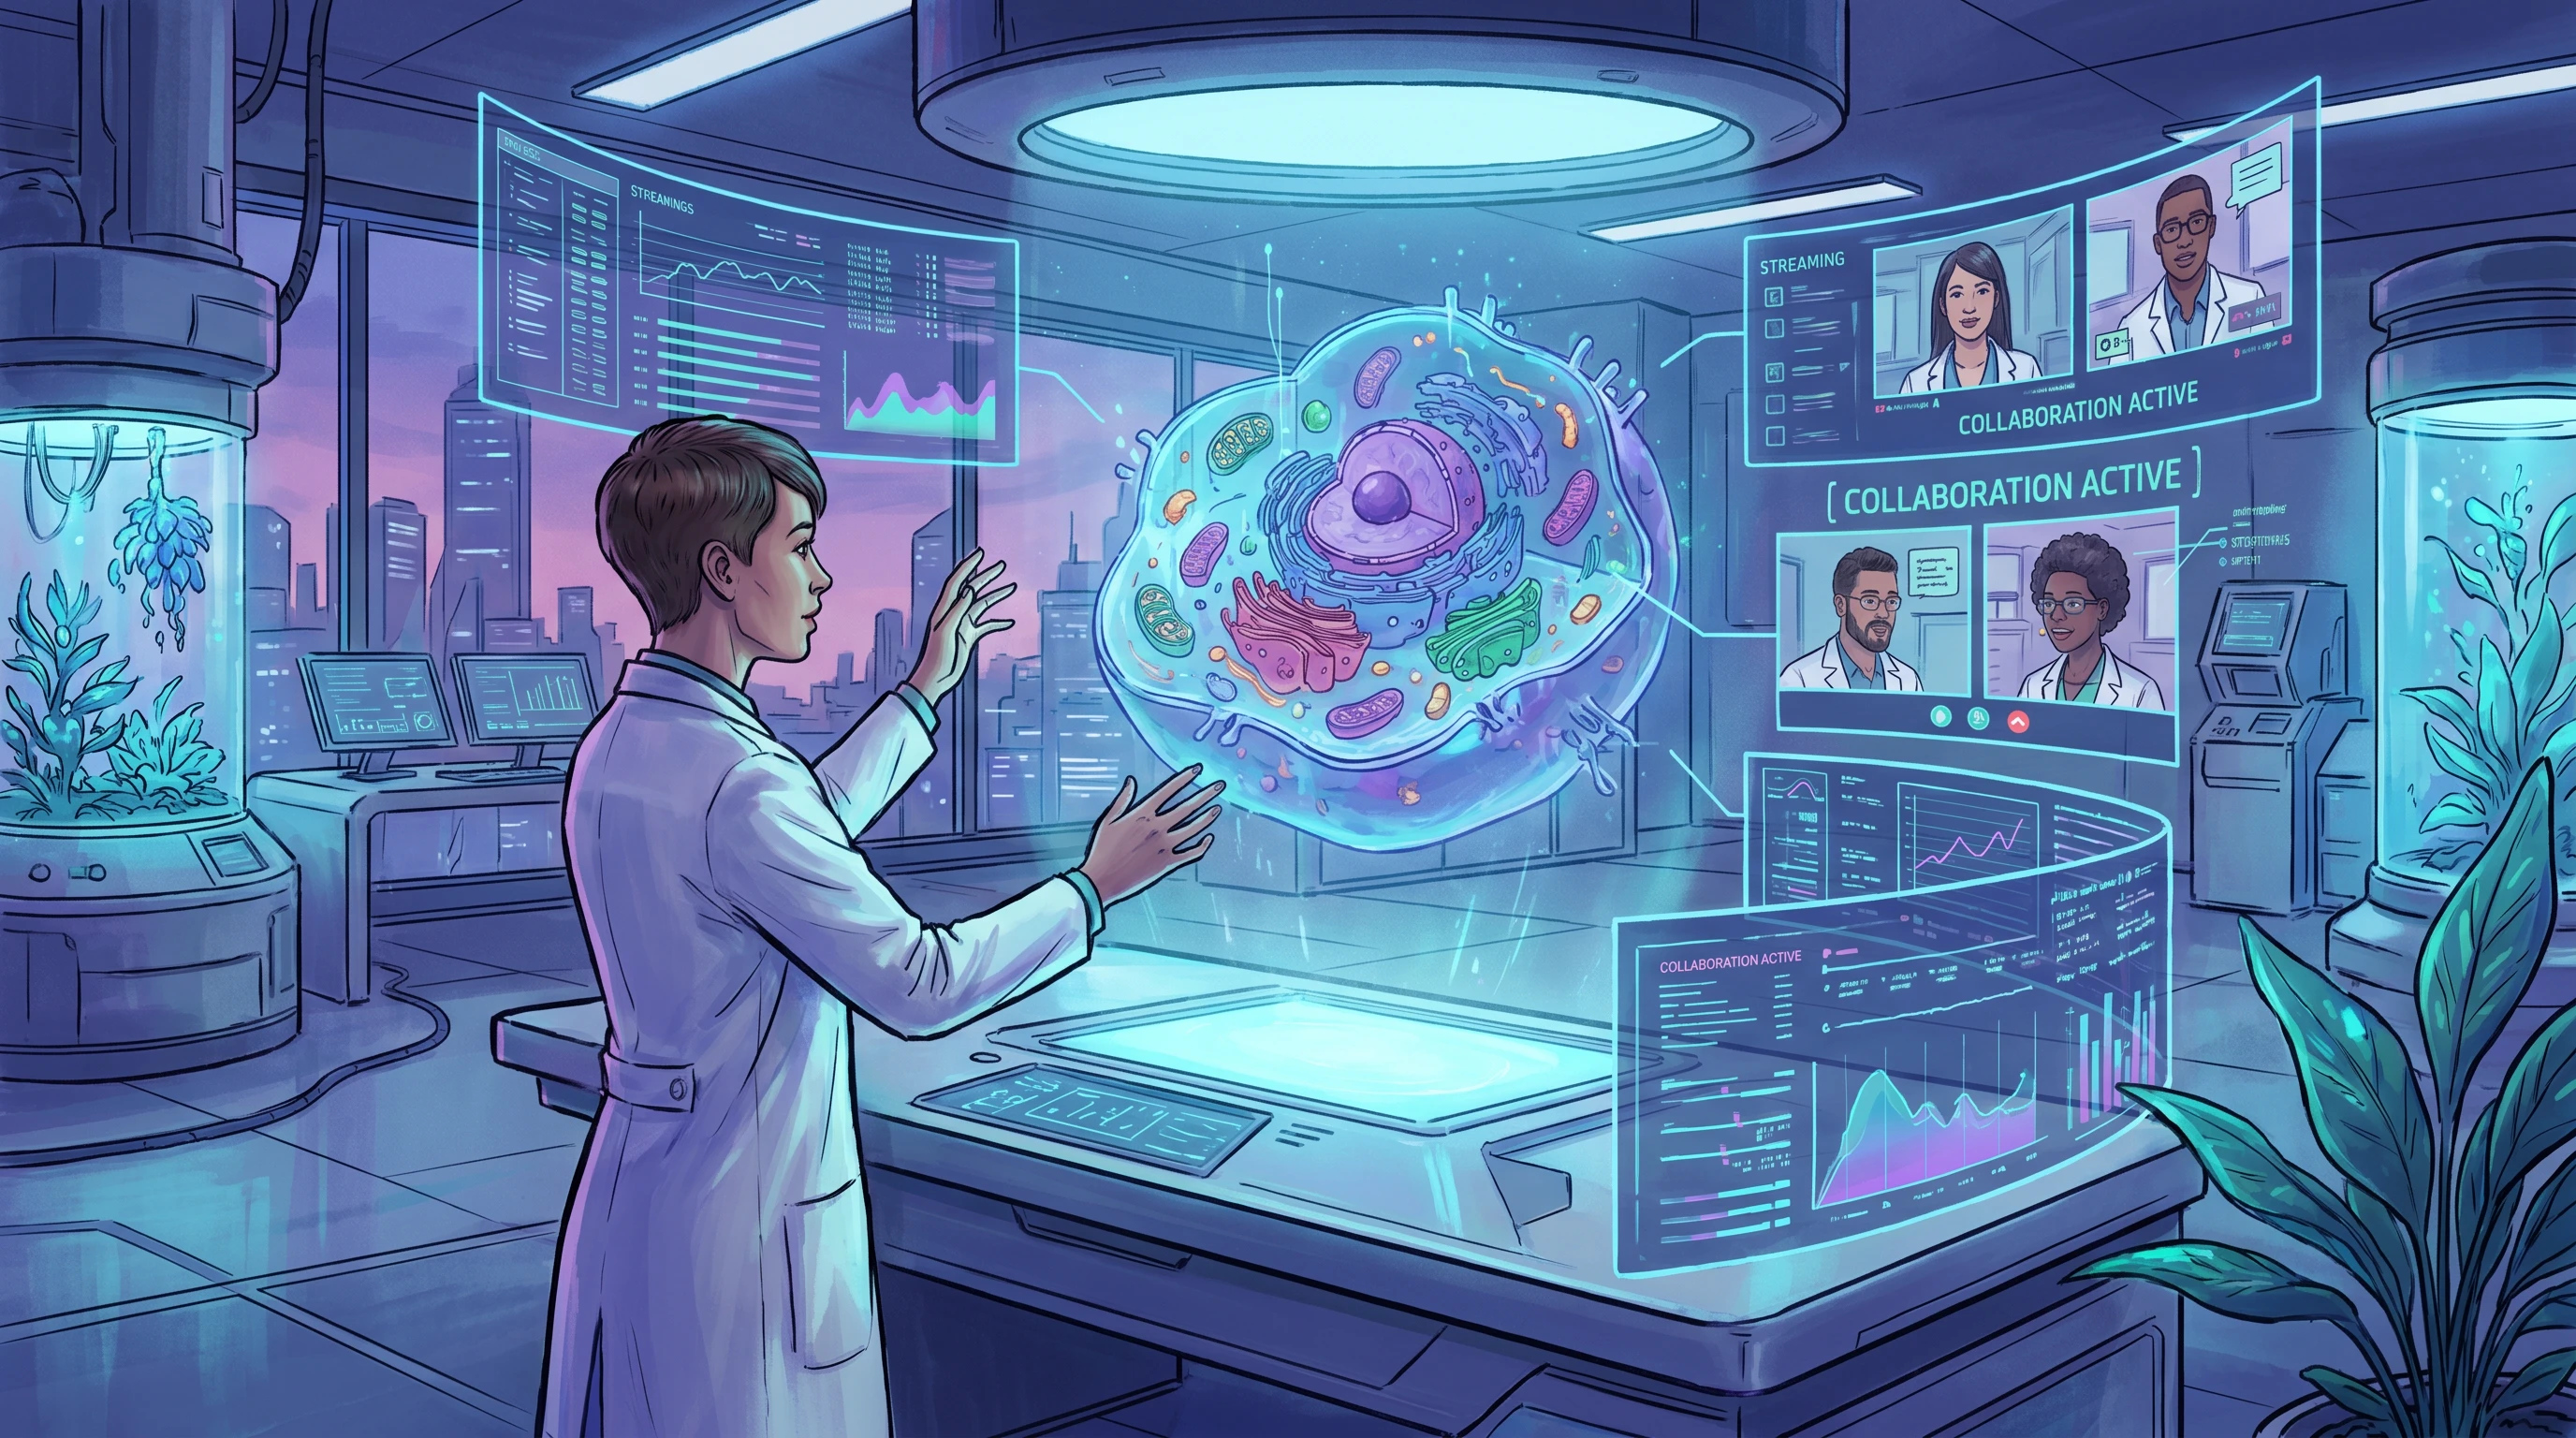
Future vision: researcher manipulating holographic 3D cellular structure with hand gestures, multiple screens showing real-time data and collaborative annotations (Figure generated with SciFig)
Democratization of scientific communication. Publication-quality illustration has historically been gated by either institutional resources (professional figure artists, expensive subscriptions) or individual design skill. As text-to-figure systems improve, this gate disappears. A researcher at an institution with no dedicated scientific illustrator and no discretionary budget for design software gains access to the same visual communication capabilities as a group with both. The scientific record benefits when the quality of a scientific figure reflects the quality of the underlying science rather than the resources available to render it.
Real-time figure generation during writing. The natural evolution of text-to-figure is integration with scientific writing environments. Describing an experimental mechanism in the methods section generates a corresponding figure in the same editing session. Revising the mechanism updates the scientific figure automatically. The separation between writing and illustrating — which has always been somewhat artificial, since both serve the same communicative purpose — begins to dissolve.
Multimodal scientific reasoning. Future systems will likely accept experimental data as input alongside natural language descriptions. Rather than describing what you want to show, you provide the underlying data and describe the scientific question, and the system determines which visual representation best answers that question. A gene expression matrix becomes a pathway diagram. A crystal structure file becomes a publication illustration. The scientist's role shifts from figure constructor to figure curator.
Collaborative figure iteration. Multi-author research teams frequently lose time to asynchronous figure revision cycles conducted over email. Version control for scientific figures — with prompt-based change tracking analogous to document revision history — is a natural extension of text-to-figure platforms. Every change becomes auditable, reversible, and shareable with the same ease as a tracked change in a shared document.
The underlying shift is from figures as static artifacts to figures as dynamic, queryable representations of scientific knowledge. Text-to-figure is the entry point to that transition — and it is available to use today.
Frequently Asked Questions
Can SciFig's AI-generated figures be used in peer-reviewed publications?
This depends on the policies of the specific journal. Many journals have adopted policies distinguishing between AI-assisted and AI-generated content, and some require disclosure. Check your target journal's author guidelines before submission. In most cases, using AI tools like SciFig to generate a scientific figure that you then review, verify for scientific accuracy, and take responsibility for is treated similarly to using any other figure production tool. The scientific accuracy and the intellectual content remain the author's responsibility.
How does text-to-figure handle domain-specific notation that may not be widely standardized?
Major disciplines with established visual conventions — molecular biology, physics, chemistry, engineering — are well served. For highly specialized or emerging subfields, the model may not have deep knowledge of the most current symbolic conventions. In these cases, the best approach is to describe the intended meaning of each visual element rather than using field-specific jargon, and then verify that the generated output uses the notation correctly before submission.
What file formats are typically available for export?
Most text-to-figure platforms support SVG for vector export, PNG at various resolutions, and PDF. SVG is generally preferable for figures that will be further edited in vector software, as it preserves layer structure and allows individual component modification. PNG at 300 DPI or higher is the standard minimum for print publication; many journals now request 600 DPI for line art.
How much scientific accuracy can I expect from a generated figure?
Text-to-figure systems are trained on scientific illustration data and perform well on established, well-represented concepts. They do not conduct literature verification — if your prompt contains a scientific error, the scientific figure will render that error faithfully. You remain responsible for verifying the scientific accuracy of every generated figure before including it in a manuscript or presentation. Treat the AI output as a skilled technical illustrator executing your instructions, not as a domain expert checking your science.
Is there a meaningful difference between a simple prompt and a detailed one?
Yes, consistently. Short prompts — "draw a CRISPR mechanism" — produce generic figures that capture broad concepts but lack specificity to your experimental context. Detailed prompts that name specific components, describe spatial relationships, specify arrow types, and include stylistic constraints produce figures that are closer to publication-ready on the first generation and require fewer revision iterations. Our scientific AI prompt framework includes 10 templates and a scoring rubric for evaluating prompt quality. The time investment in writing a detailed initial prompt is almost always recovered in reduced revision cycles.
Recommended next
Related scientific figure resources
Go deeper with the most relevant SciFig pages for this article.