You are eight days from the AAIC upload deadline and your amyloid-tau mechanism figure is fighting you. The APP processing panel shows α-secretase feeding into Aβ — the opposite of what α-secretase does. Your tau tangles float in extracellular space, when NFTs live inside neurons. Your lecanemab arrow points at the dense plaque core, when lecanemab binds soluble protofibrils. Four rerolls in, each version trades one error for another, and a reviewer who has read these diagrams for thirty years catches the wrong cell biology in five seconds.
This is the AAIC 2026 mechanism-figure problem. Amyloid and tau pathology make up the most-submitted Basic Science topic, and the disease-modifying therapy class — lecanemab and donanemab — anchors Drug Development. The canonical pathway maps were laid down by Selkoe, Hardy, Braak, and Iqbal, and every Alzheimer's researcher carries them in working memory. A wrong arrow direction or a tangle in the wrong compartment tells a reviewer the underlying biology is not understood. This guide walks through the four-stage Aβ aggregation cascade, the α/β/γ logic of APP processing, tau hyperphosphorylation and NFT formation, the modern amyloid cascade, anti-amyloid MOA, anti-tau therapies, and the AI-assisted workflow that compresses an Illustrator afternoon into a single SciFig session.
Transparency note: Illustrations in this article were generated with SciFig AI and reviewed by the author for scientific accuracy. Cited claims link to peer-reviewed sources, FDA approval letters, and NIA educational materials.
1. Why Amyloid-Tau Diagrams Anchor Every Alzheimer's Poster
For AAIC posters, almost every Basic Science submission needs at least one amyloid-tau figure that interlocks correctly with the rest of the field. A correct figure shows Aβ generated through amyloidogenic APP processing, aggregating across four canonical stages, triggering downstream tau hyperphosphorylation, NFT formation, synaptic loss, and cognitive decline — with biomarker callouts for the imaging and CSF crowd. A wrong figure breaks the chain anywhere along that sequence, and the poster's mechanistic story collapses.
2. Anatomy of an Amyloid-Beta Plaque Figure: 4 Aggregation Stages
The four-stage aggregation cascade is the most miscounted figure in the field. Generic image models routinely produce two- or three-stage cascades, conflating protofibril with plaque or collapsing the soluble oligomer into the monomer. The canonical sequence has exactly four stages, and each carries a distinct biological identity that determines which therapy targets which species.
- Monomer — A single Aβ peptide, either 40 or 42 amino acids long. Aβ40 dominates in healthy brain (roughly 9:1 ratio over Aβ42), while Aβ42 is more aggregation-prone and accumulates preferentially in Alzheimer's.
- Soluble oligomer — Aβ peptides assemble into trimers, dodecamers (Aβ*56 species) and other small soluble aggregates. It is well-established that this species is the most synaptotoxic — Lesné et al. 2006 (Accessed 2026-05-22) showed Aβ*56 alone impaired memory in transgenic mice.
- Protofibril — Linear, β-sheet-rich fibrillar aggregates that remain soluble but show clear filamentous structure. This is the species lecanemab binds.
- Mature dense-core plaque — Insoluble fibrillar deposits visible on histology. The core carries the N-terminally truncated, pyroglutamate-modified Aβ epitope (Aβ-N3pE) that donanemab targets.
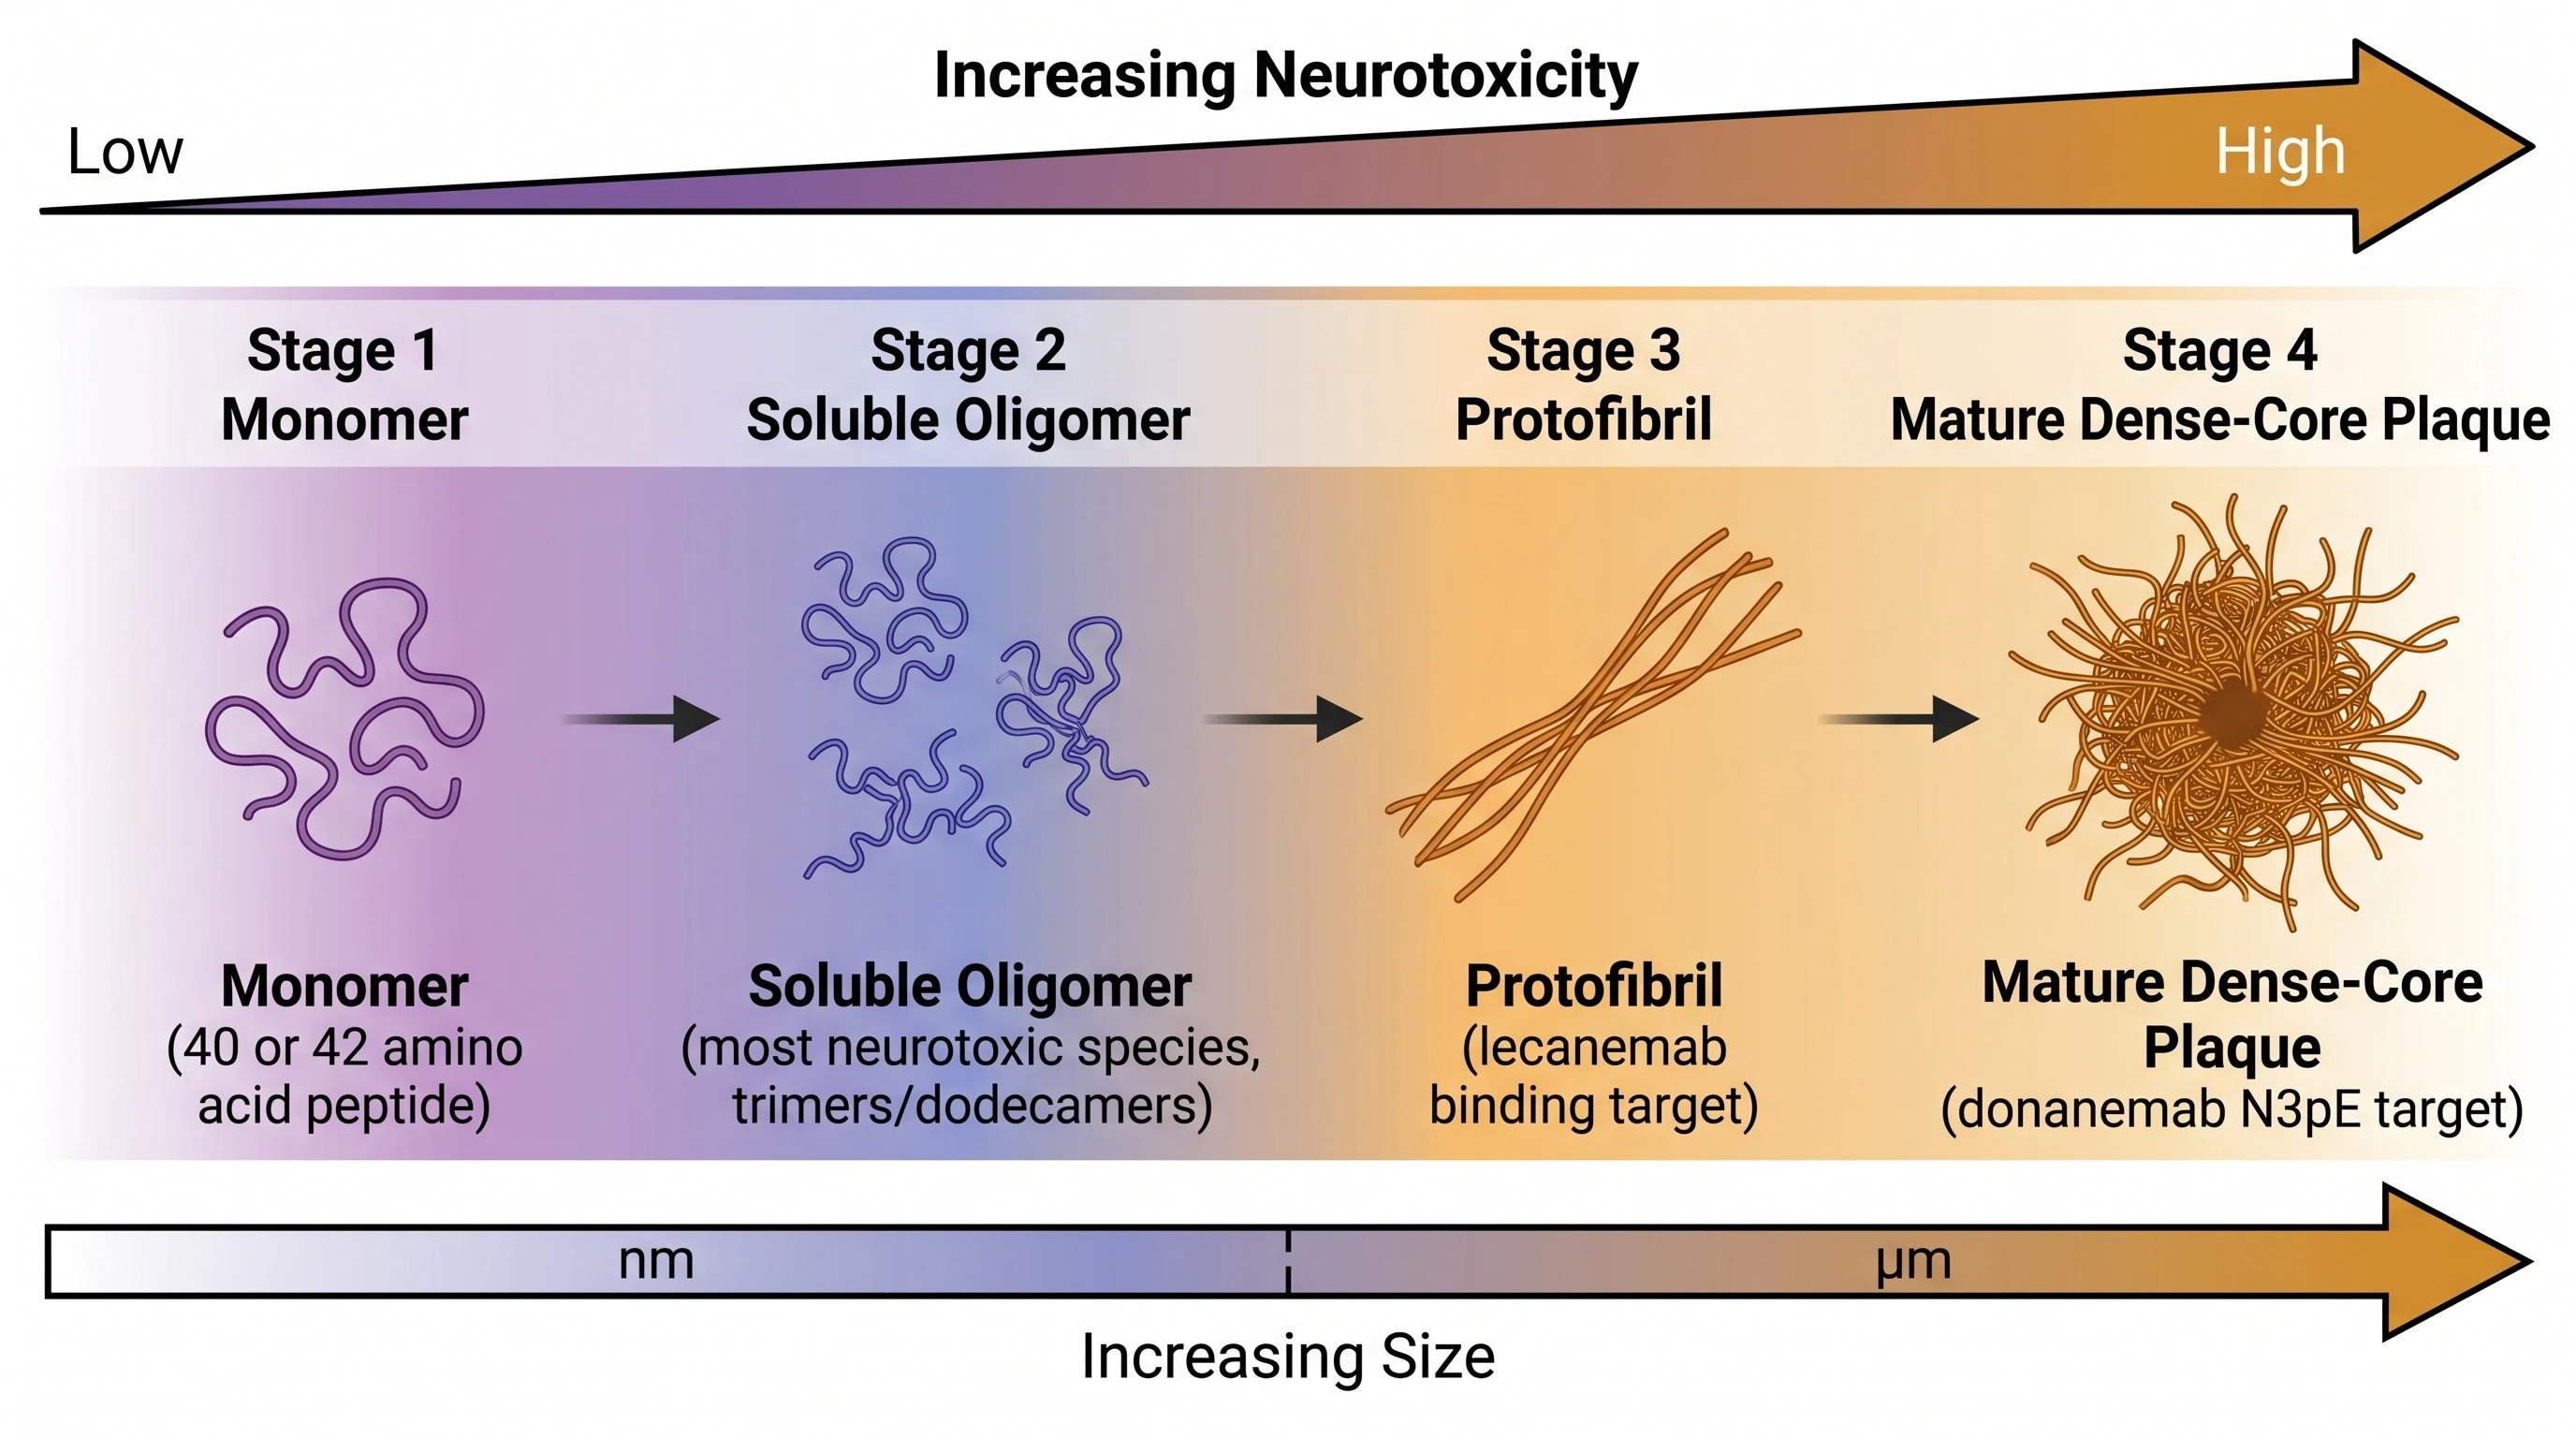
A poster drawing only "monomer → plaque" without the soluble-oligomer intermediate signals that the author has not engaged with the synaptotoxicity literature.
3. The APP Processing Pathway: α vs β vs γ Secretase
APP processing is where AI-generated figures fail most spectacularly. The pathway has two branches, and the directionality of α versus β determines whether Aβ is generated at all.
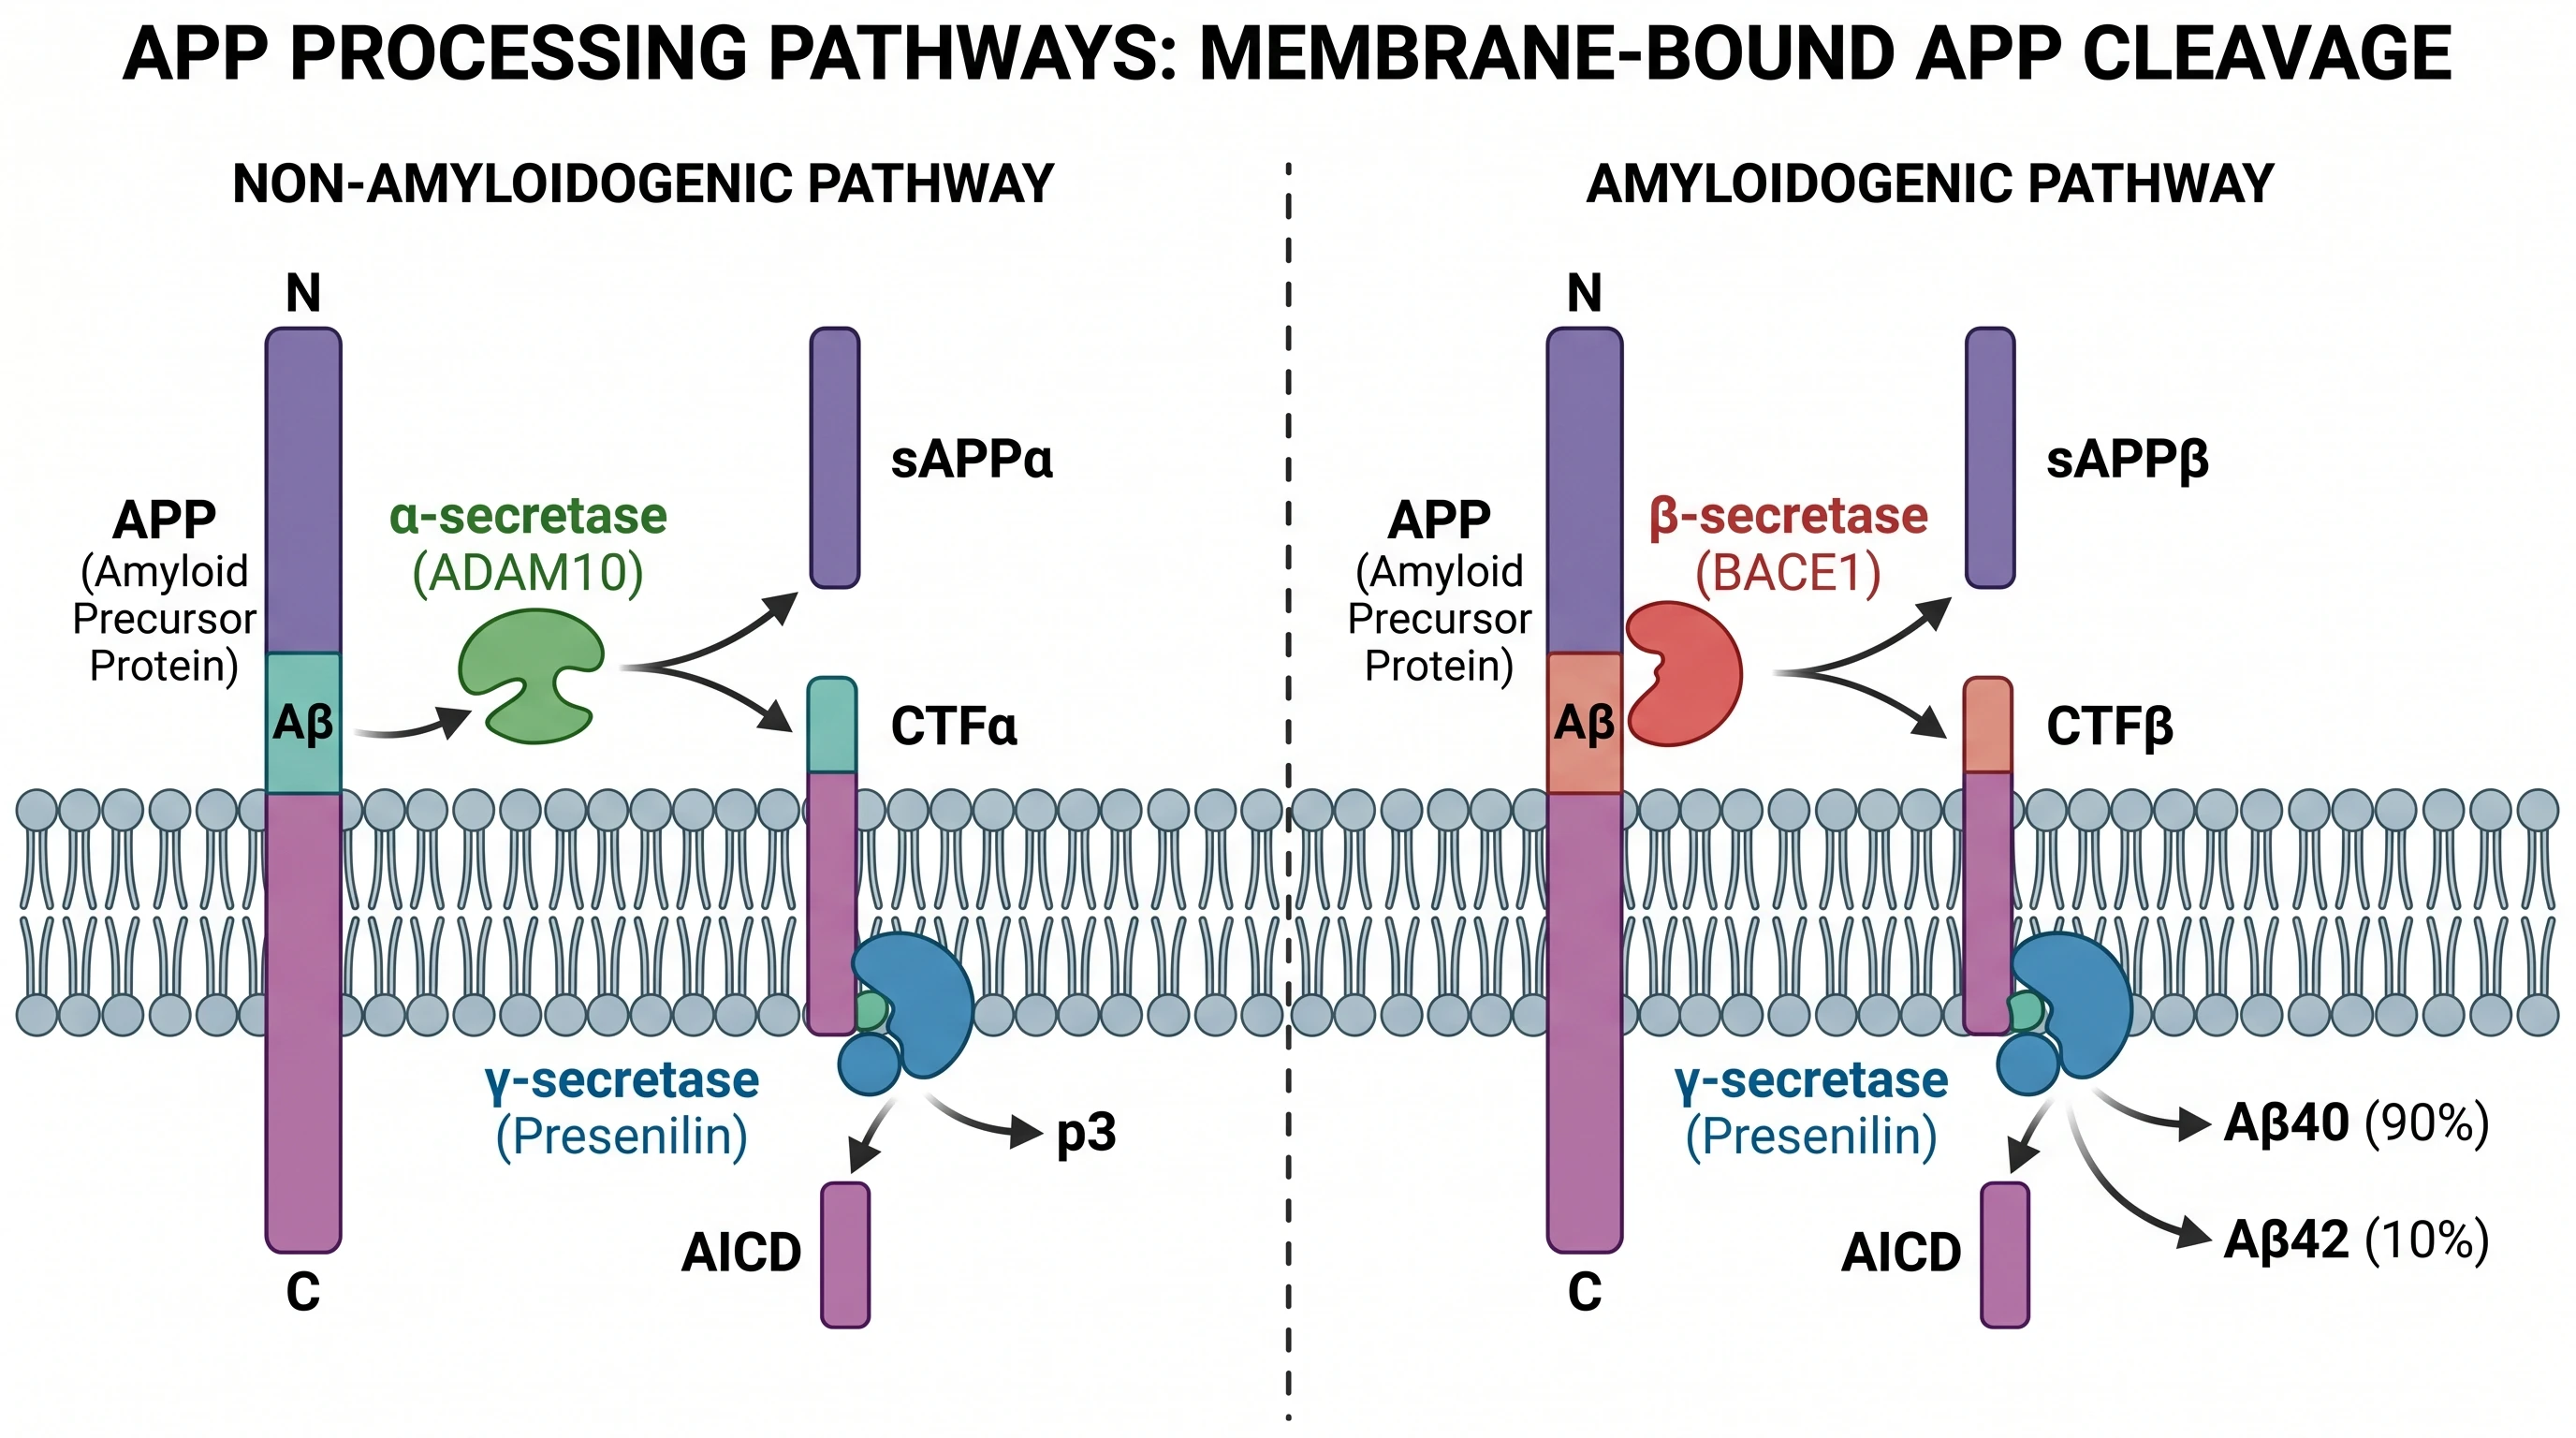
The single most important visual decision is which side of the panel each enzyme appears on. α-secretase on the left as the protective branch, β plus γ on the right as the amyloidogenic branch — that arrangement matches every review article and lets reviewers parse the figure in seconds. Drawing α-secretase as the first step of the amyloidogenic pathway will collapse reviewer confidence regardless of how clean the rest of the artwork is.
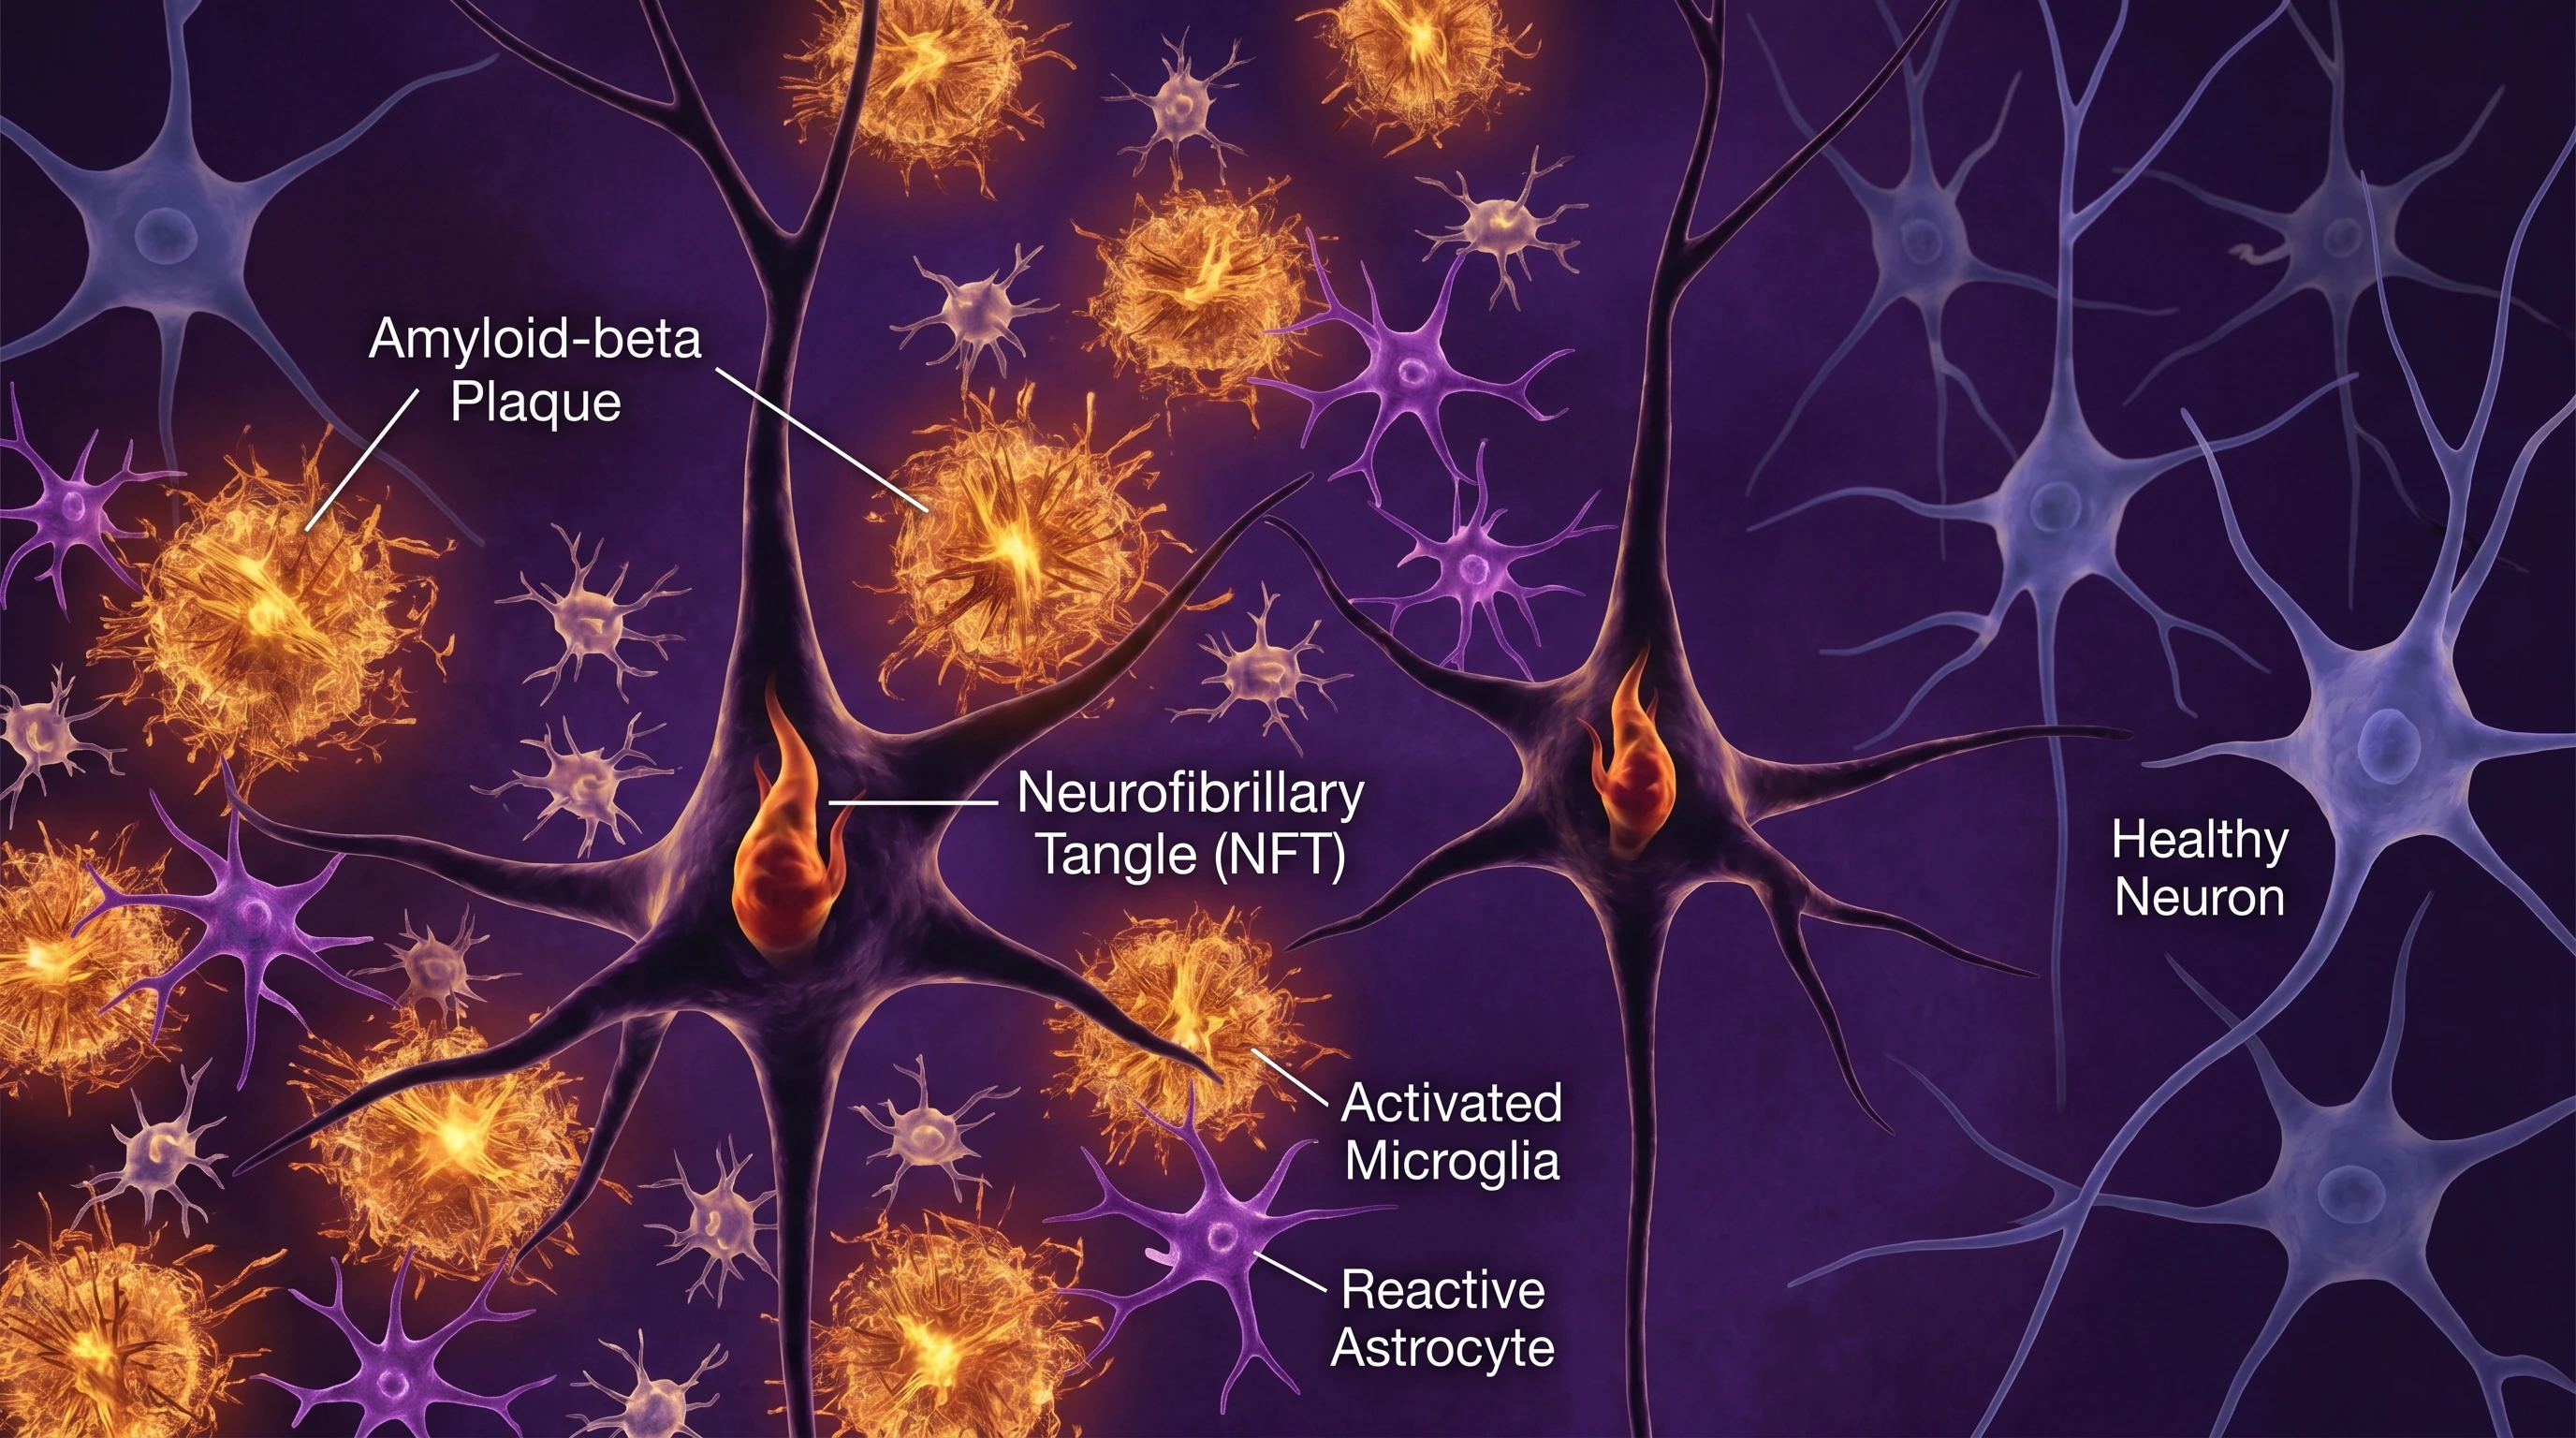
4. Tau Pathology: From Soluble Tau to Neurofibrillary Tangles
Tau pathology unfolds inside the neuron — the single most frequently misdrawn aspect of amyloid-tau figures. Generic image models routinely place NFTs in the extracellular space next to plaques. Reviewers spot this in under five seconds.
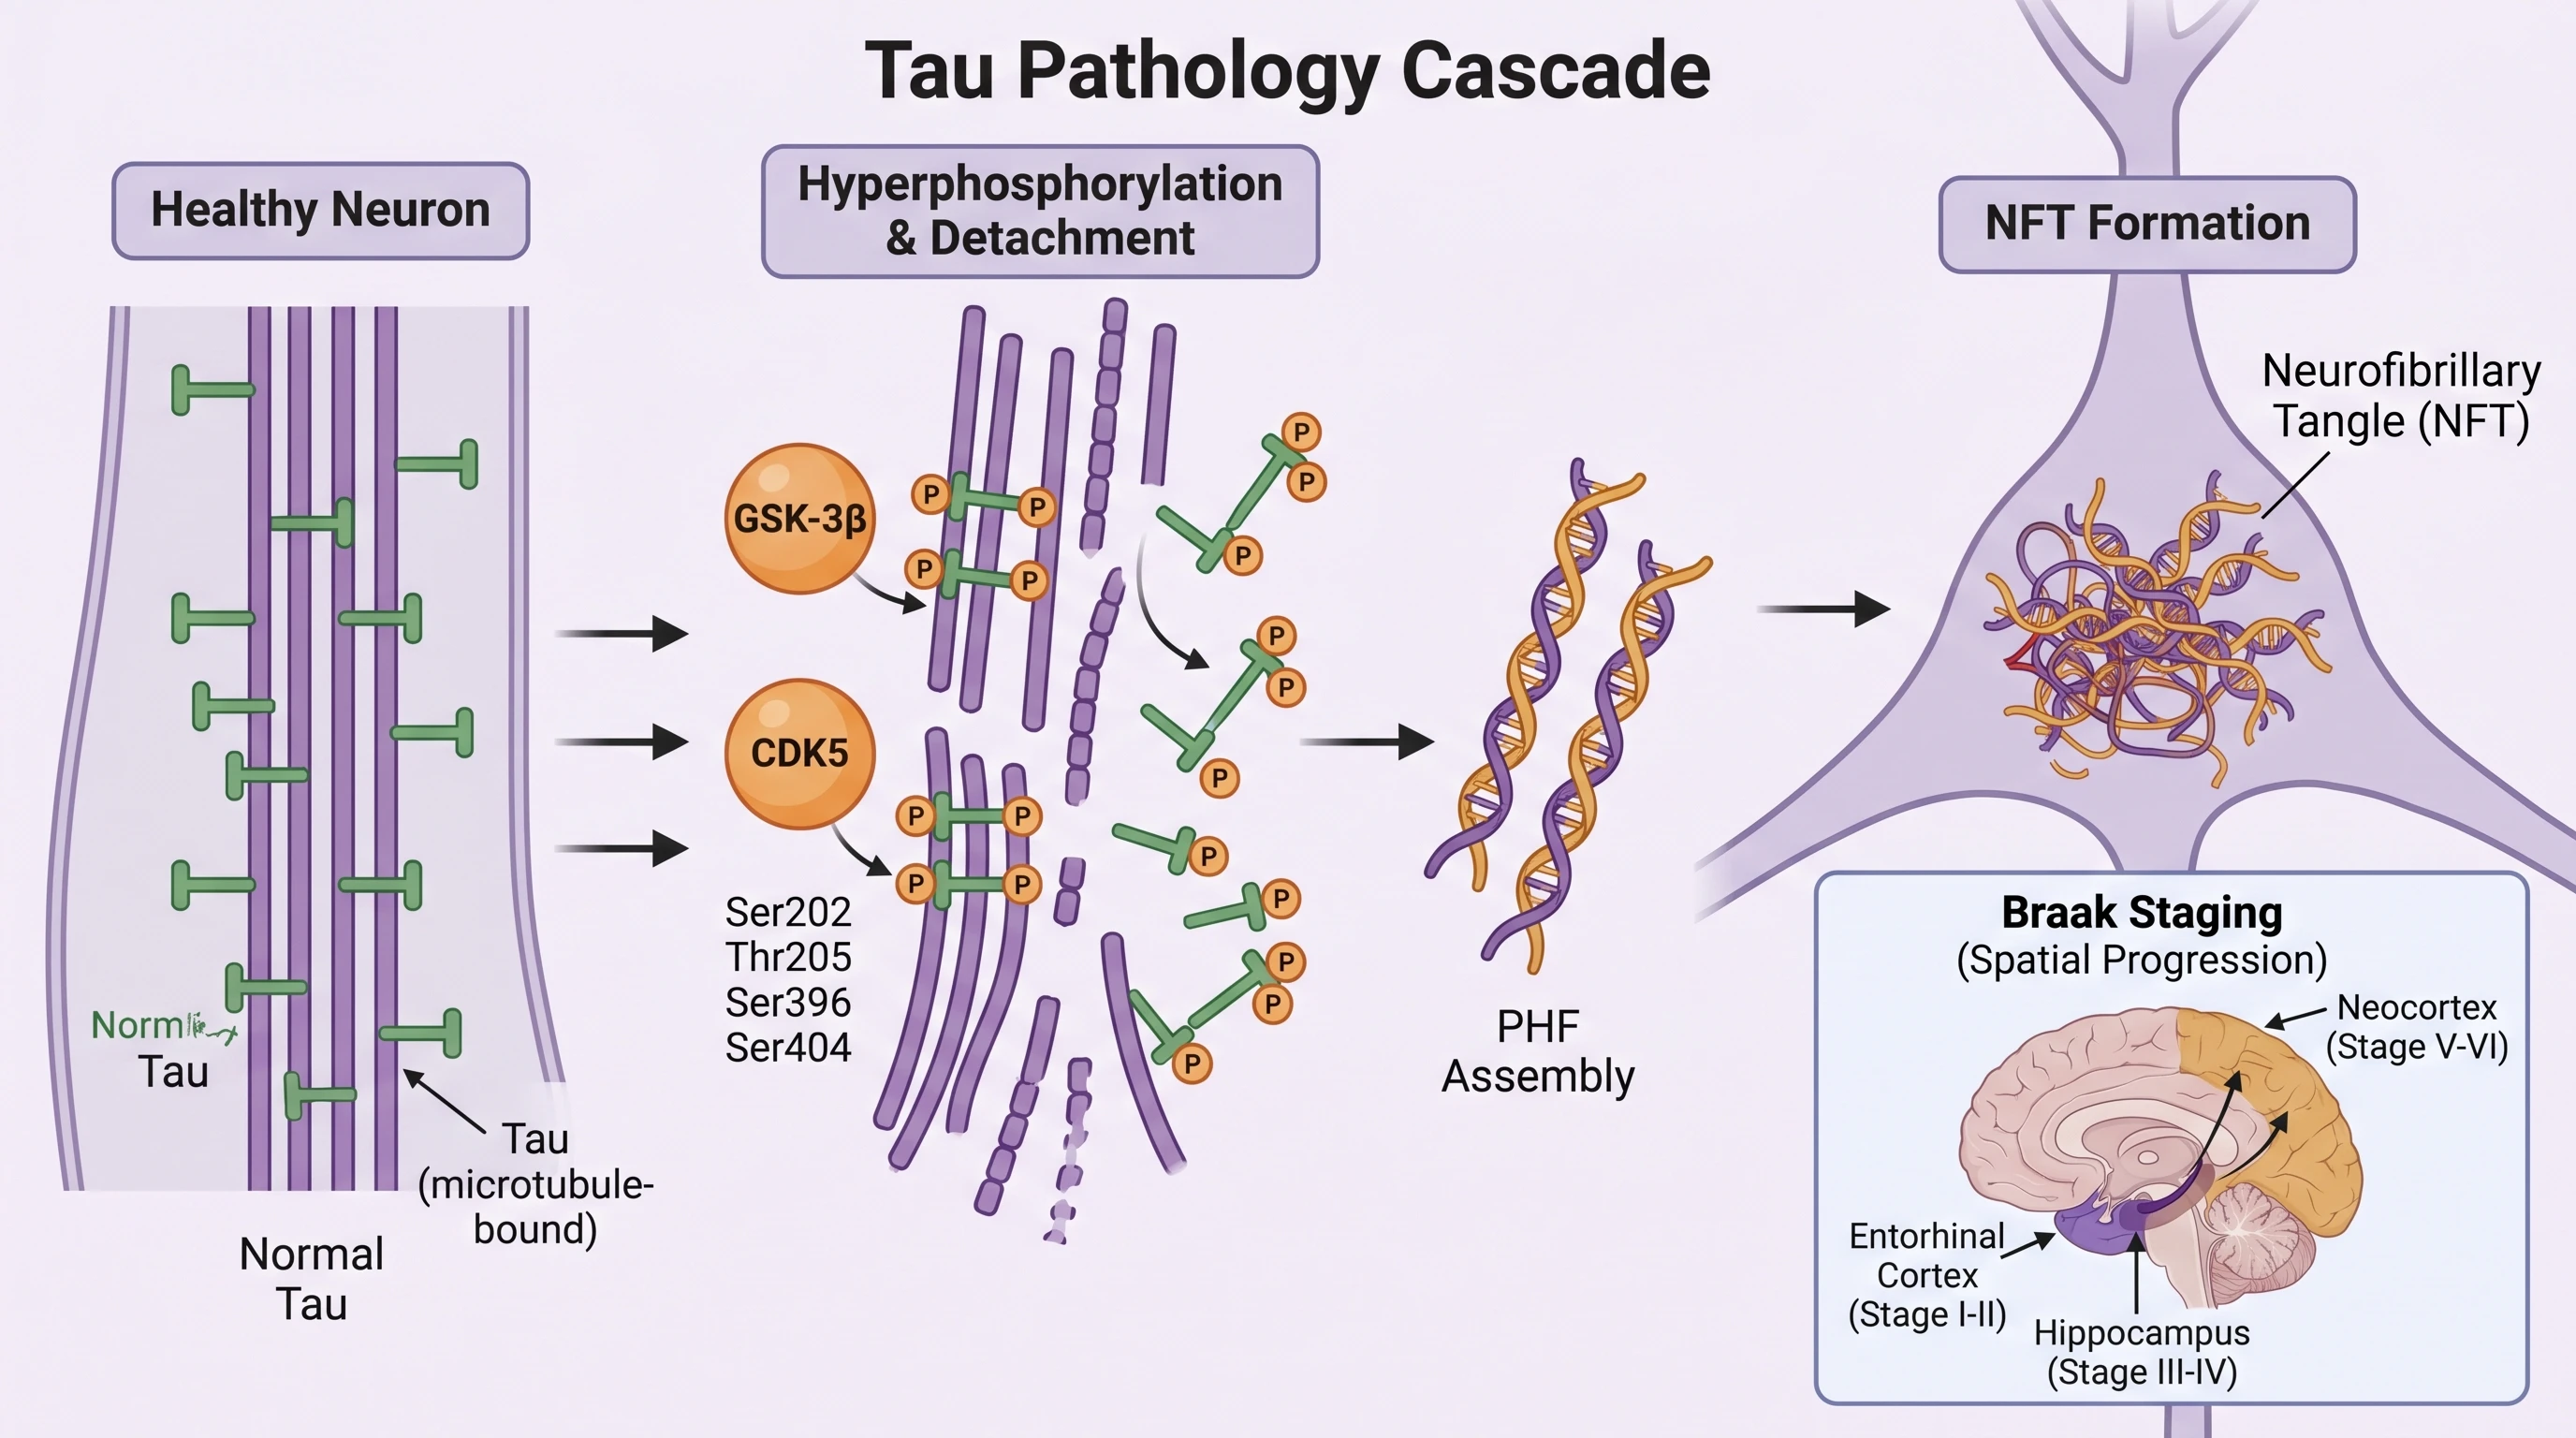
Non-negotiable correctness checks: phosphorylation arrows point from kinase to tau (kinase adds, phosphatase removes); tau attached to microtubules in the healthy state and detached in disease; PHFs and NFTs inside the neuronal cytoplasm, never extracellular.
5. The Amyloid Cascade Hypothesis Visualized
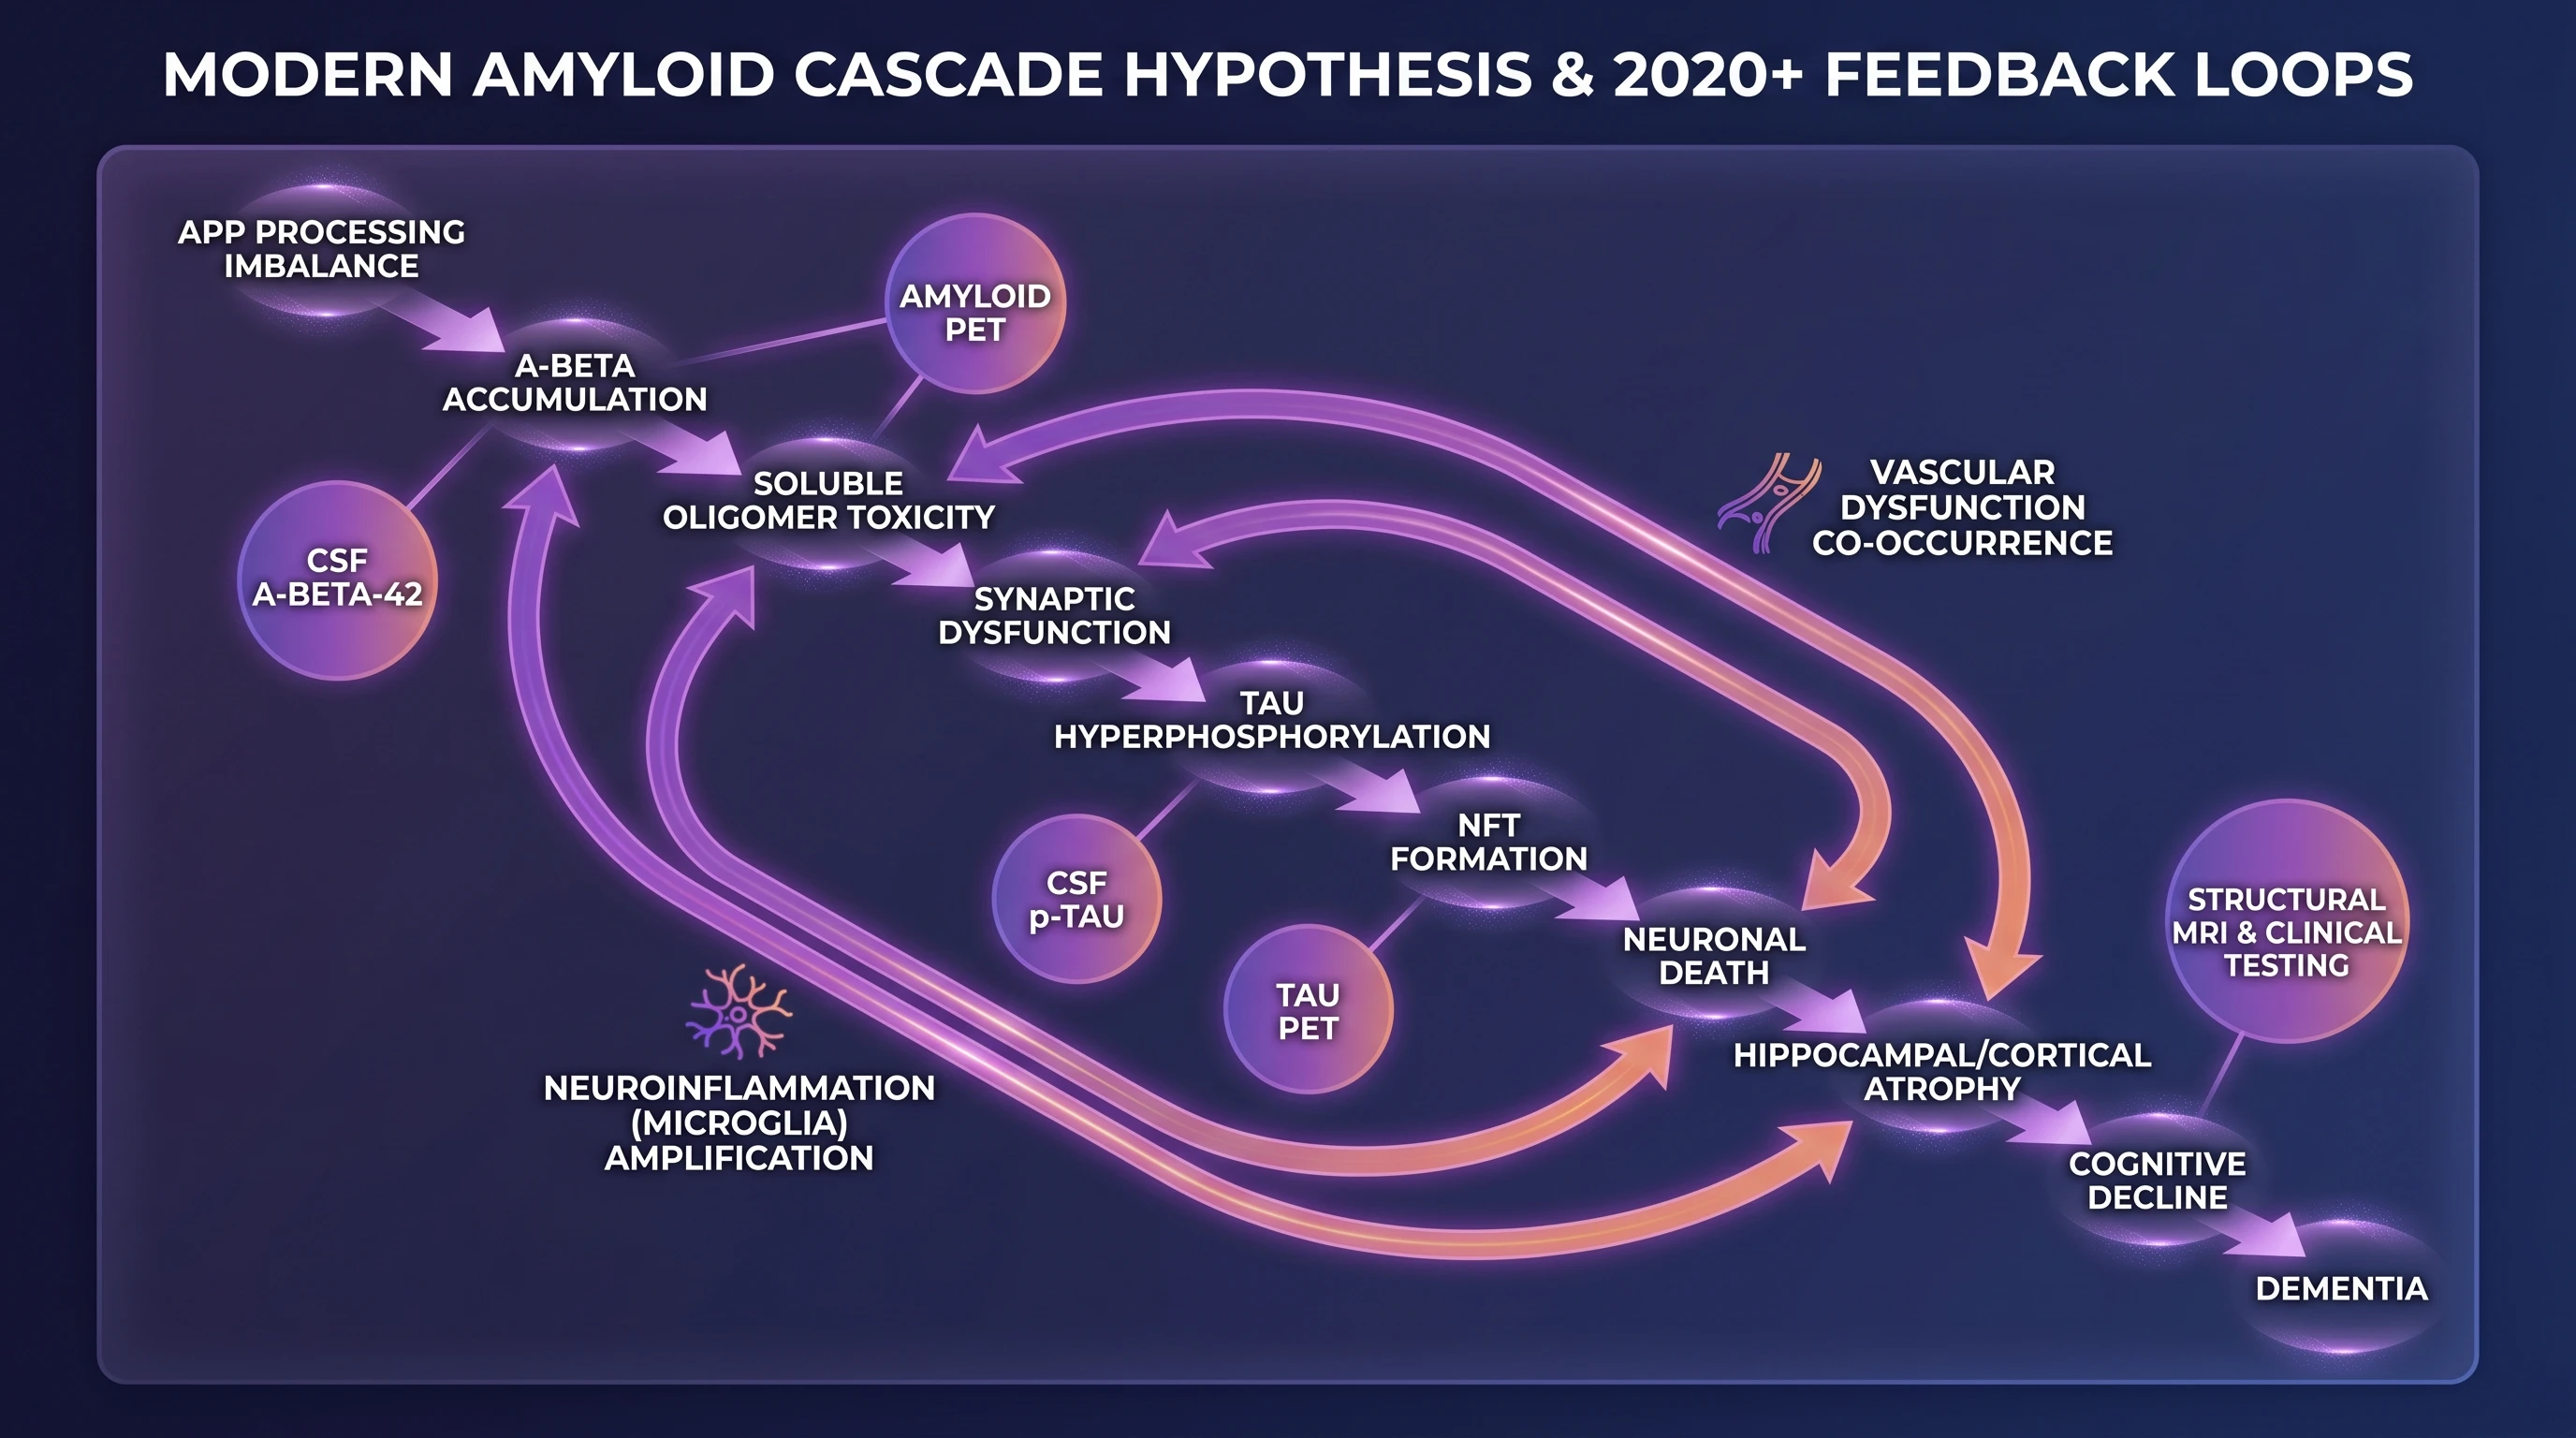
The canonical chain: APP processing imbalance produces excess Aβ → Aβ aggregates through the four stages → soluble oligomers drive synaptic dysfunction → tau hyperphosphorylation downstream of Aβ → NFT formation → neuronal death → hippocampal/cortical atrophy → cognitive decline → dementia.
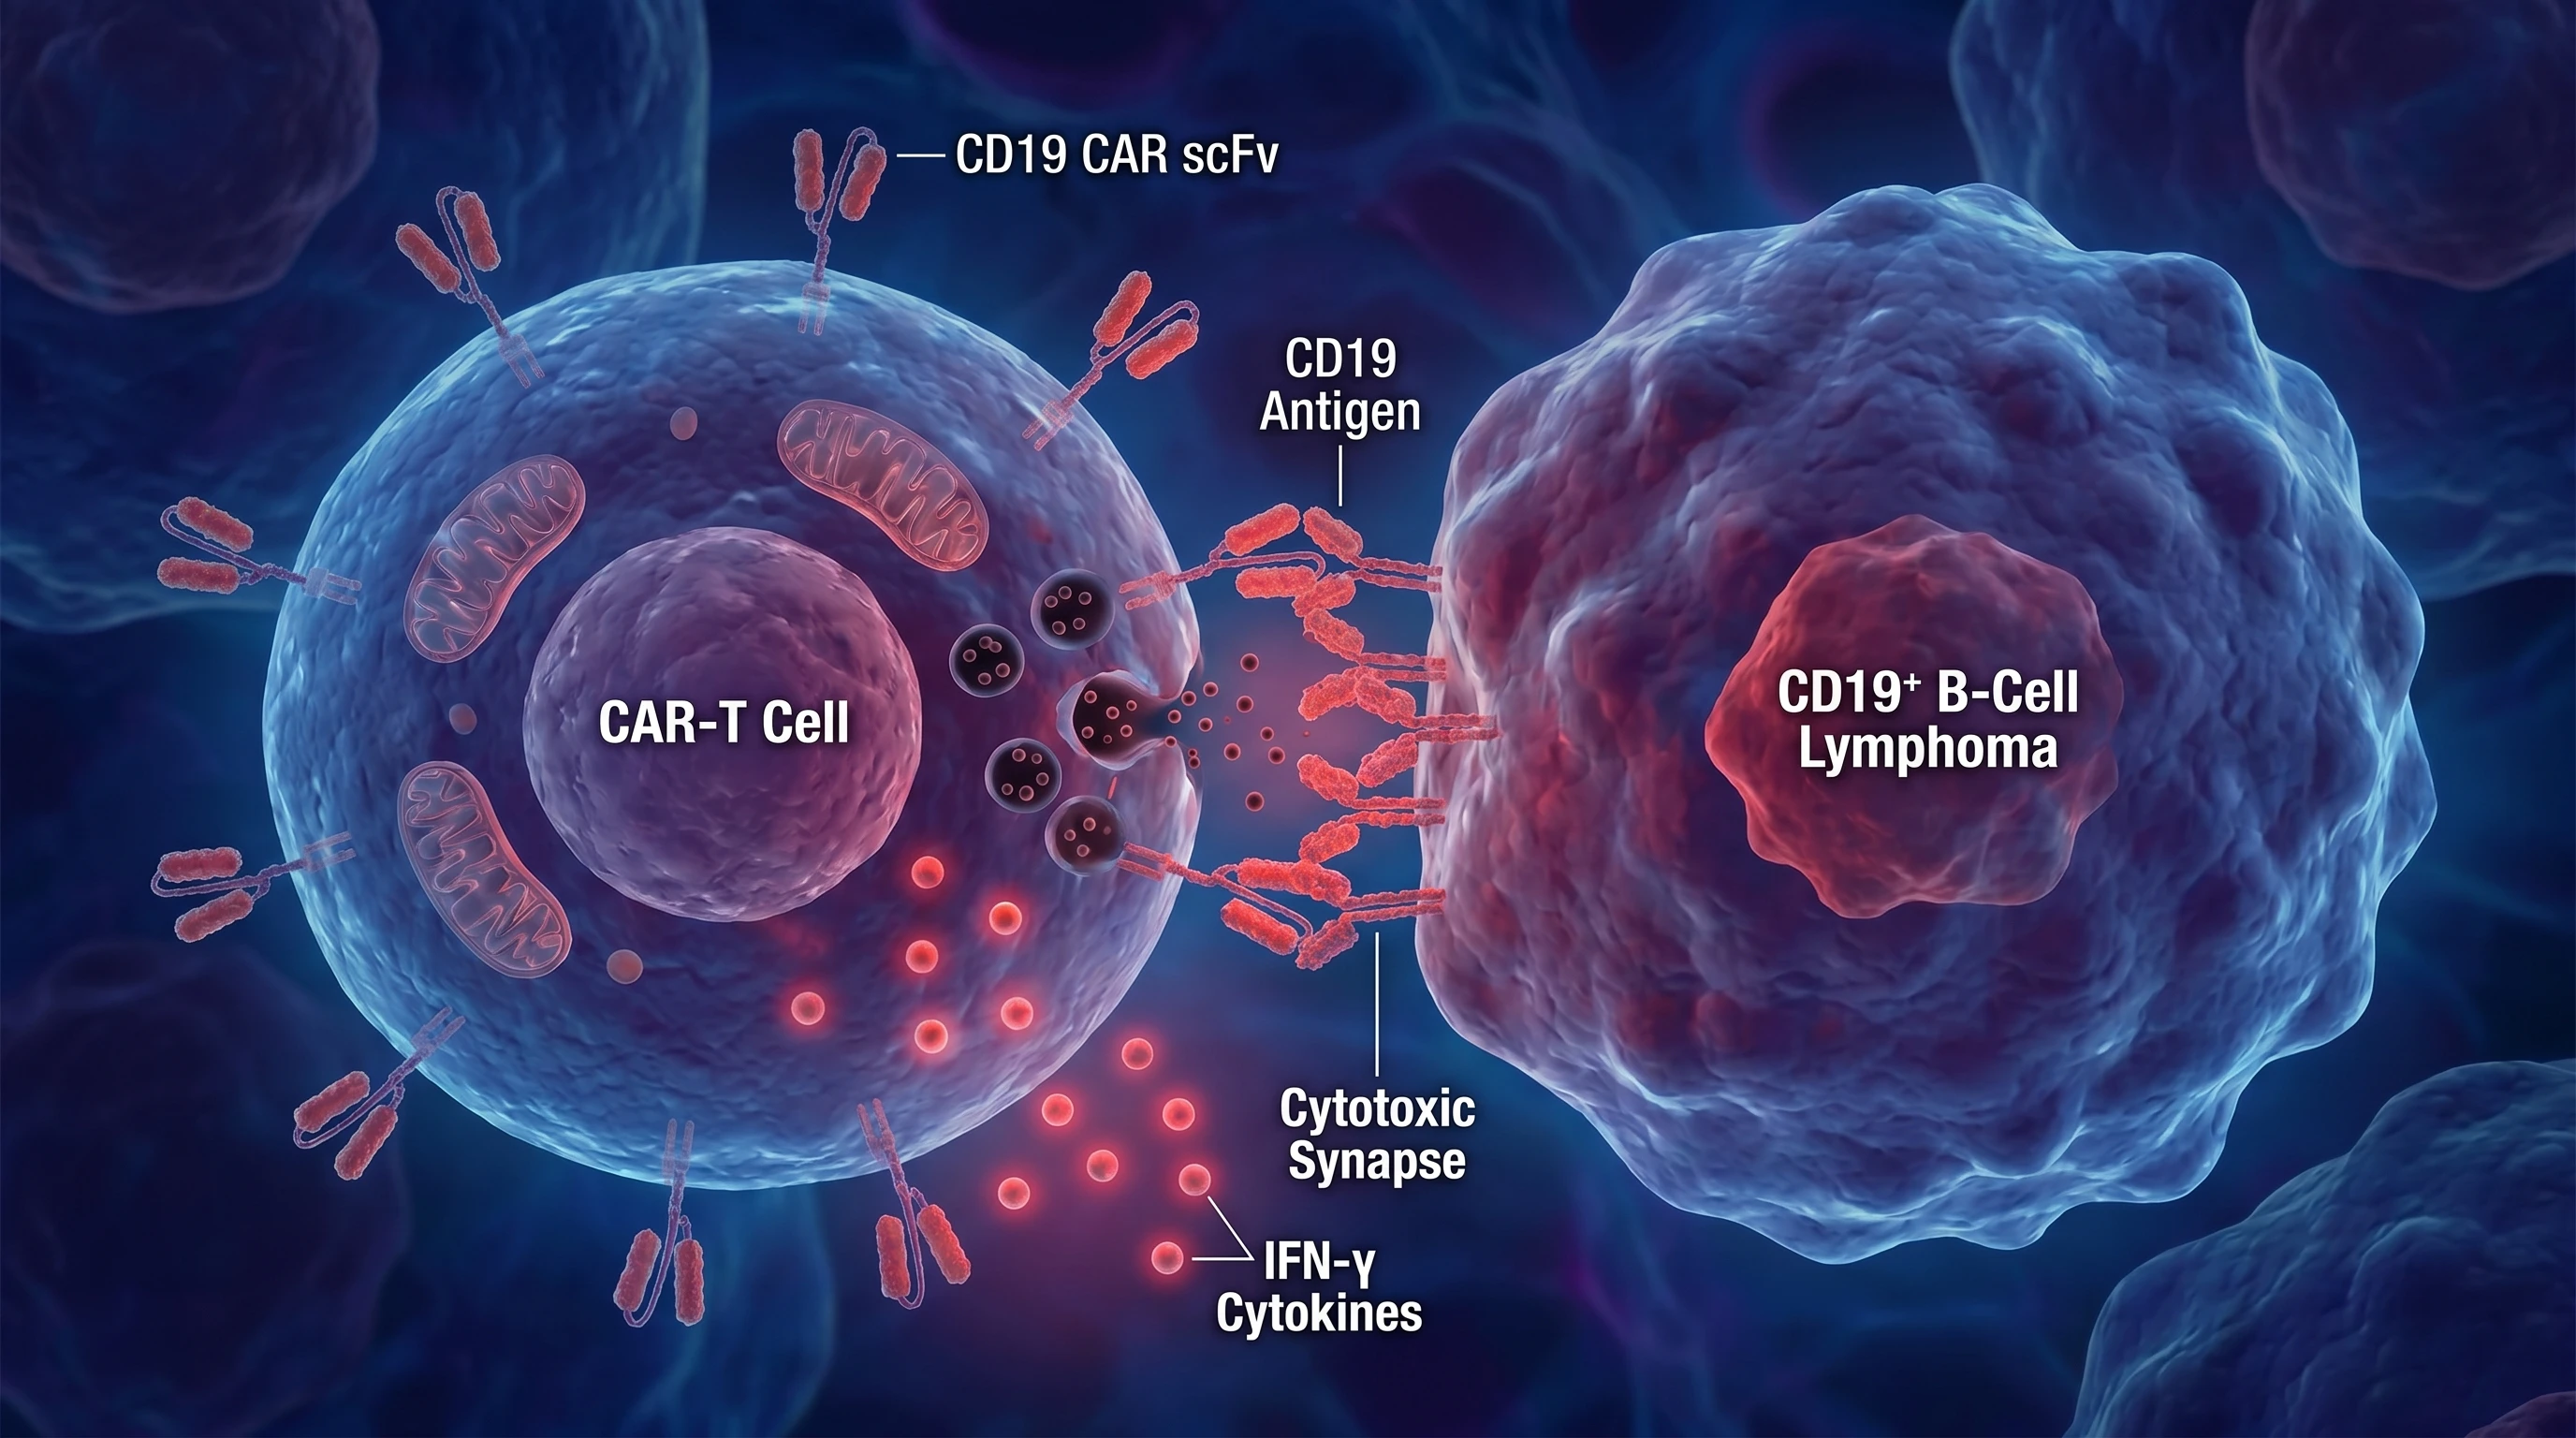
6. Anti-Amyloid Antibodies (Lecanemab and Donanemab) Mechanism
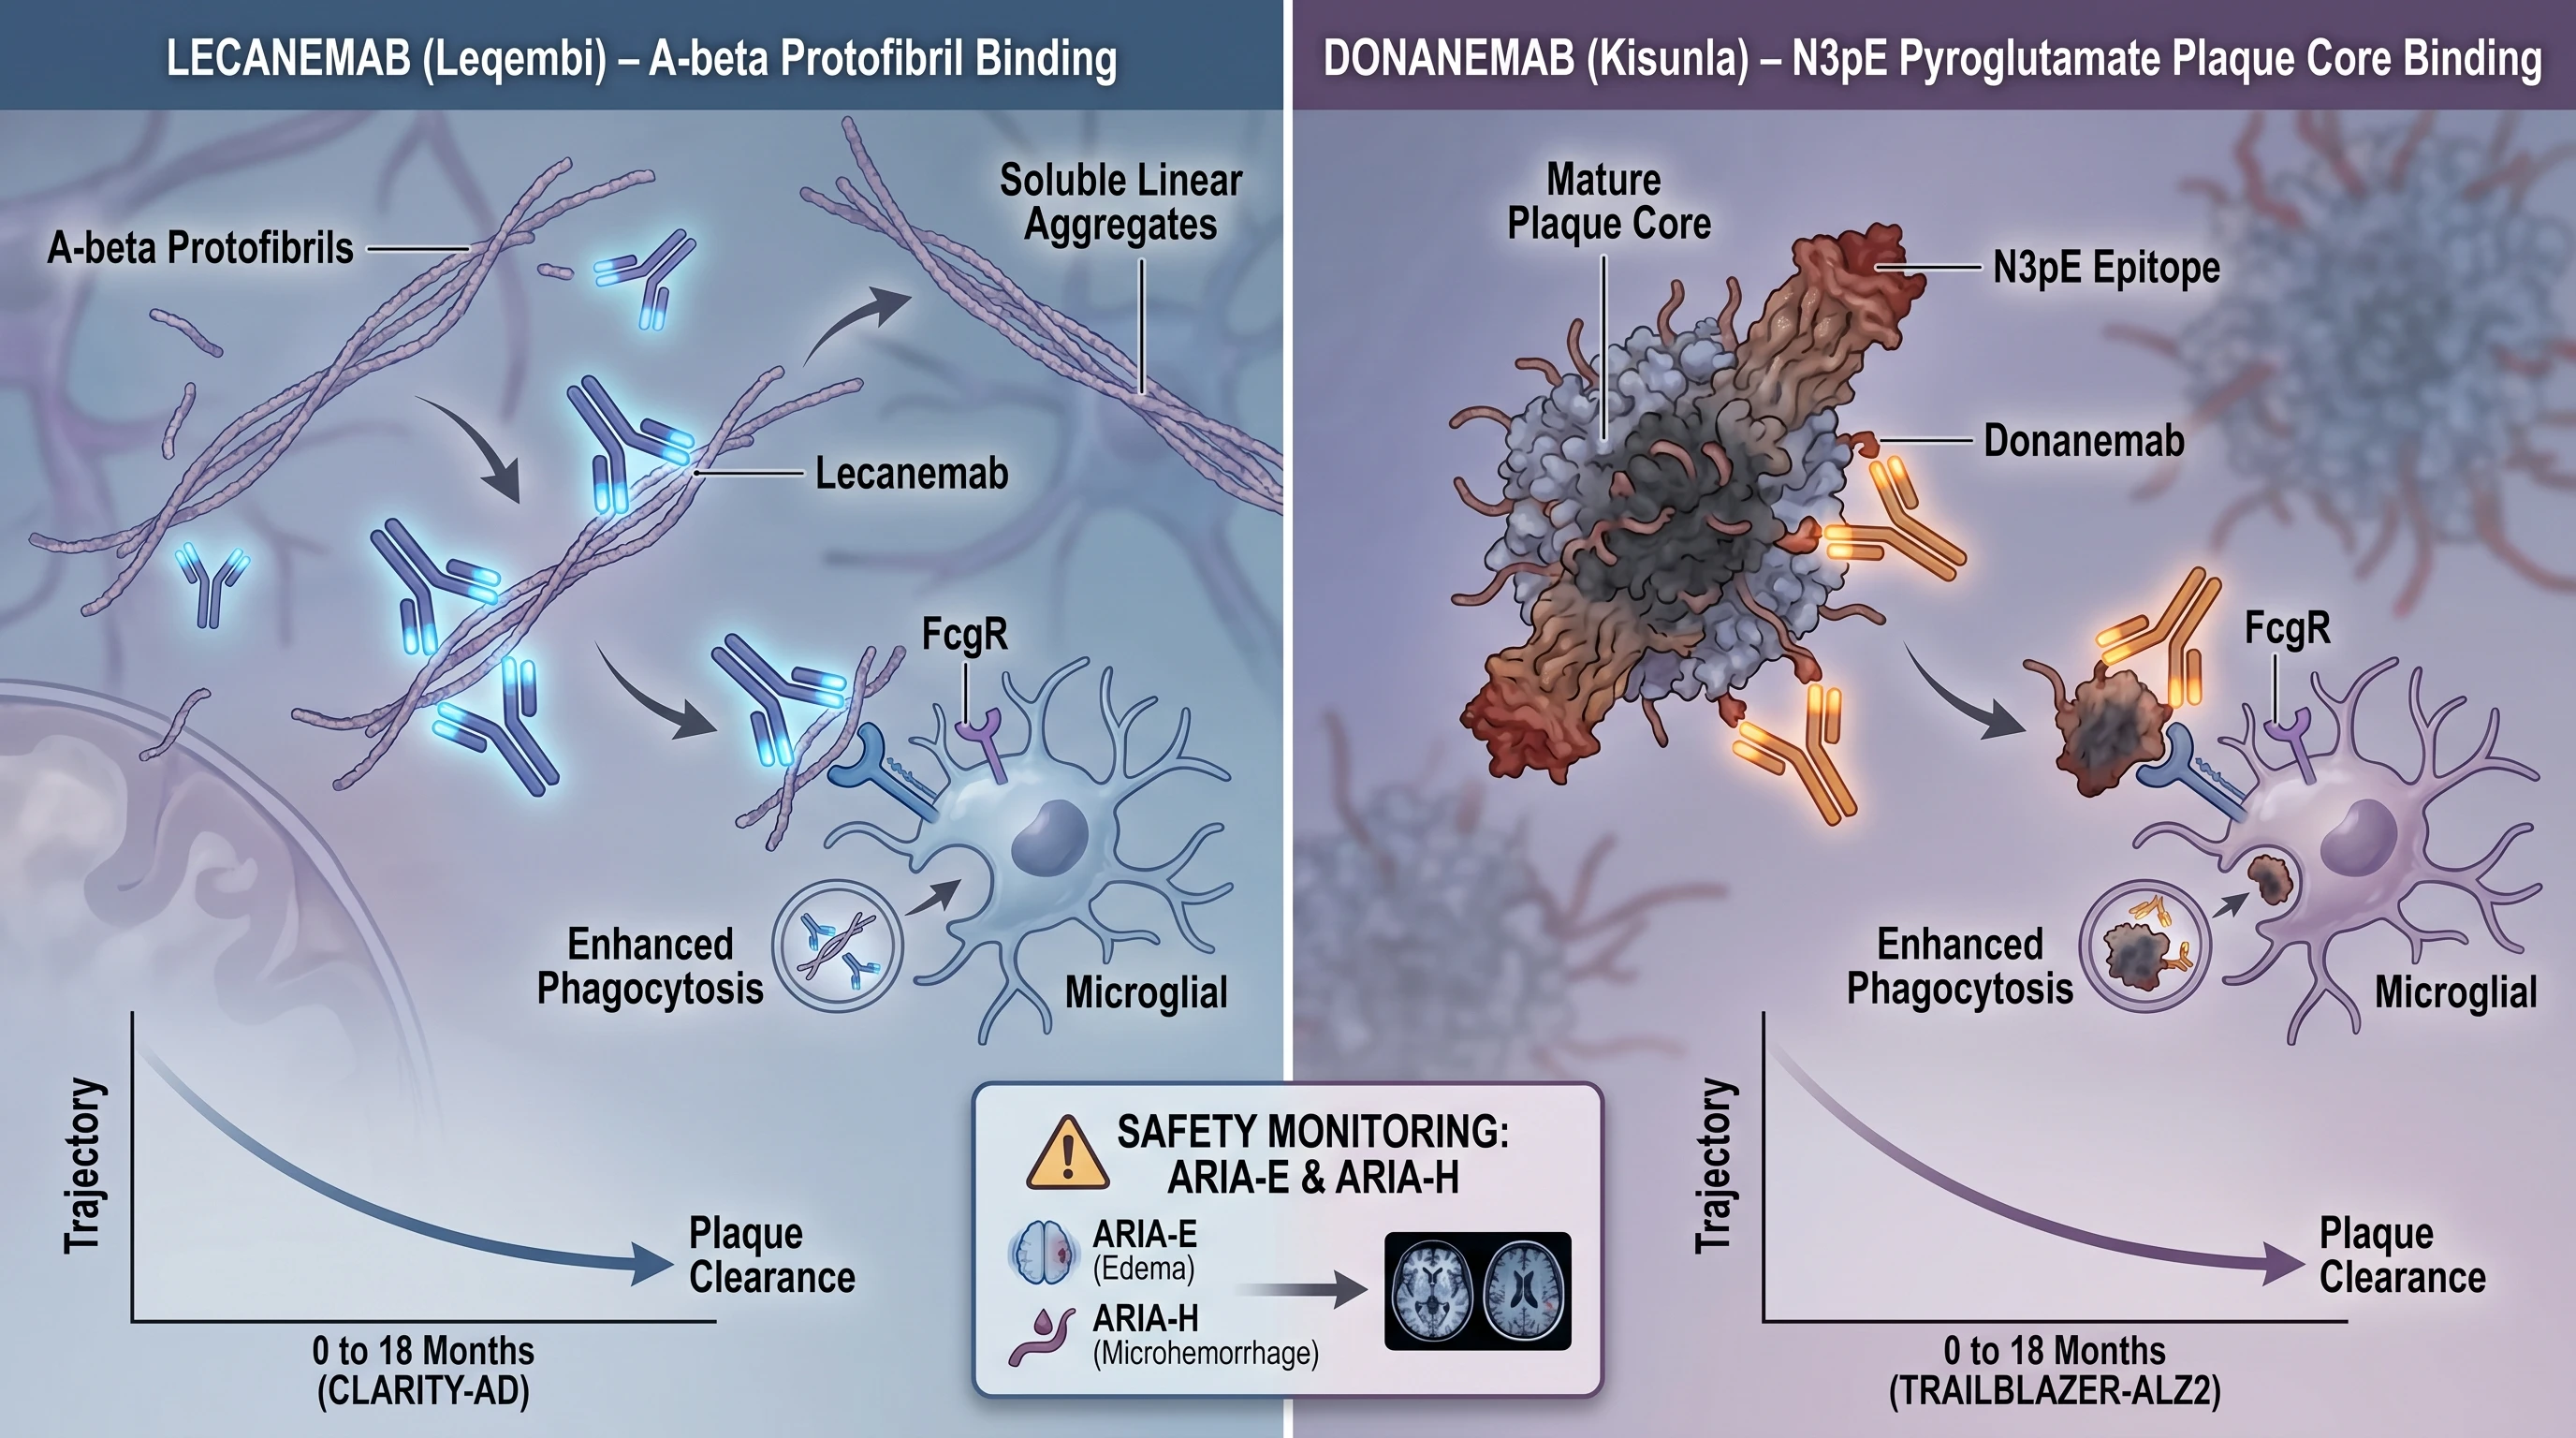
Anti-amyloid antibodies are the most reviewed topic of the AAIC 2026 cycle, and the side-by-side MOA figure is one of the highest-value figures you can put on a disease-modifying therapy poster.
Both antibodies share a downstream mechanism after target engagement: the Fc domain engages microglial Fcγ receptors, microglia phagocytose the antibody-bound Aβ, and plaque burden on amyloid PET decreases substantially over 12-18 months. They differ in which Aβ species they remove — lecanemab depletes the soluble protofibril pool upstream of plaque formation, donanemab strips down already-formed plaque cores.
7. Anti-Tau Therapies: Antibody and ASO Approaches
Anti-tau therapeutics lag anti-amyloid clinically but represent a substantial fraction of the AAIC 2026 Drug Development pipeline. The figure design problem is twofold: showing extracellular versus intracellular targeting strategies, and showing pre-tangle versus post-tangle intervention windows.
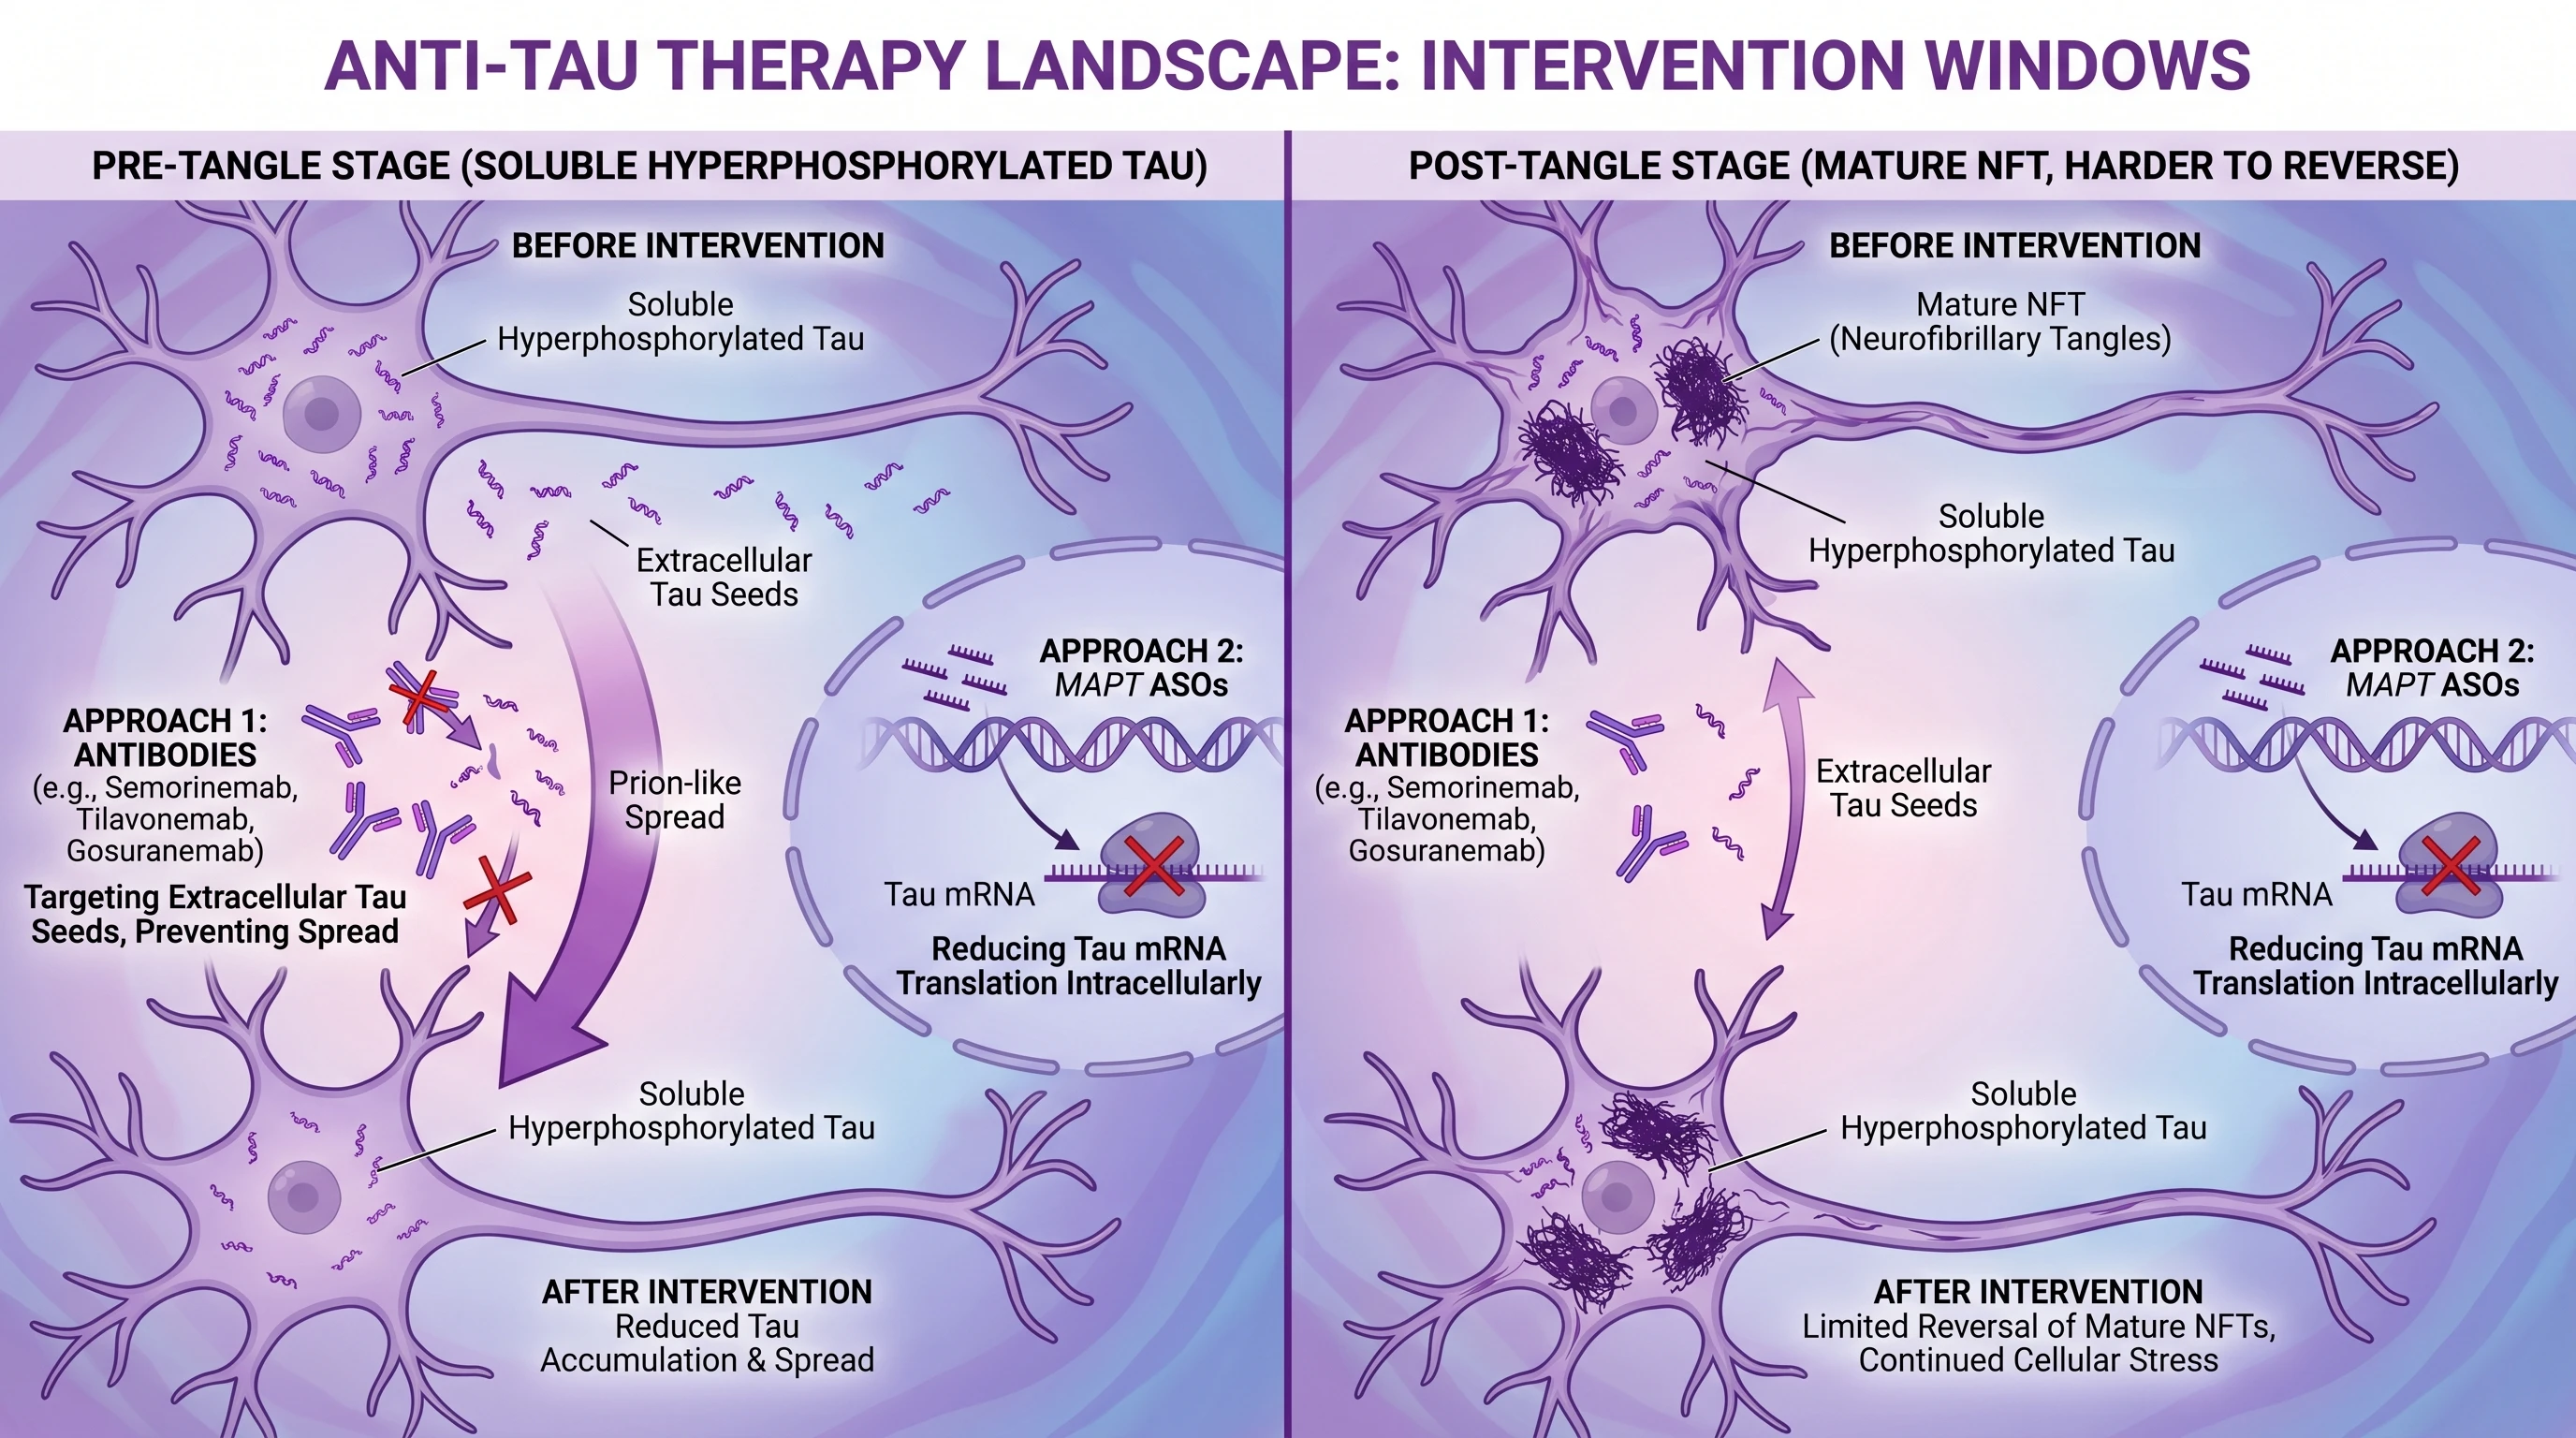
The pre-tangle versus post-tangle distinction is what the figure most needs to convey. Pre-tangle disease — soluble hyperphosphorylated tau, few mature NFTs — is the intervention window where both antibody and ASO strategies remain mechanistically plausible. Post-tangle disease (established intraneuronal NFTs) is much harder to reverse, and current trials increasingly stratify by tau PET burden to enrich for the pre-tangle window.
8. From Prompt to Publication-Ready: SciFig Workflow for Amyloid-Tau Mechanism Diagrams
You are drafting the APP processing panel. You ask a generic image model to "show APP cleavage by alpha, beta, and gamma secretase." The model produces a panel with α-secretase pointing into the amyloidogenic pathway as the first step. Anyone who has read a review article spots the error in five seconds — α-secretase is the non-amyloidogenic enzyme, cleaving within the Aβ domain and preventing Aβ from being released. With that one arrow misplaced, reviewer confidence in the rest of your figure collapses. You re-roll; the next version mislabels CTFβ. You re-roll again; γ-secretase is drawn as extracellular. The figure stays wrong in a different place every time.
This is not a single-tool failure. It is the technical state of generative AI on complex mechanism diagrams: training corpora skew toward popularly described mechanisms rather than carefully ordered textbook diagrams; models are not built around the molecular grammar neuroscientists use; and secretase directionality, kinase versus phosphatase activity, intracellular versus extracellular compartments, and Aβ aggregation stages are all decisions where models produce syntactically valid wrong answers. In mechanism work, 99% correct equals 0% — one reversed arrow tells the reviewer the underlying biology is not understood.
SciFig is built for exactly this gap. Best-in-class image generation models bring the first pass to a high-fidelity starting point — the four-stage cascade, APP branch logic, the tau phosphorylation map, the lecanemab-versus-donanemab side-by-side — most of which is topologically correct on draft one. For the precision details that matter most — α-versus-β secretase ordering, intracellular versus extracellular tau, the specific Aβ species lecanemab binds — an editable vector canvas lets you click any label and rename it, drag any arrow and reverse its direction, swap α-secretase for β without rerolling. Sketch-to-figure preserves a topology you draw on paper or whiteboard. The entire workflow stays inside SciFig — one-click export to editable PowerPoint, layered SVG, or 8K PNG for A0 poster printing. No roundtrip to Illustrator.
See AI Scientific Figure Generation in Action
Watch how researchers create publication-ready scientific figures from text descriptions.
Explore the ToolHere is the path. Copy this prompt verbatim into SciFig's Text-to-Figure tool to start the APP processing figure:
APP (amyloid precursor protein) processing diagram showing membrane-bound
APP with cleavage sites. Left side: non-amyloidogenic pathway, alpha-secretase
(ADAM10) cleaves within the Abeta domain producing sAPP-alpha plus CTF-alpha,
followed by gamma-secretase producing p3 plus AICD. Right side: amyloidogenic
pathway, beta-secretase (BACE1) cleaves at the N-terminus producing sAPP-beta
plus CTF-beta, followed by gamma-secretase (presenilin complex) generating
Abeta40 (90%) and Abeta42 (10%) plus AICD. Color-coded enzymes, side-by-side
comparison, publication-ready style.
9. Common Mistakes When Drawing Amyloid-Tau Diagrams
The errors reviewers spot most often in amyloid-tau poster figures fall into five categories.
- Aβ40 versus Aβ42 ratio drawn incorrectly — In healthy brain, Aβ40 dominates Aβ42 roughly 9:1. In AD, the ratio shifts toward Aβ42, but Aβ40 still represents the majority of total Aβ. Kuperstein et al. 2010 (Accessed 2026-05-22) establishes the toxicity relevance of the Aβ42/Aβ40 ratio. A figure drawing Aβ42 as the majority species in any context misrepresents the biology.
- Neurofibrillary tangles drawn extracellularly — NFTs are by definition intracellular, forming inside pyramidal neurons from PHFs of hyperphosphorylated tau. Drawing them adjacent to plaques in extracellular space is the most common topology error in AI-generated AD figures.
- Lecanemab's target mislabeled as plaque core — Lecanemab binds soluble Aβ protofibrils. Drawing lecanemab pointing at the dense plaque core is the donanemab target. The figure must show that the two antibodies remove different Aβ species.
- Tau phosphorylation arrow direction errors — Kinases (GSK-3β, CDK5) add phosphate groups; phosphatases (PP2A) remove them. Reversing arrow direction reverses meaning. AT8 (Ser202/Thr205), Ser396, and Ser404 are added by kinases, not phosphatases.
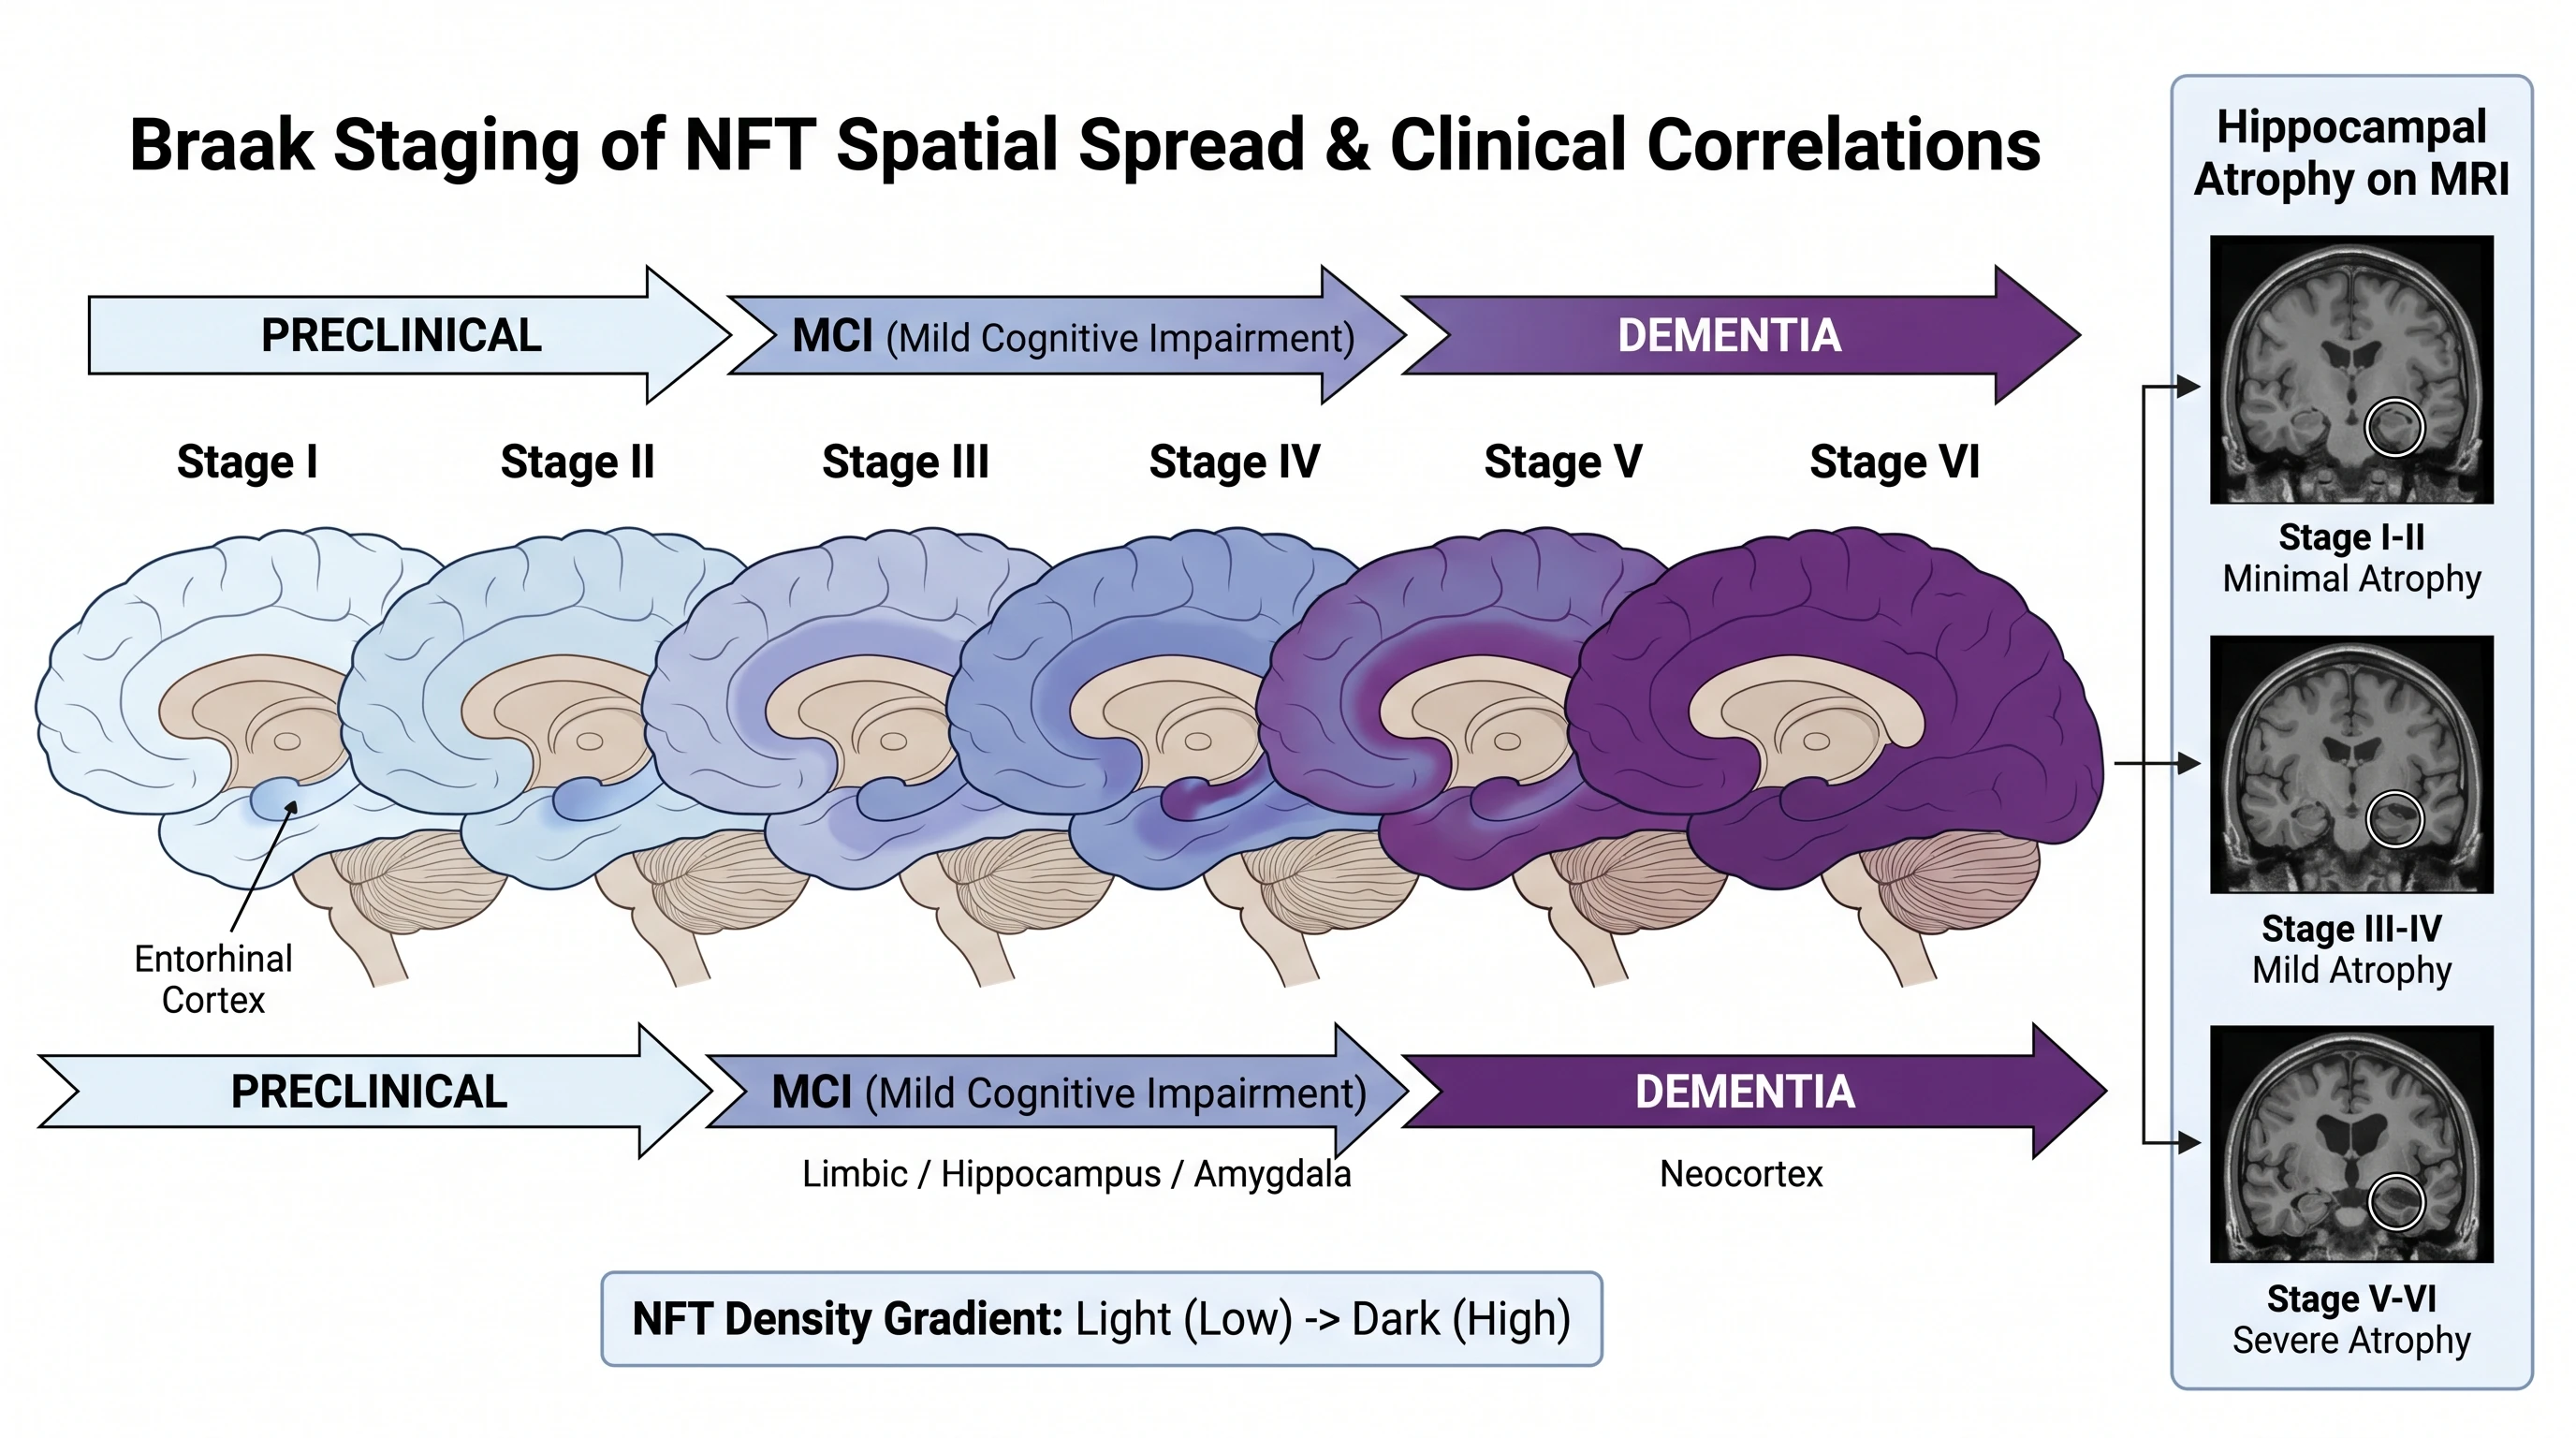
- Hippocampus and entorhinal cortex anatomical confusion — Entorhinal cortex is the medial temporal cortical structure adjacent to the hippocampus; the hippocampus proper sits medial to it. Stage I-II involves transentorhinal/entorhinal regions, stage III-IV expands into hippocampus and limbic structures, stage V-VI reaches neocortex. Labeling hippocampus as the stage I site misrepresents the anatomical sequence.
10. Free Trial CTA + Related Reading: 7 Copy-Paste Amyloid-Tau Prompts
The seven remaining SciFig prompts for the figures in this article. Copy any of them directly into Text-to-Figure.
Four-stage Abeta aggregation pathway diagram: Stage 1 monomer (40 or 42
amino acid peptide), Stage 2 soluble oligomer (most neurotoxic species,
trimers and dodecamers), Stage 3 protofibril (linear fibrillar aggregate,
lecanemab binding target), Stage 4 mature dense-core plaque (donanemab
N3pE pyroglutamate target). Horizontal flow with size scale bar and
toxicity gradient annotated, color-coded by stage, publication style.
Tau pathology cascade: normal tau bound to axonal microtubules then
hyperphosphorylation by GSK-3-beta and CDK5 kinases at key sites Ser202,
Thr205, Ser396, Ser404, then tau detachment from microtubules, then
microtubule destabilization, then paired helical filament (PHF) assembly,
then neurofibrillary tangle (NFT) formation in pyramidal neuron cytoplasm.
Inset showing Braak staging spatial progression entorhinal cortex to
hippocampus to neocortex.
Modern amyloid cascade hypothesis flowchart: Abeta accumulation from APP
processing imbalance, then soluble oligomer toxicity, then synaptic
dysfunction, then tau hyperphosphorylation, then NFT formation, then
neuronal death, then hippocampal and cortical atrophy, then cognitive
decline, then dementia. Add 2020 revisions: neuroinflammation microglia
feedback loop, vascular dysfunction co-occurrence. Annotate biomarker
measurement points CSF Abeta42, p-tau, amyloid PET, tau PET.
Side-by-side comparison of two anti-amyloid antibodies. Left panel:
lecanemab (Leqembi) binds Abeta protofibrils, soluble linear aggregates,
preventing further fibrillogenesis. Right panel: donanemab (Kisunla)
binds N3pE pyroglutamate-modified Abeta epitope present only in mature
plaque cores. Both engage Fc-gamma receptors on microglia leading to
enhanced phagocytosis and plaque clearance over 18 months. Inset on
ARIA-E (edema) and ARIA-H (microhemorrhage) safety monitoring.
Anti-tau therapy landscape. Approach 1: antibodies (semorinemab,
tilavonemab, gosuranemab) targeting extracellular tau seeds, preventing
prion-like spread between neurons. Approach 2: MAPT antisense
oligonucleotides reducing tau mRNA translation intracellularly. Show
pre-tangle stage (soluble hyperphosphorylated tau) versus post-tangle
stage (mature NFT) intervention windows. Cellular illustration with
clear before and after states.
Braak staging of NFT spatial spread across 6 stages on lateral brain
cross-section: Stage I-II transentorhinal and entorhinal cortex, Stage
III-IV limbic and hippocampus and amygdala, Stage V-VI neocortex. Color
gradient from light to dark showing NFT density progression. Correlate
stages with clinical severity: I-II preclinical, III-IV MCI, V-VI
dementia. Side panel showing hippocampal atrophy on MRI at each stage.
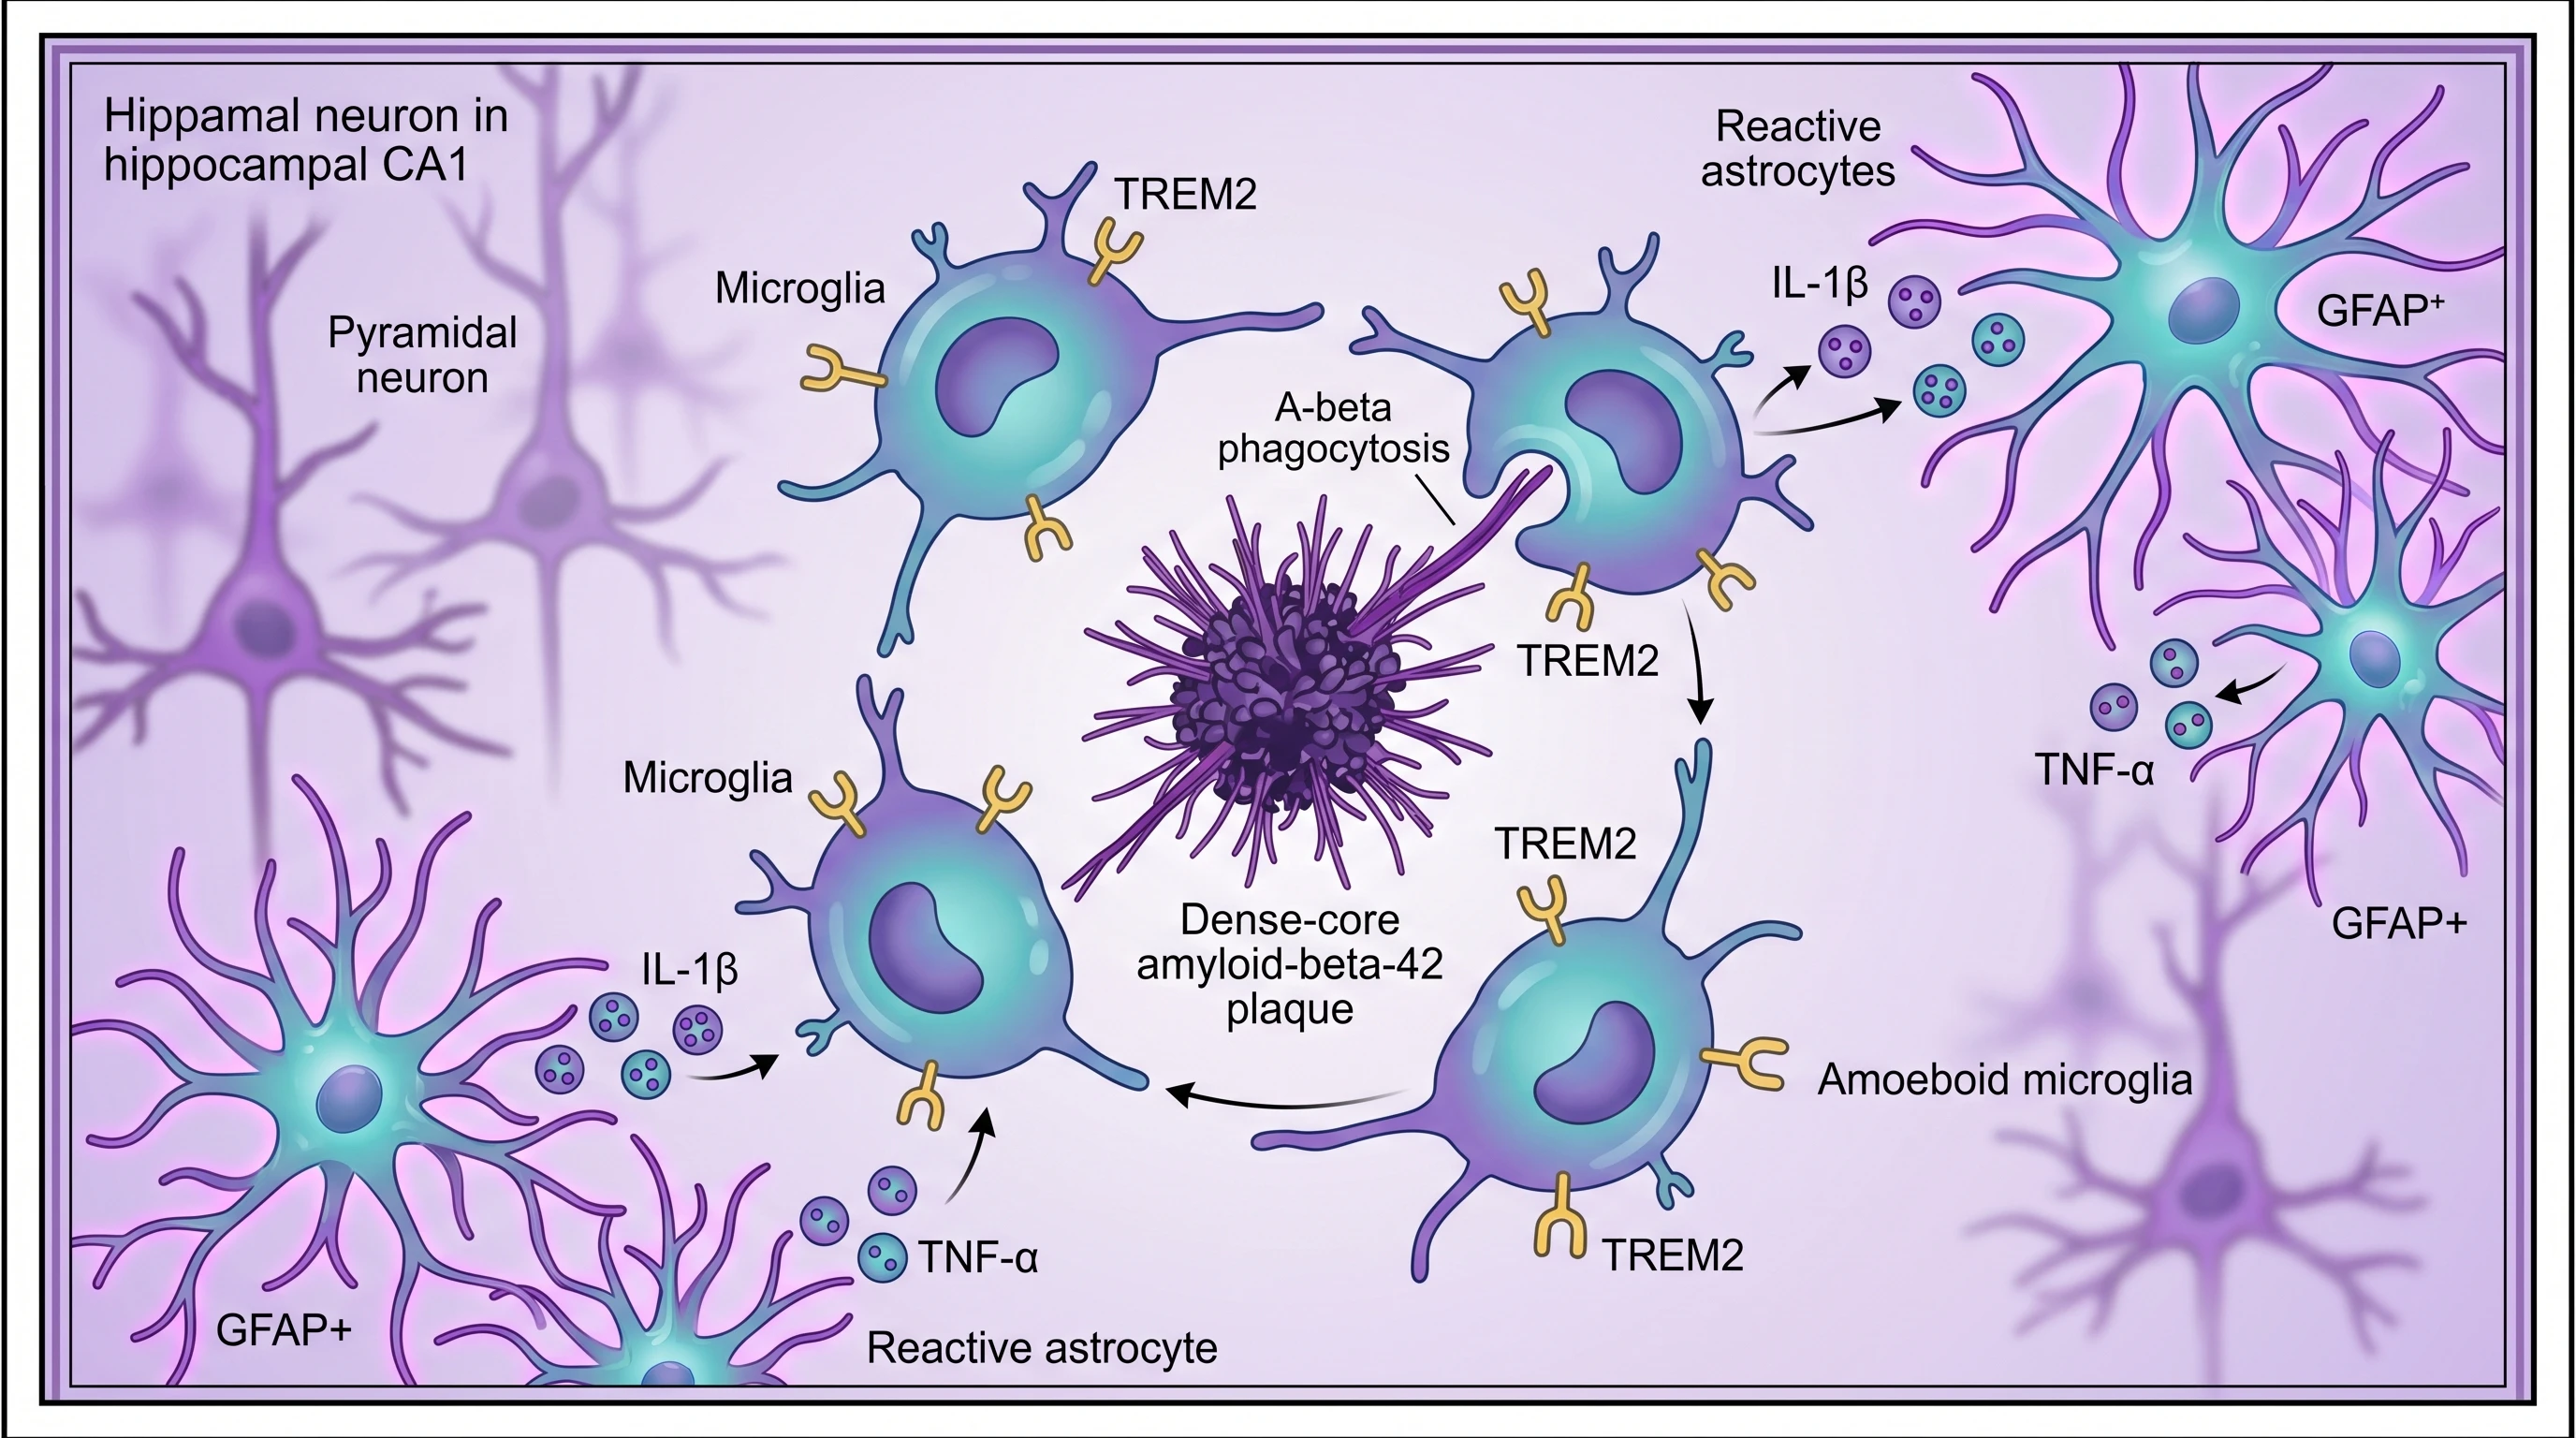
Detailed scientific figure of Alzheimer's disease pathology:
hippocampal CA1 region cross-section showing dense-core amyloid-beta
plaques in extracellular space (Abeta42 fibrils), intracellular tau
neurofibrillary tangles inside pyramidal neurons with characteristic
flame-shape morphology, activated microglia engulfing plaques, reactive
astrocytes nearby. Healthy neurons in background for contrast. Deep
purple and amber color palette, publication-style.
Create Scientific Figures Now
Describe your scientific figure in natural language — get publication-ready illustrations in minutes.
Try Free