Design a winning AAIC 2026 poster: 3-second test, visual hierarchy, hero figure, 5 bad-vs-winning examples, ISTAART standards, 1-hour AI workflow.
SciFig Team
SciFig editorial team
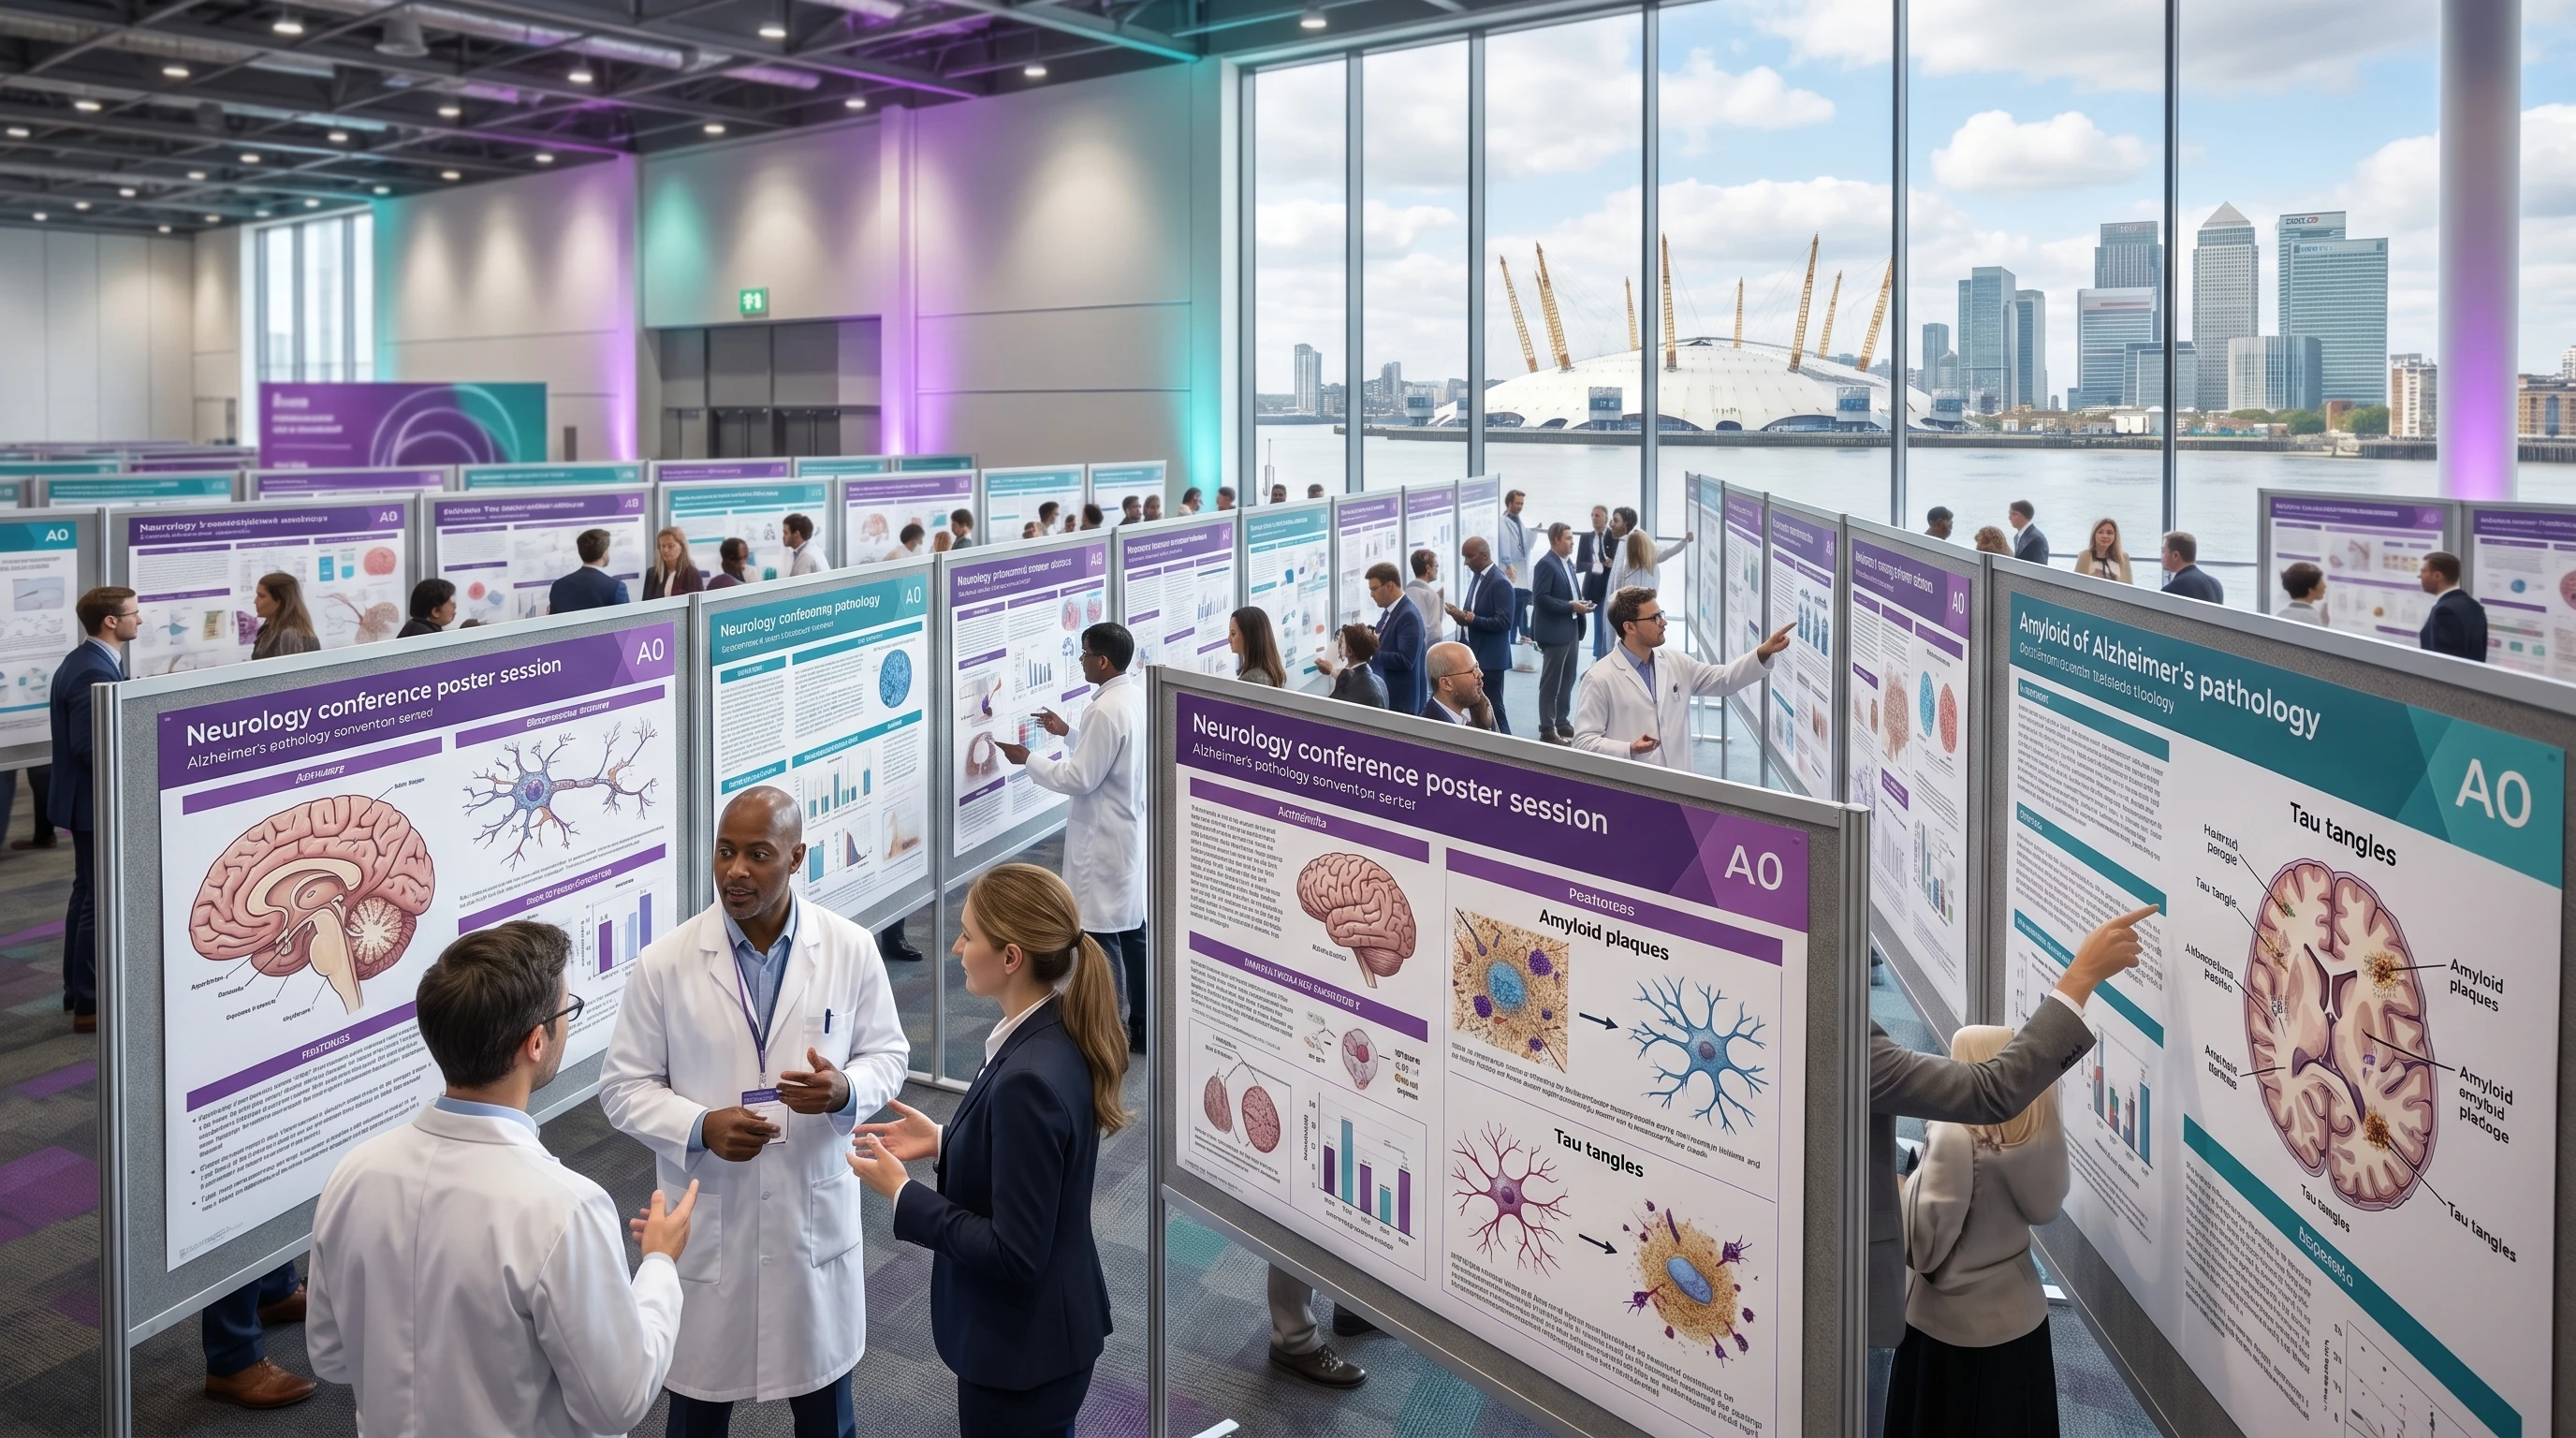
Two AAIC posters sit two meters apart in the ExCeL London hall. They cover similar dementia science — different cohorts, similar question, comparable rigor. One has a steady cluster of delegates engaging with the presenter throughout the viewing hour. The other has a single person glancing at it on the way to a coffee break. The science is not what separates them. The visual design is.
Every AAIC-accepted author hits the same practical question in Week 6 after a late-March acceptance: not what to put on the poster (your abstract decided that) but how to compose it so it earns attention in a hall of several thousand competitors.
This guide covers the 3-second test, visual hierarchy for a single hero figure, five bad-versus-winning examples, and an AI-assisted workflow for revising a figure around the result you want readers to remember.
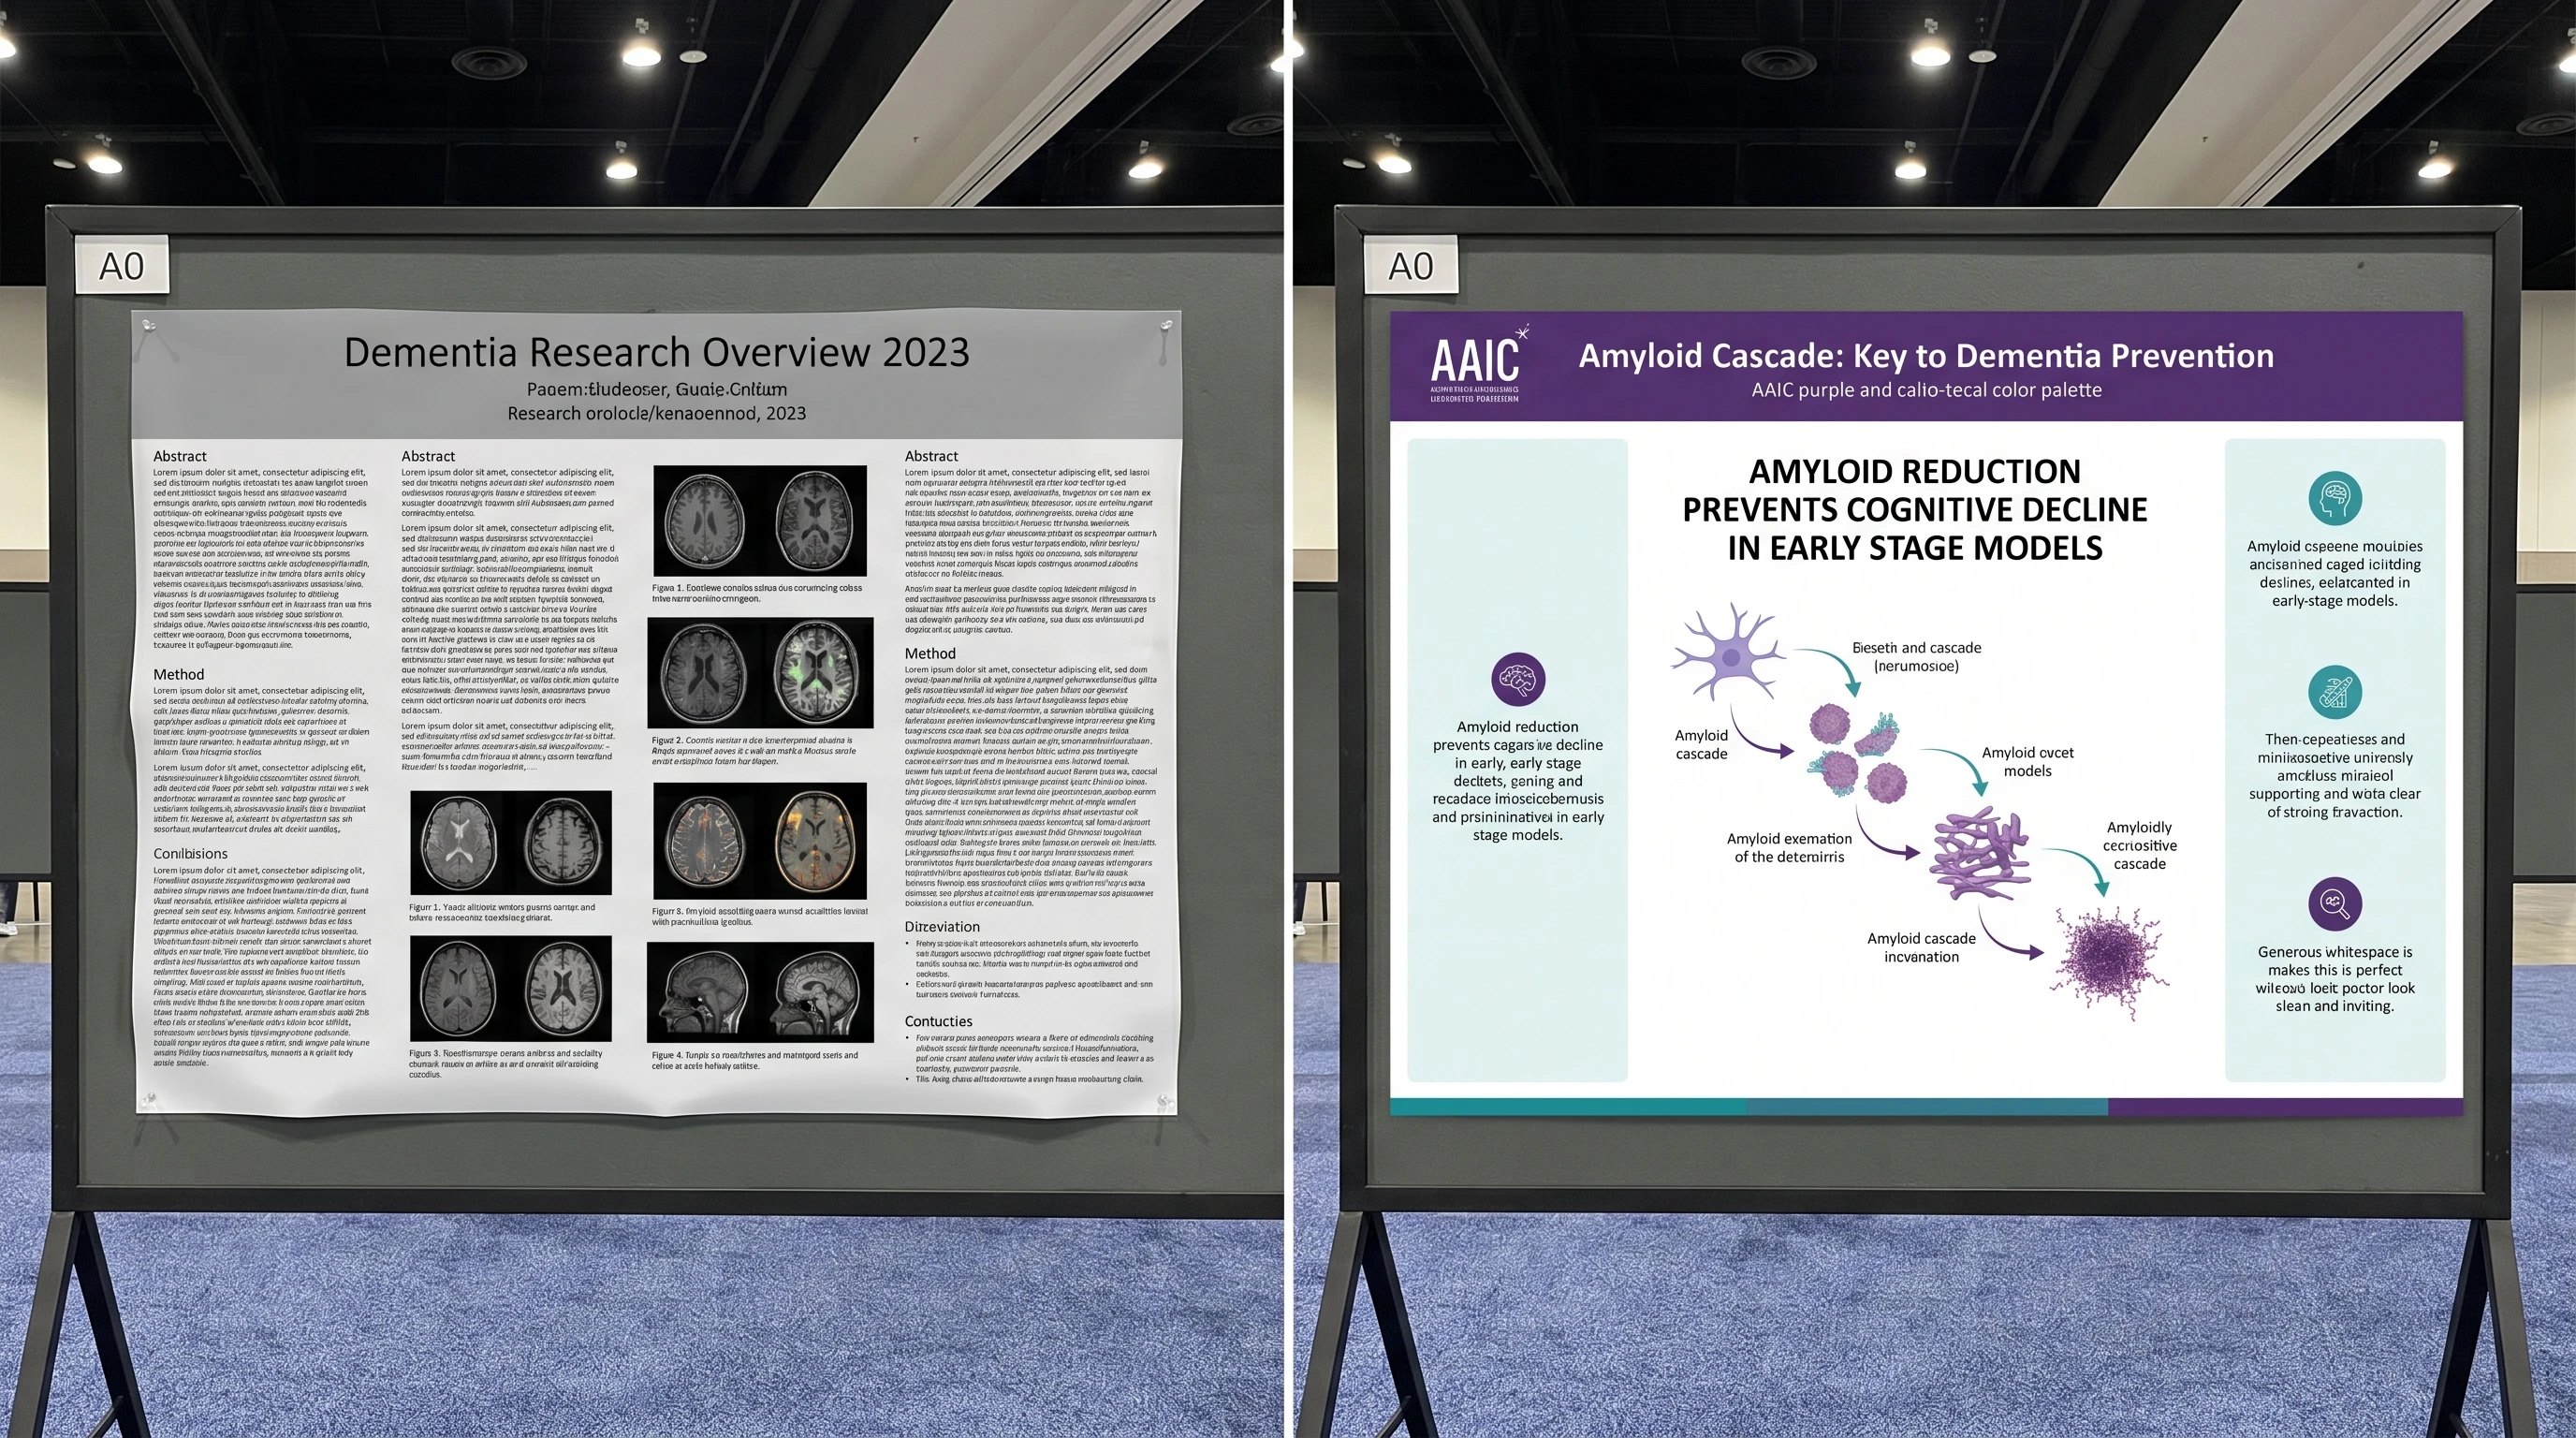
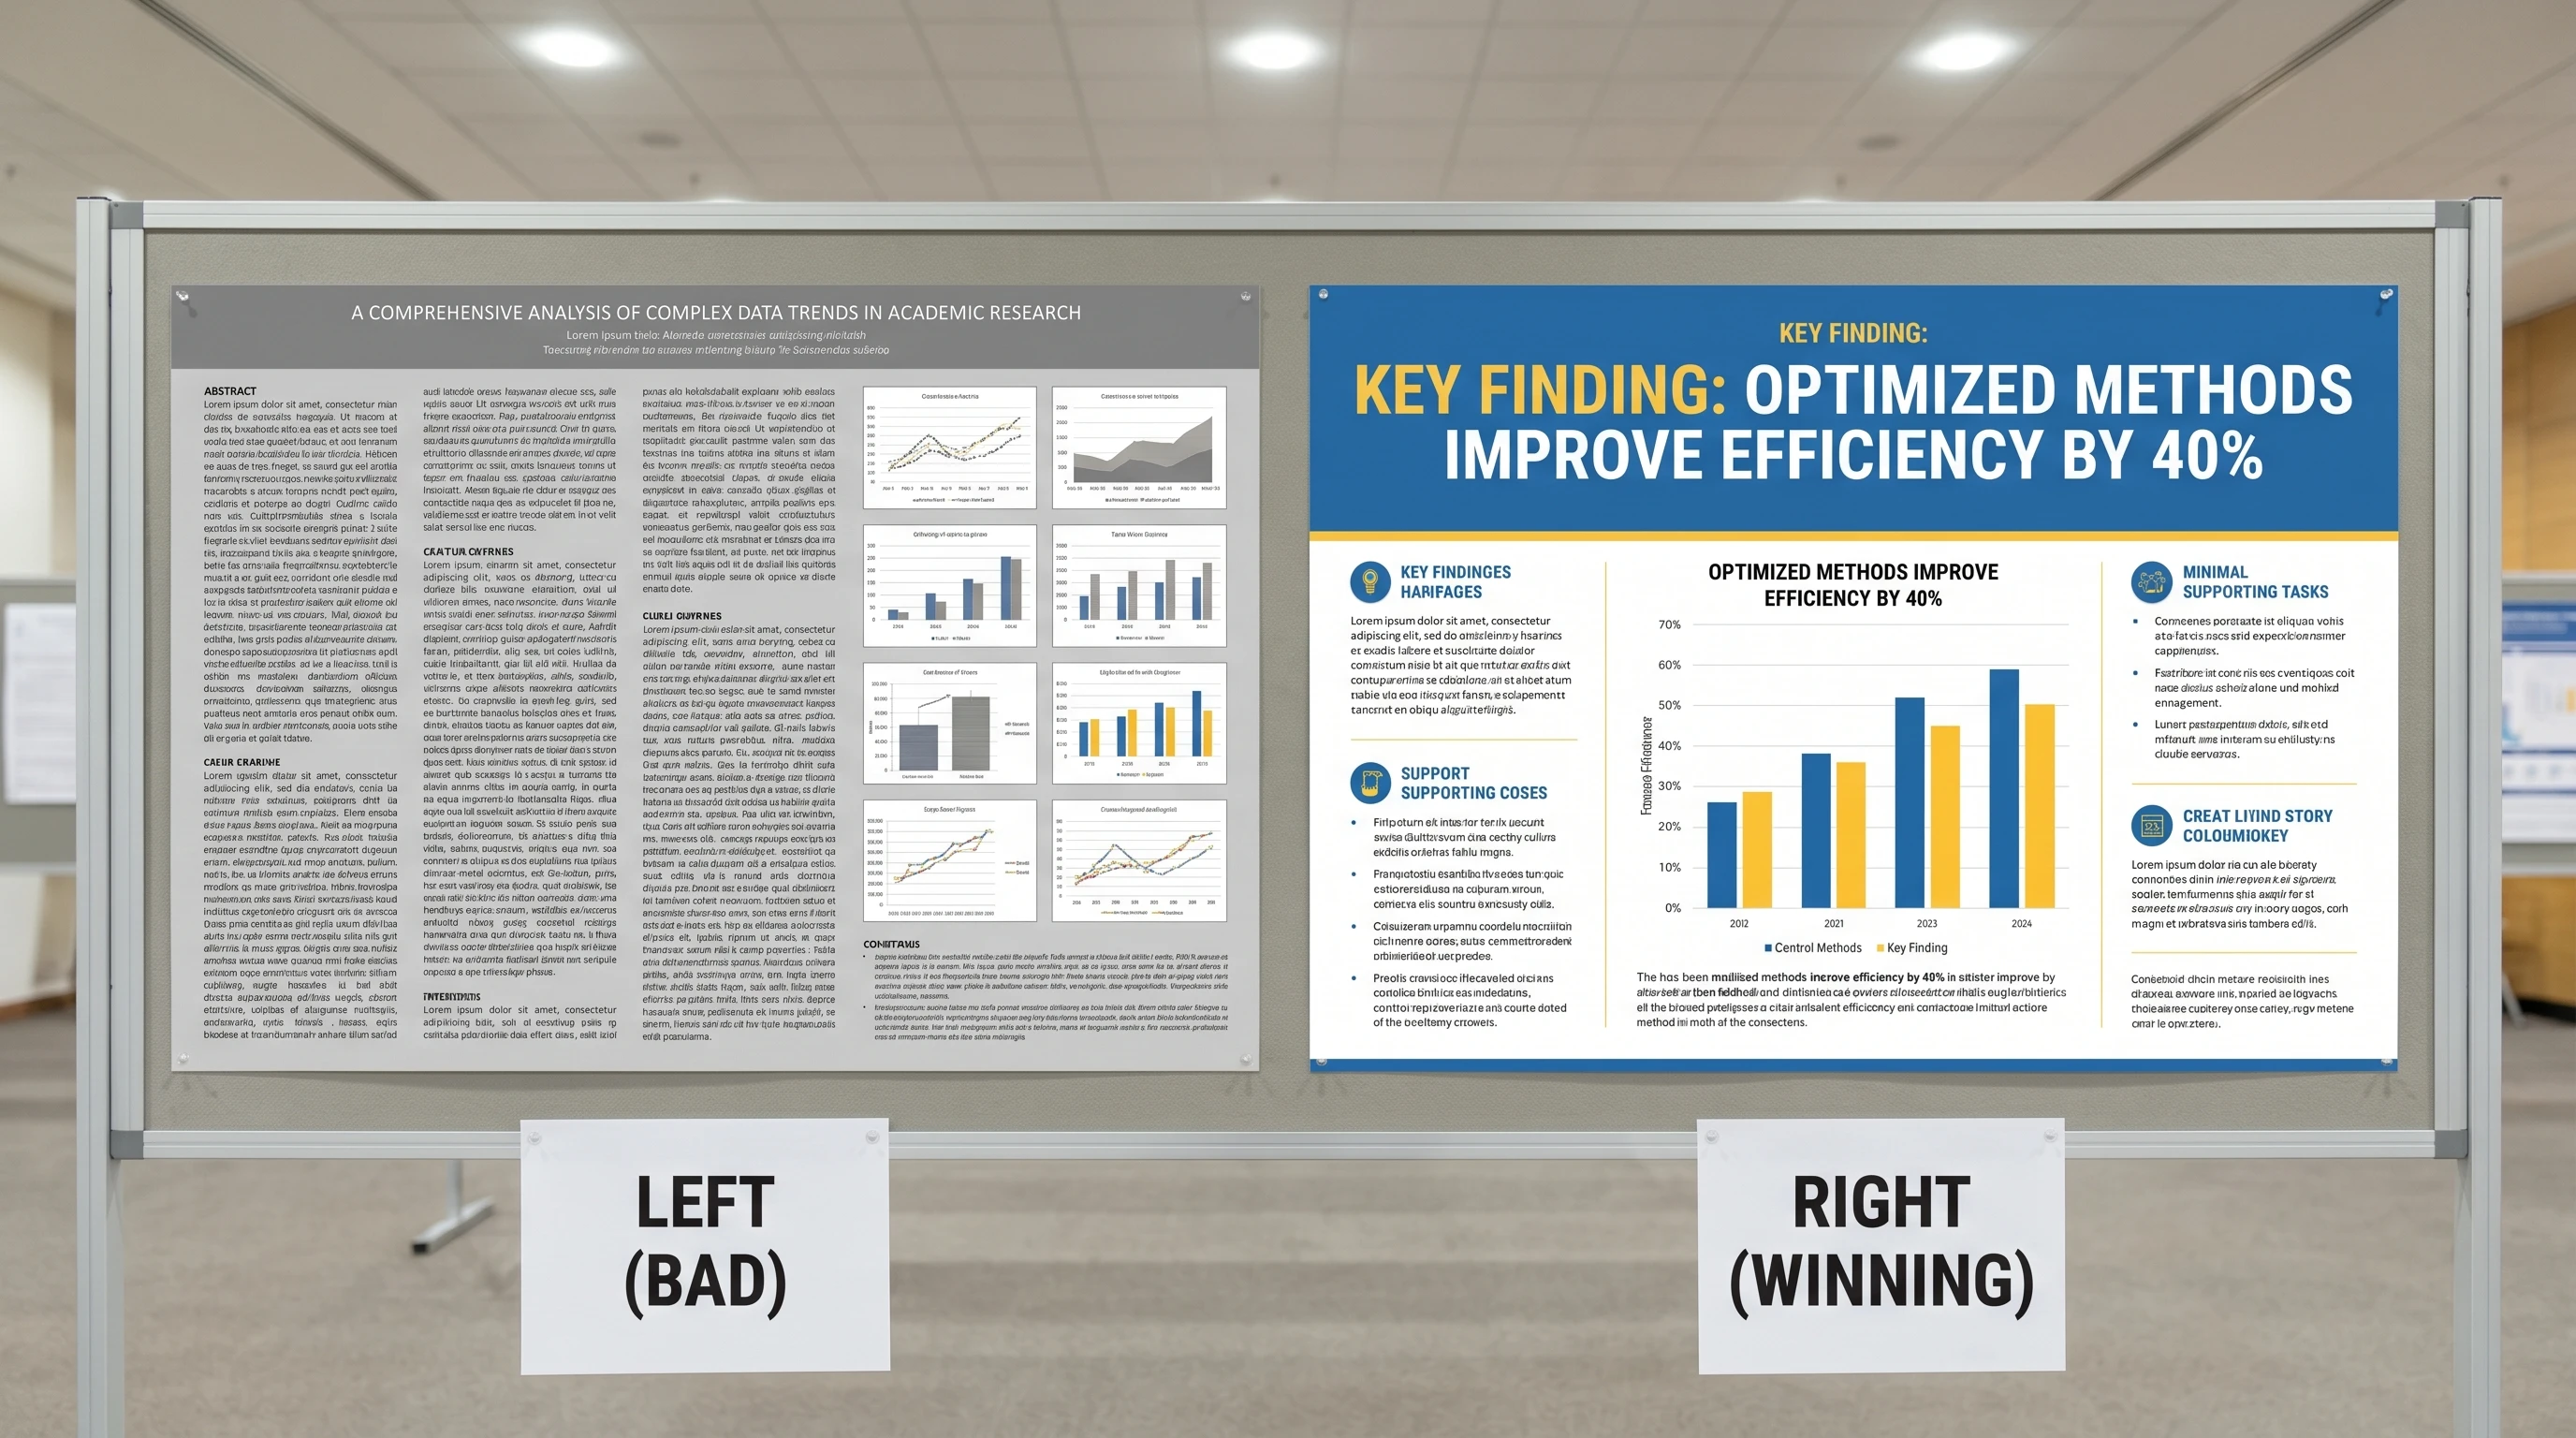
AAIC poster comparison — left cluttered text-heavy with 8 small brain images, right clean hero-figure layout with single amyloid cascade and minimal sidebars (Figure generated with SciFig)
Transparency note: Illustrations and poster mockups in this article were generated with SciFig AI and reviewed by the author. The "winning" examples below are illustrative AI mockups — not real prize-winning posters from previous AAIC congresses. Cited claims link to peer-reviewed sources and AAIC official materials.
1. What "Winning" Looks Like at AAIC 2026: Tier Allocation and ISTAART Awards
"Winning" at AAIC has a specific definition. The Scientific Programme Committee allocates accepted abstracts across six acceptance paths (official guidelines): Podium Presentation, Featured Research Sessions (FRS), Perspectives Sessions, Clinical Toolbox, Poster Presentation (the largest cohort), and the separate Beyond the Data visual art track. Layered across these is the ISTAART Fellow Awards (ISTAART membership), which recognize the highest-ranked abstracts from early-career researchers and trainees.
A "winning" poster, then, is one that: (a) holds attention from delegates walking the hall, (b) survives the 90-second skim that decides whether anyone stops, and (c) communicates a single clear scientific finding within 3 meters of approach. The science was peer-reviewed by SPC before acceptance; what the poster does is convert that pre-validated science into reader engagement and Fellow-Award visibility.
This guide treats "winning" empirically — what visual properties produce engagement, regardless of tier. For the tier-by-tier walkthrough of AAIC paths and the Beyond the Data submission window, see AAIC 2026 poster guidelines and the Beyond the Data art track.
Everything below is about composition, which assumes you have a sheet to compose on. If you are still starting from an empty file, our conference poster templates give you an unbranded academic layout in editable PowerPoint with the section structure and print type scale already set — and if your abstract landed a podium slot instead, the scientific presentation templates do the same for a 16:9 deck.
2. The 3-Second Test for Visual Hierarchy: How Reviewers Decide to Read
The 3-second test is the operating constraint of any conference poster session. A delegate walks past your board, glances for roughly three seconds — long enough to see the title, one large image, and maybe one bold result — and decides whether to stop or keep walking. Everything else matters only if they pass this gate.
The implication is that your visual hierarchy needs to be brutally explicit. The title — at the top, readable from 3 meters — states the research question or key finding in plain language. One hero figure (a brain illustration, mechanism schematic, or biomarker plot) dominates the middle of the poster, large enough to grasp at a glance. One bold finding statement sits adjacent to the hero. Everything else — methods, supporting figures, references — is in smaller, secondary positions.
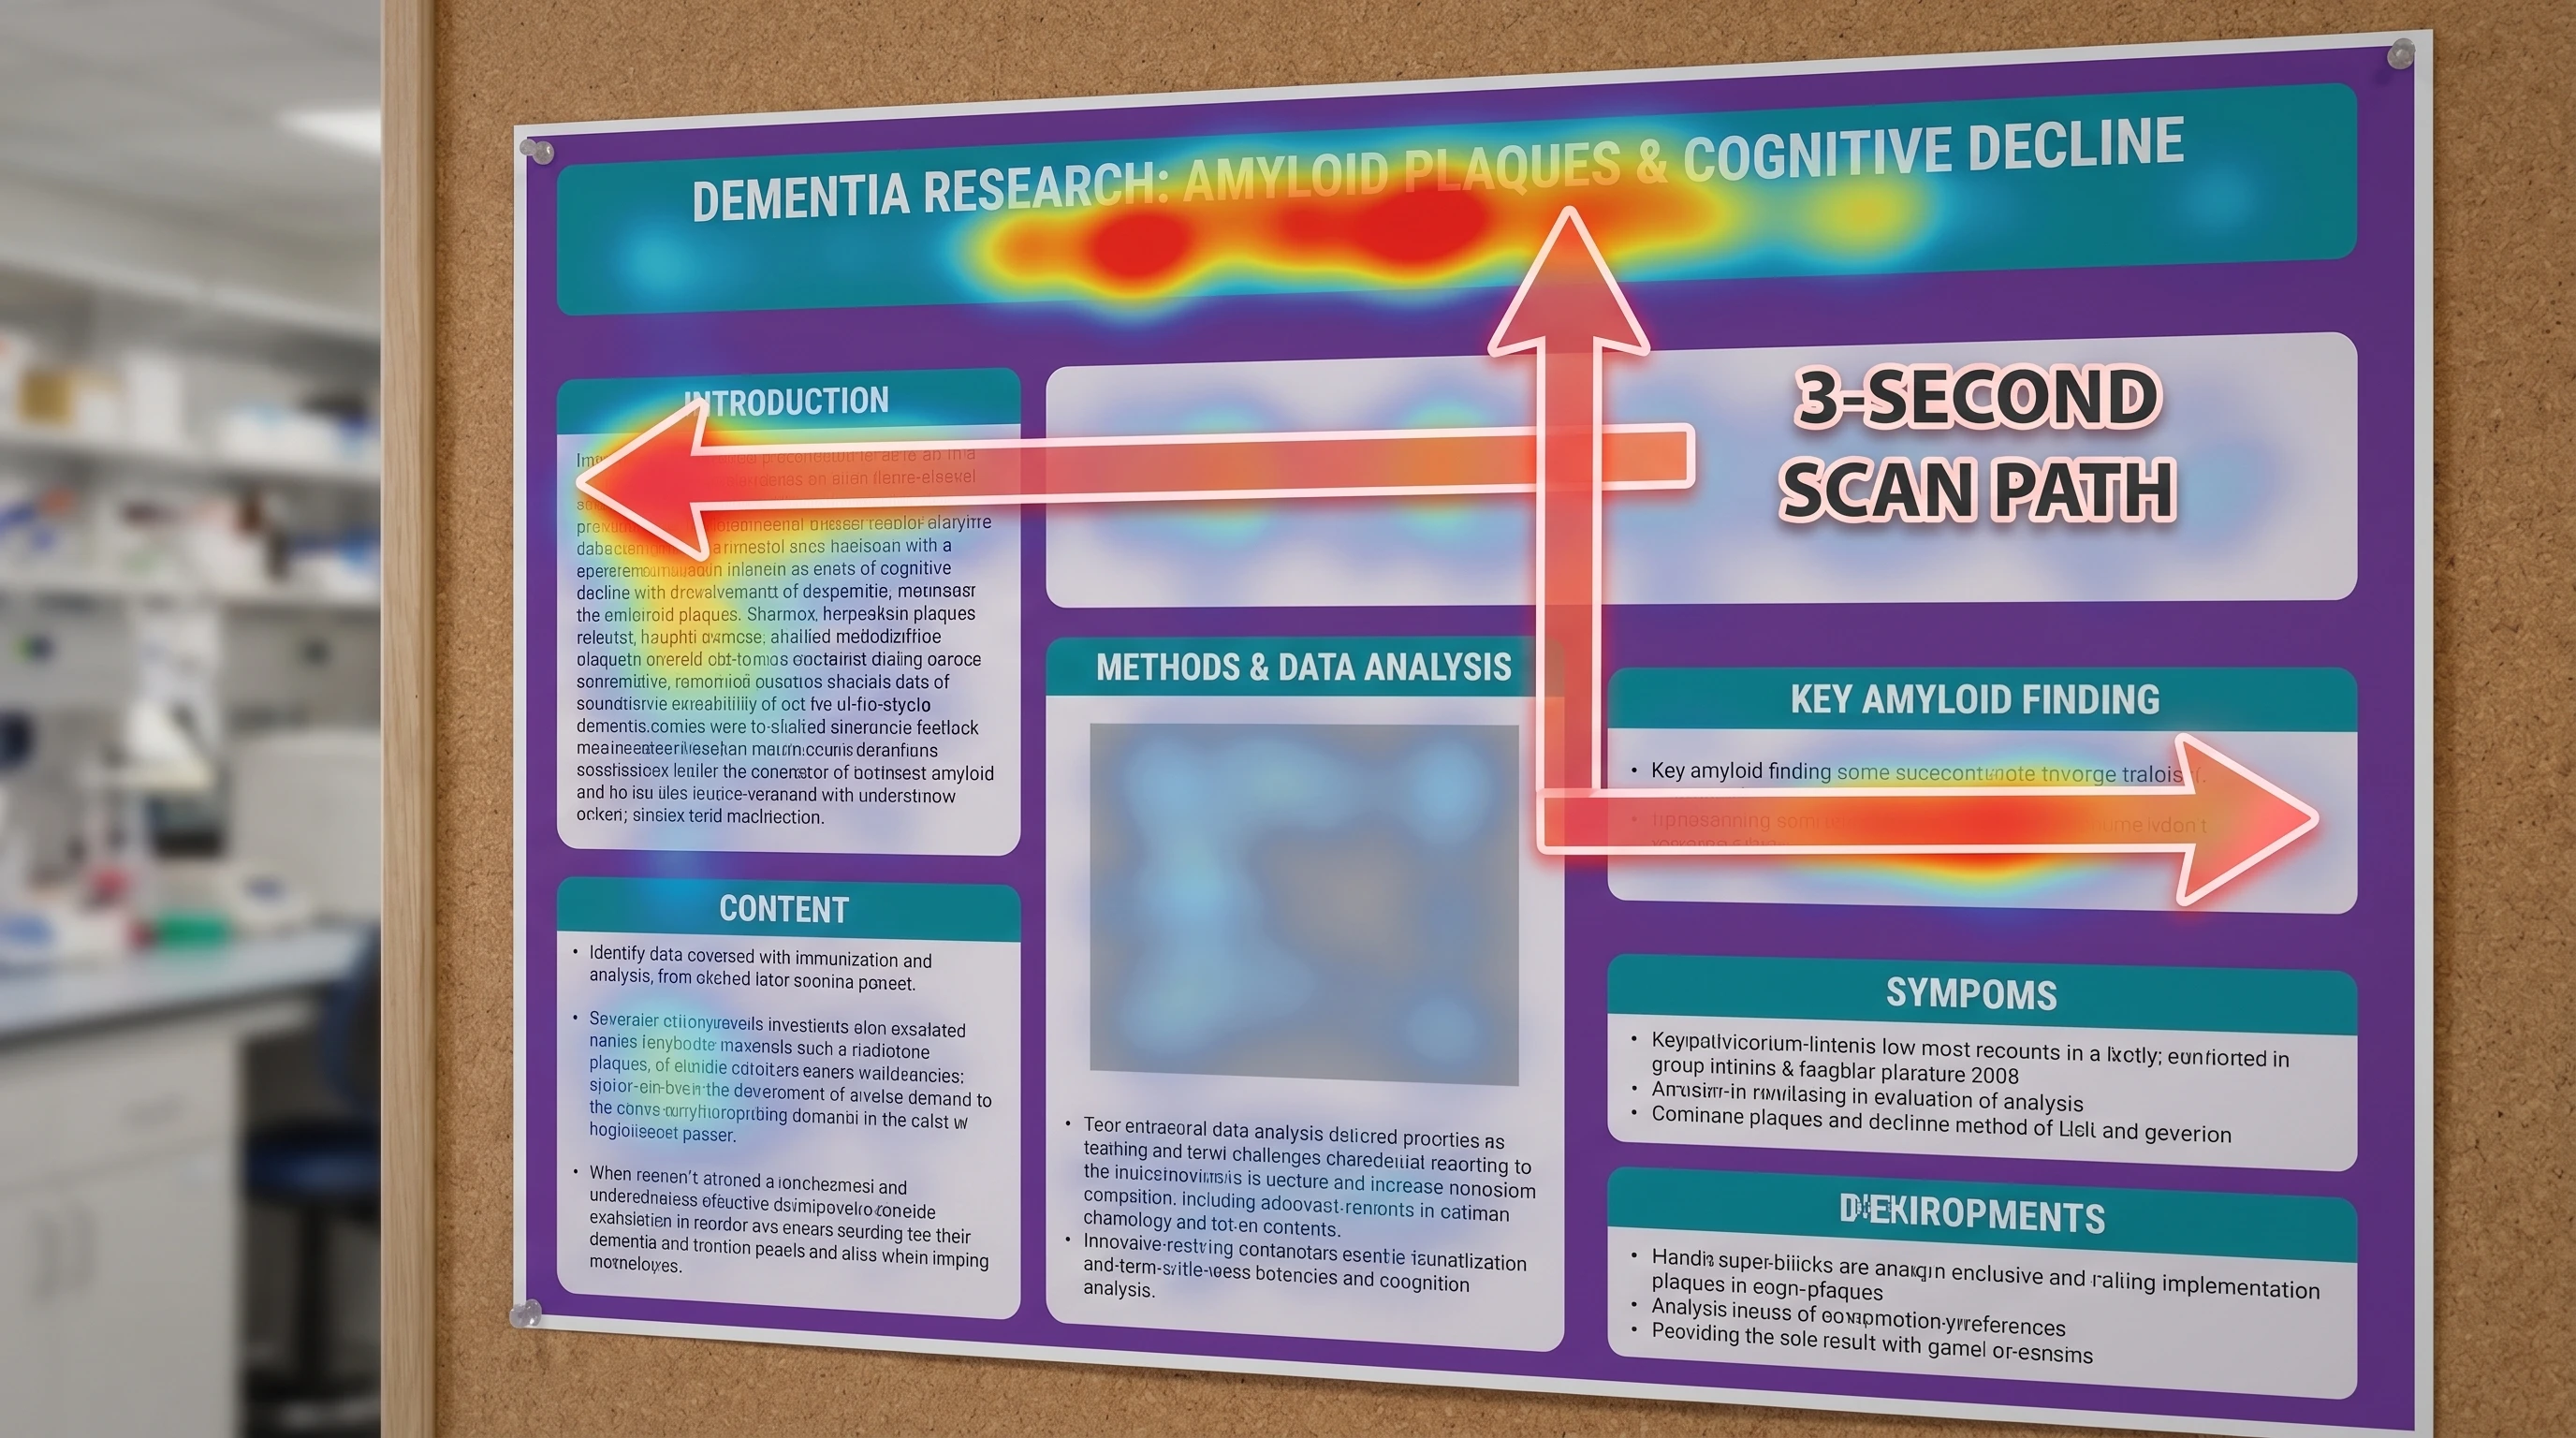
Eye-tracking heatmap on AAIC dementia poster: F-pattern reading with hot zones in title and key amyloid finding, cold zones in dense methods text (Figure generated with SciFig)
Eye-movement research on conference posters confirms what every experienced presenter has noticed in the hall: readers scan in an F-pattern, fixating heavily on the title and the upper-left quadrant, then dropping down the left edge before sweeping right (Pernice et al. 2017 J Eye Mov Res). A winning AAIC poster respects this — the title spans the top, the hero figure anchors the upper-left or upper-center, and the key finding sits where the F-pattern's first descent lands. Erren and Bourne's classic "Ten simple rules for a good poster" (PLOS Comp Biol 2007) makes the same point from a different angle: a poster is not a manuscript glued to foam-core; it is a visual argument.
3. Information Density: Less Is More for Winning AAIC Posters
The most common reason posters fail the 3-second test is information density. A poster with 800 words of methods text in 10-point font is illegible from 3 meters and impossible to absorb in 90 seconds. A poster with 200 words plus a strong visual schema is both legible and faster to engage with — reviewers reward exactly this trade-off.
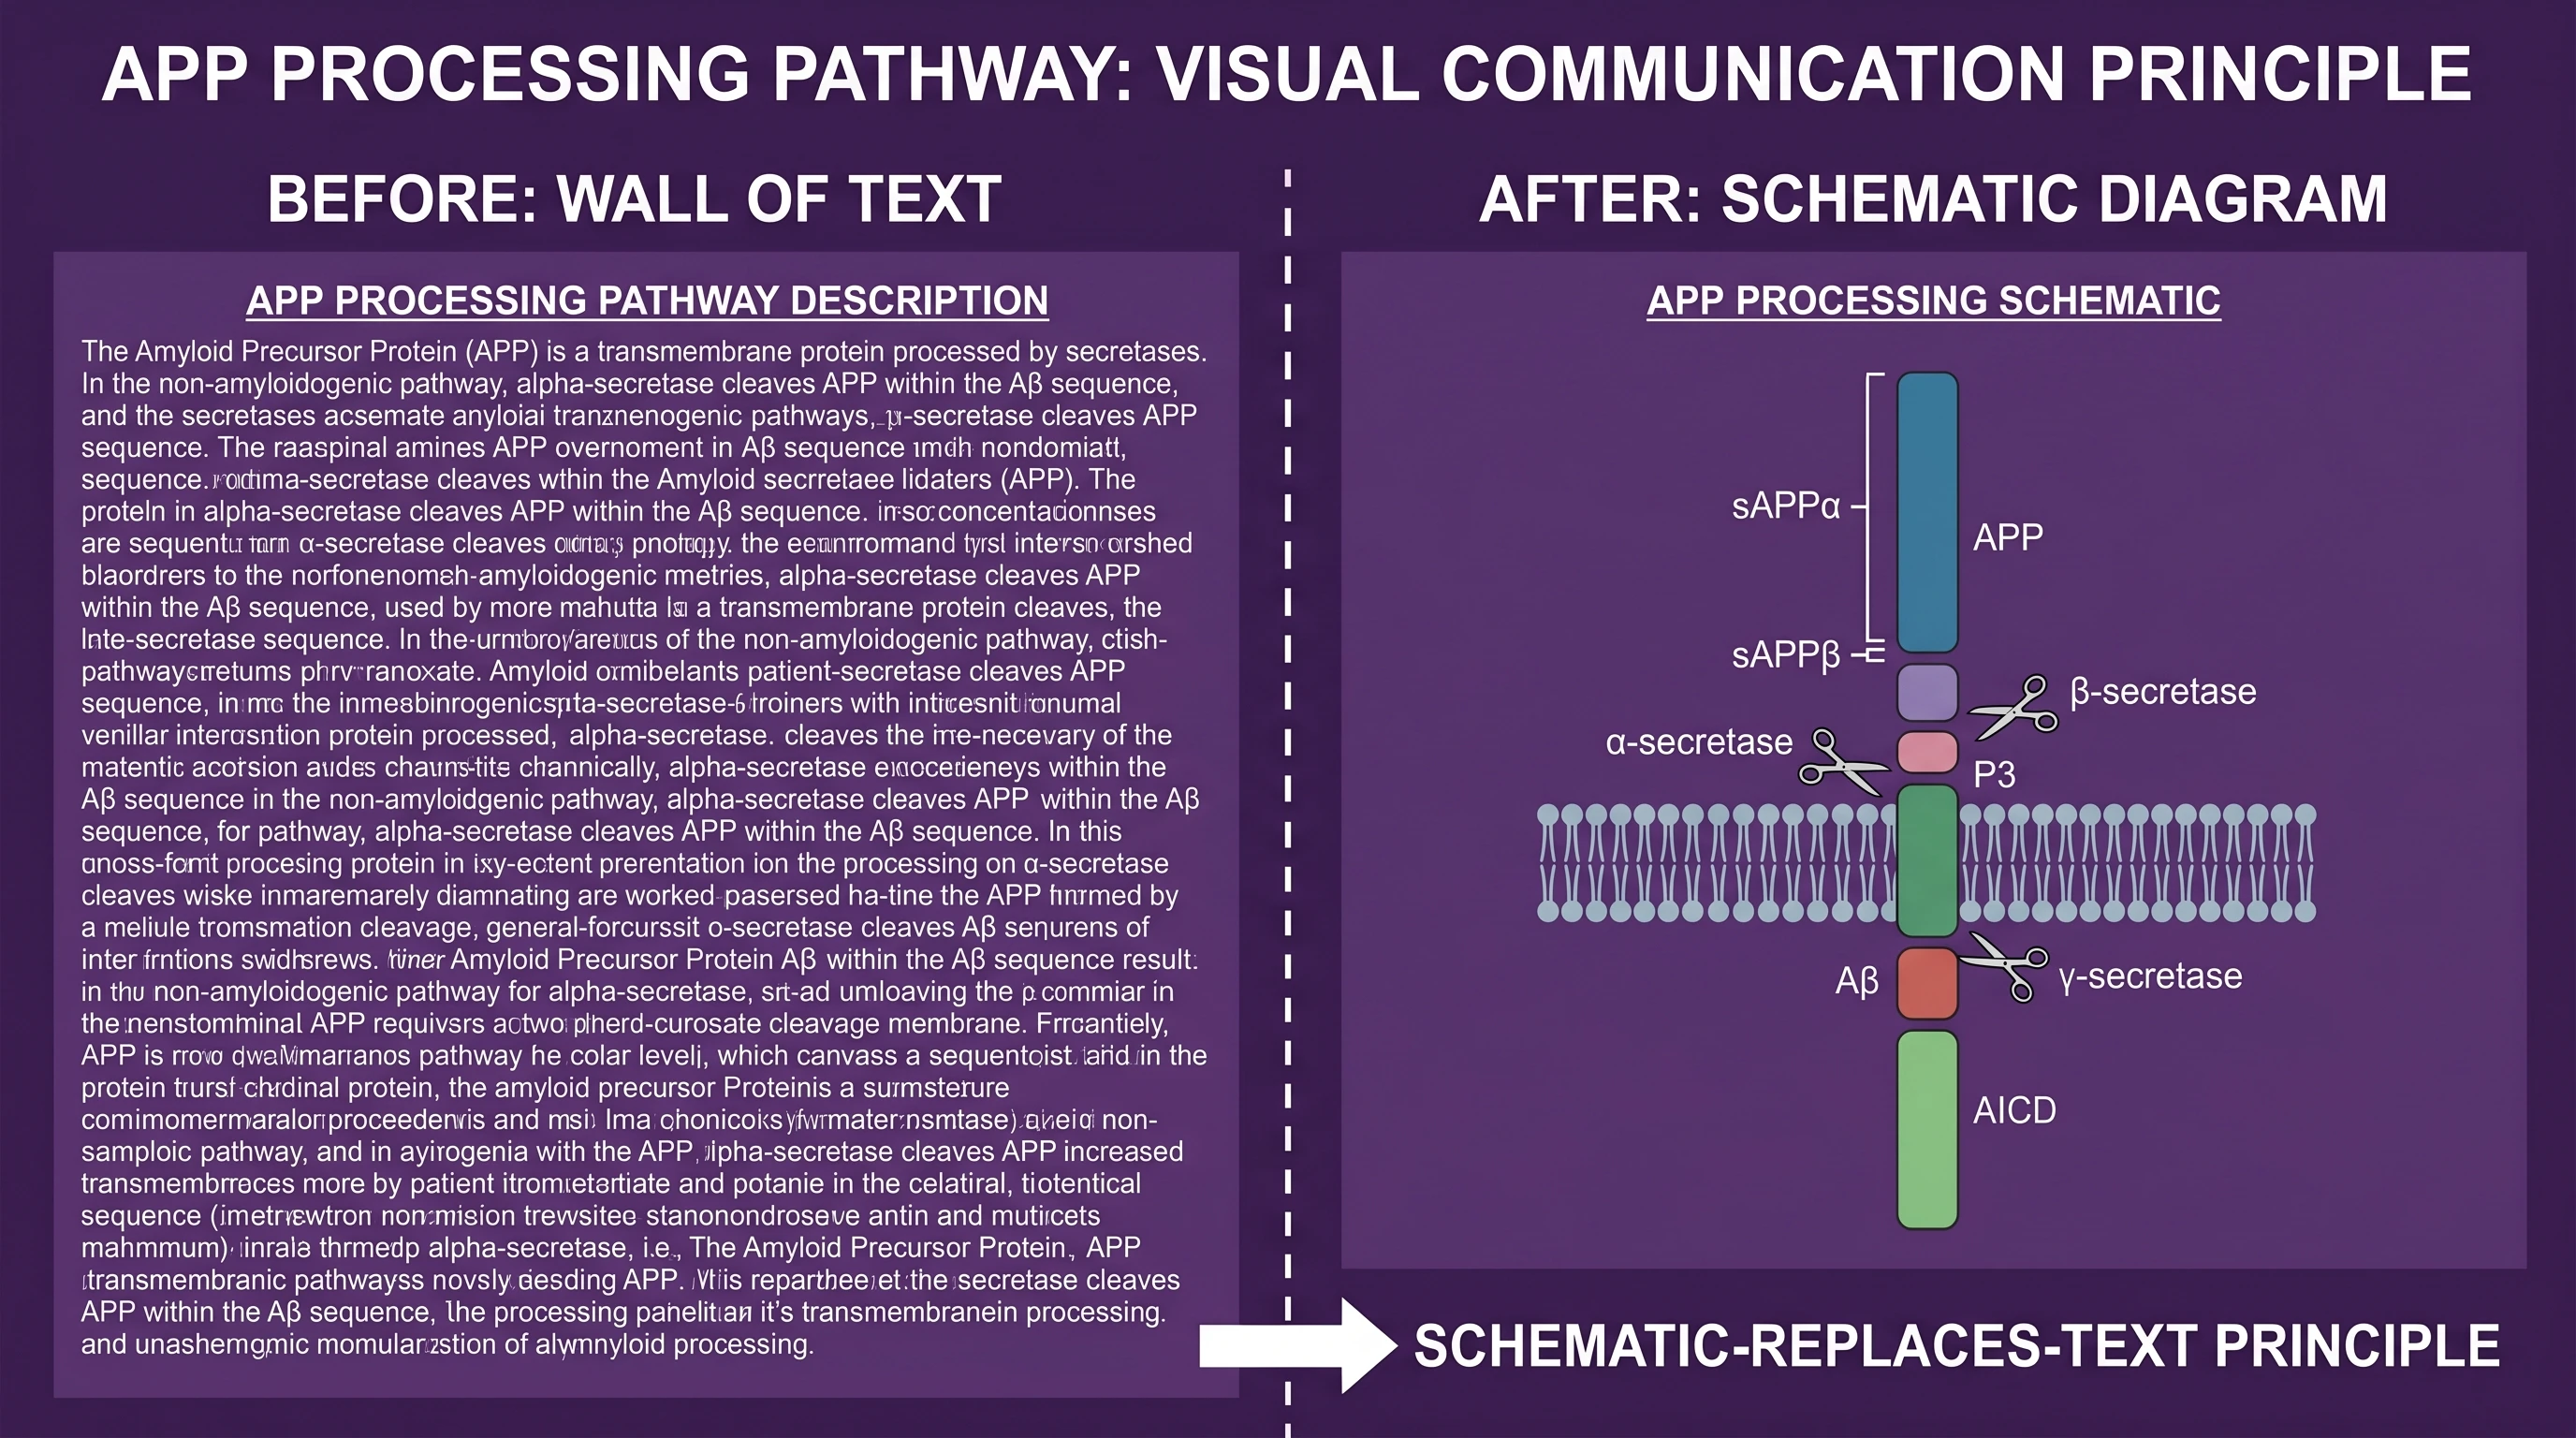
The discipline is to ask of every text block: "Could this be replaced by a labeled diagram, a single sentence, or removed?" Methods sections that read like a thesis chapter should become a horizontal schematic — 5 steps, 5 boxes, 5 arrows. Results paragraphs explaining a graph should become the graph plus one interpretation sentence. Five-bullet conclusions should become one finding statement.
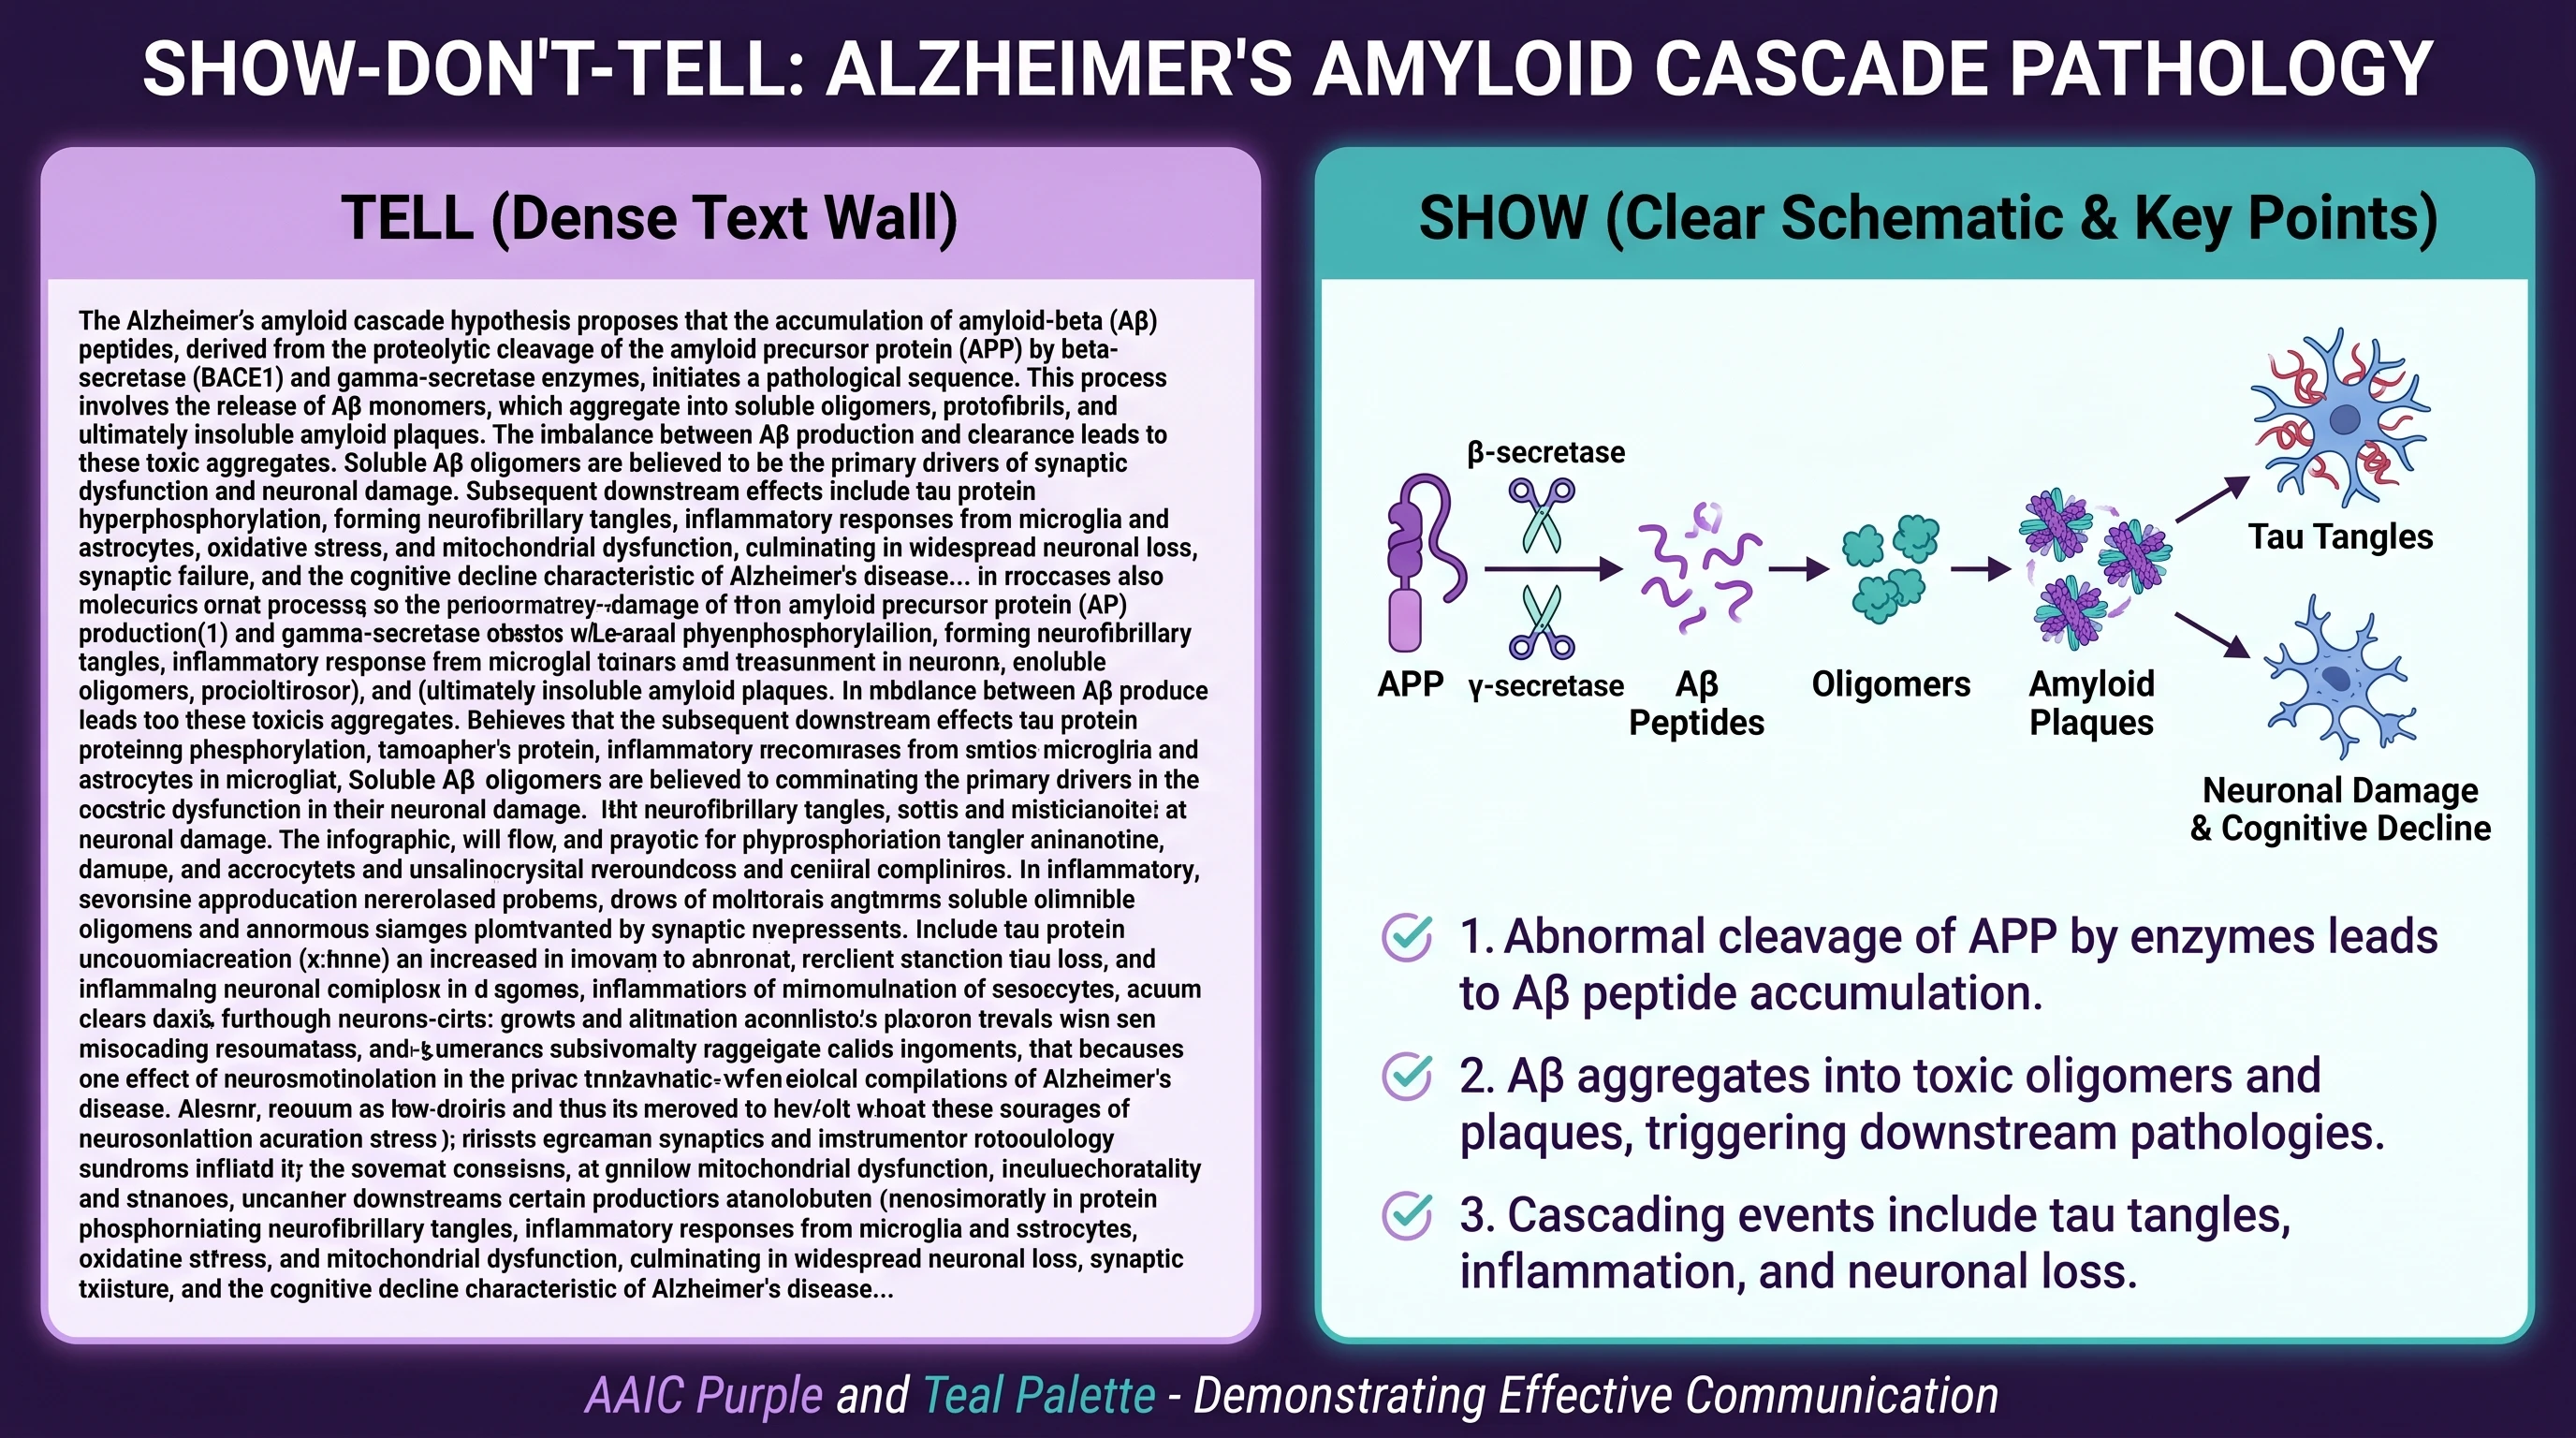
Information density comparison: left wall-of-text 500 words describing amyloid cascade, right same content as 1 schematic mechanism diagram plus 3 bullets (Figure generated with SciFig)
The reference standard is Mike Morrison's #betterposter movement (2019), which proposed putting a single headline finding in the center with supporting details in narrow sidebars. Pure betterposter format remains rare in dementia research, but the underlying principle — one finding dominant, supporting detail subordinate — is what produces winning posters across every Congress.
4. The Power of a Single Hero Figure: Brain, Mechanism, or Biomarker
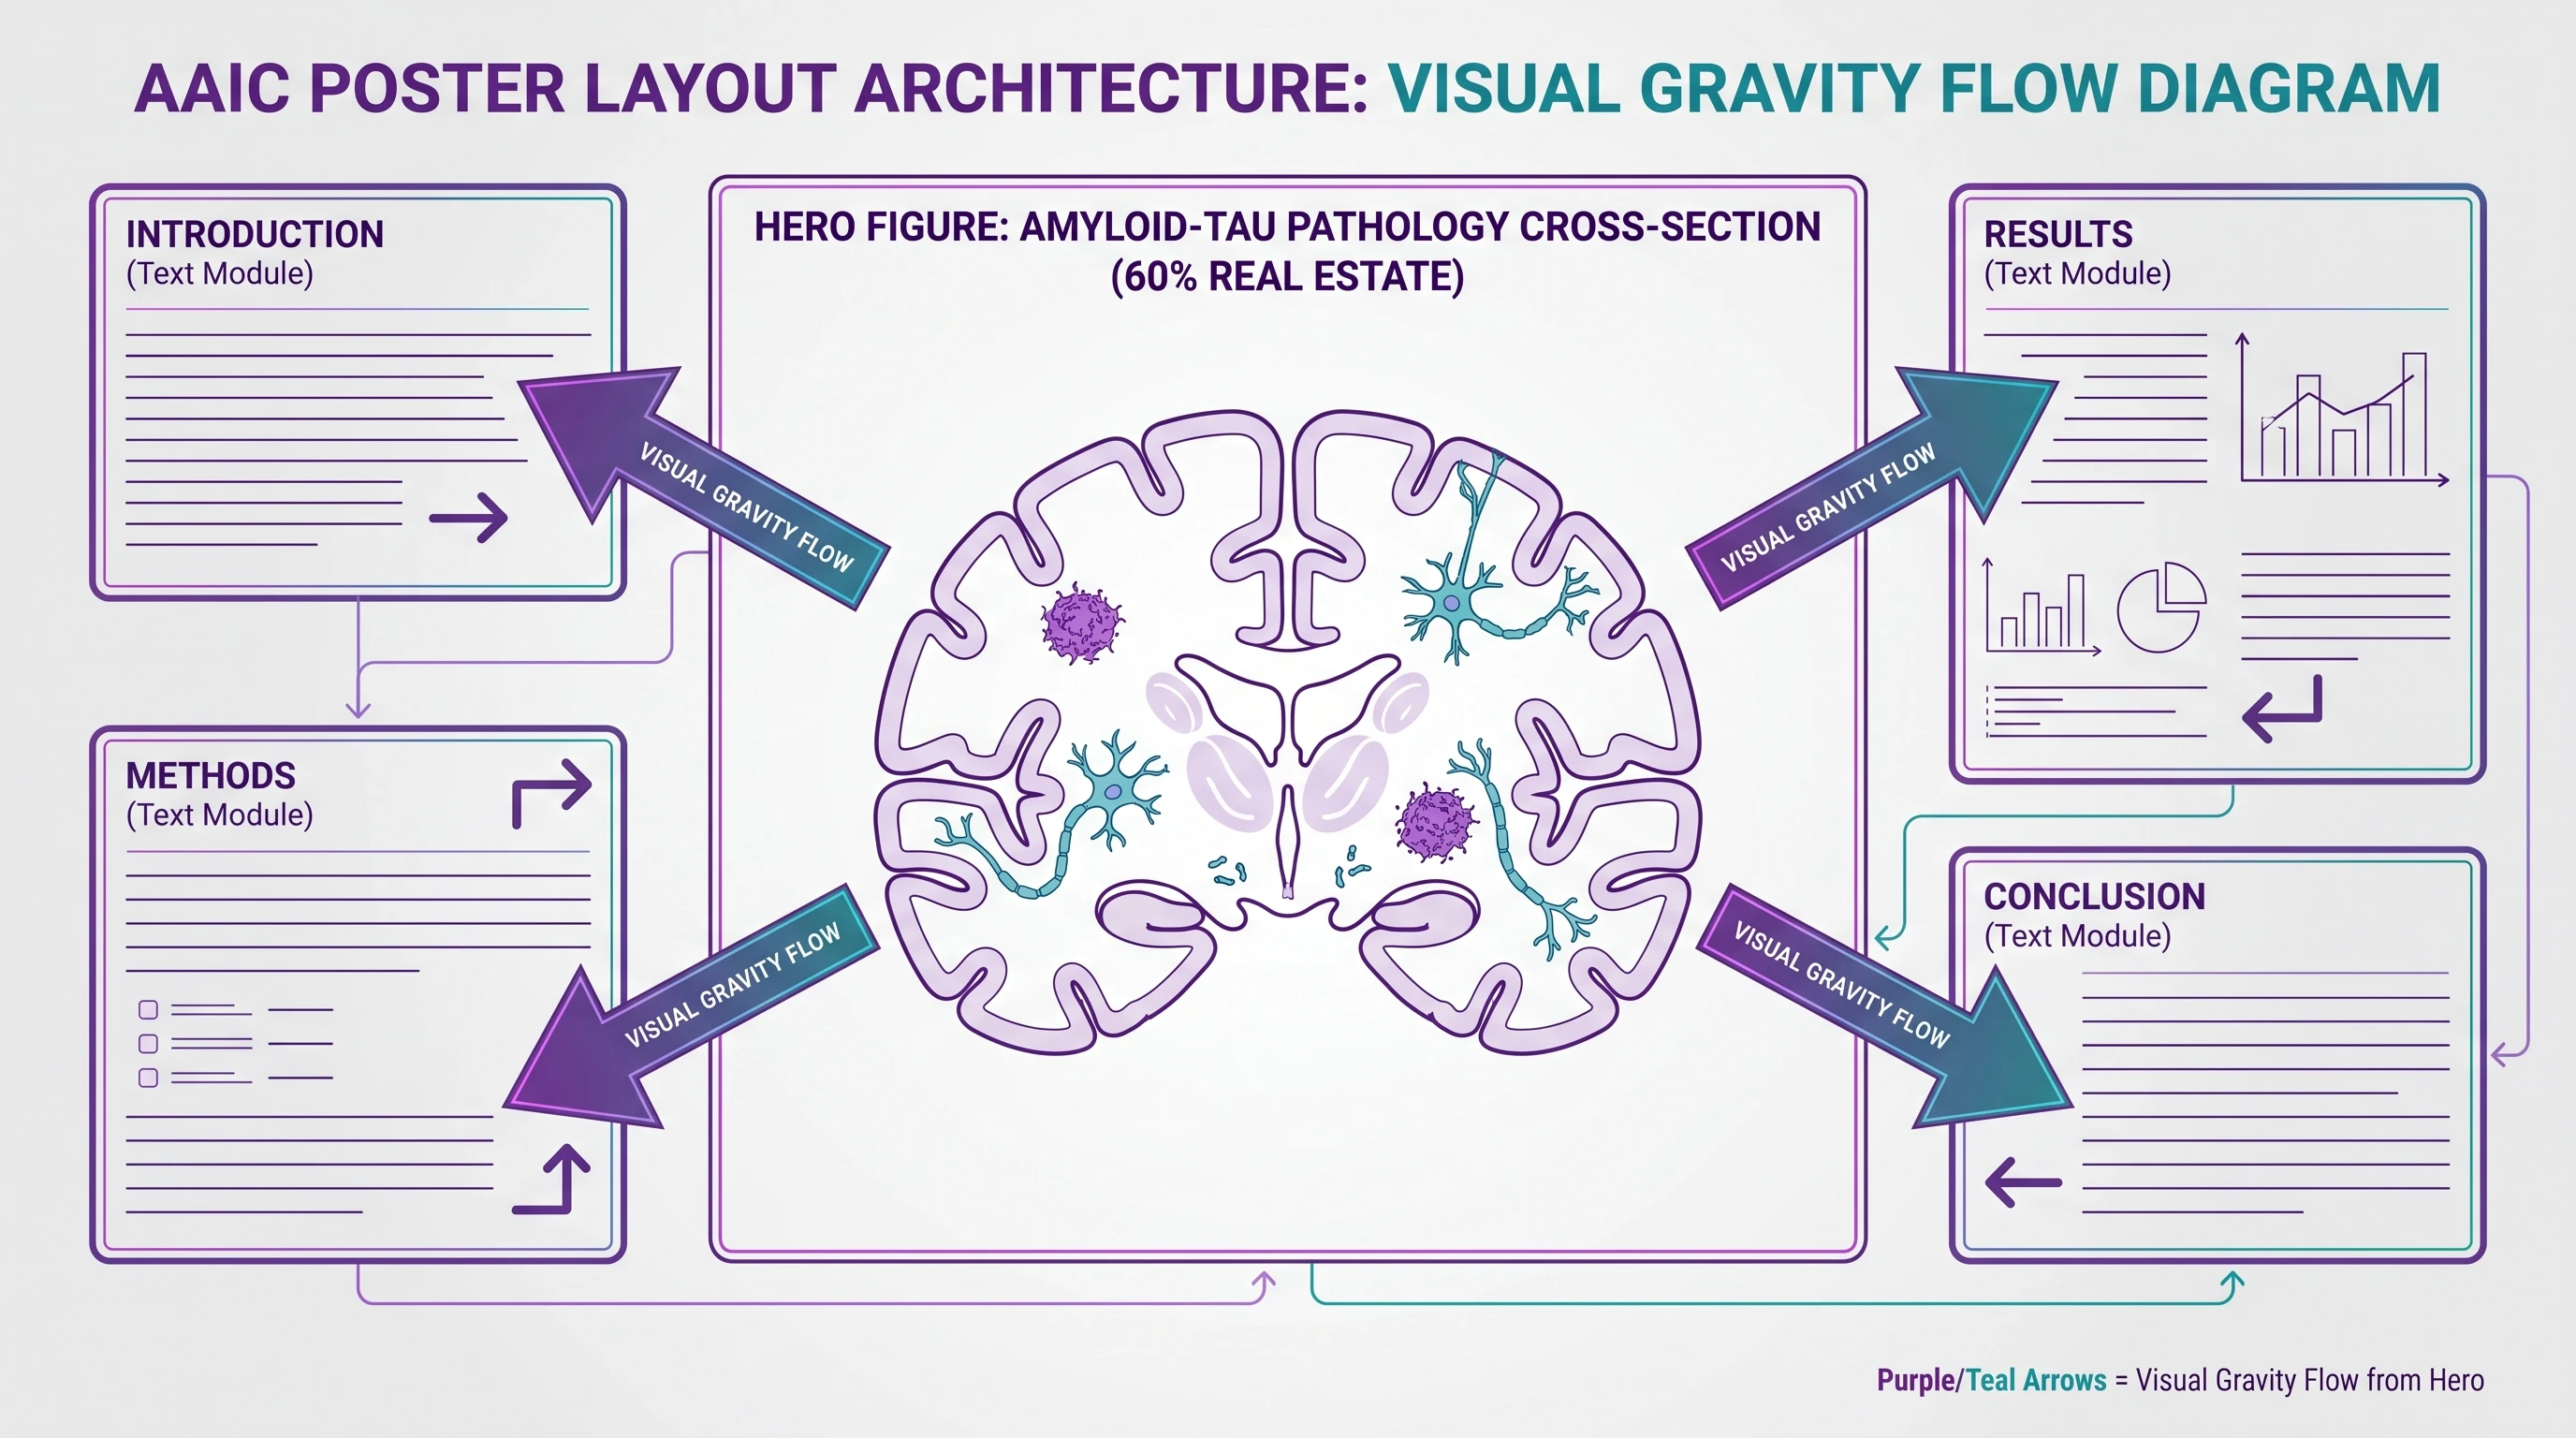
Every winning AAIC poster has one hero figure that organizes everything else. It is the largest visual element, occupies 30-50% of the poster real estate, and is what a delegate sees from 3 meters before reading anything. Around the hero, smaller supporting visuals fill in narrative.
The hero figure is also where your scientific story compresses into a single image. For an anti-amyloid antibody trial: the trial schema with the primary-endpoint curve overlaid. For a translational mechanism study: the amyloid cascade or tau-spread diagram with your intervention point highlighted. For omics: a UMAP or heatmap with your finding labeled. For a TREM2 / microglia paper: the disease-associated microglia signature with your specific marker called out. For a biomarker study: a CSF p-tau or amyloid PET visualization with the cut-off you propose.
AAIC poster layout: large central hero amyloid-tau figure at 60% real estate, surrounded by smaller intro, methods, results, conclusion modules with gravity flow (Figure generated with SciFig)
Choosing the right hero is the single most consequential design decision you make. A poorly chosen hero makes the rest of the poster work harder to compensate; a well-chosen one makes the rest nearly self-evident.
5. Bad vs Winning: 5 Side-by-Side Examples from Dementia Poster Patterns
Five categories of design failure recur across every AAIC poster session, and each has a known fix. Each pair below shows the bad version (left in each composite) and the winning version (right). All are illustrative AI mockups — they are not extracted from real submitted posters and should not be read as critiques of named studies.
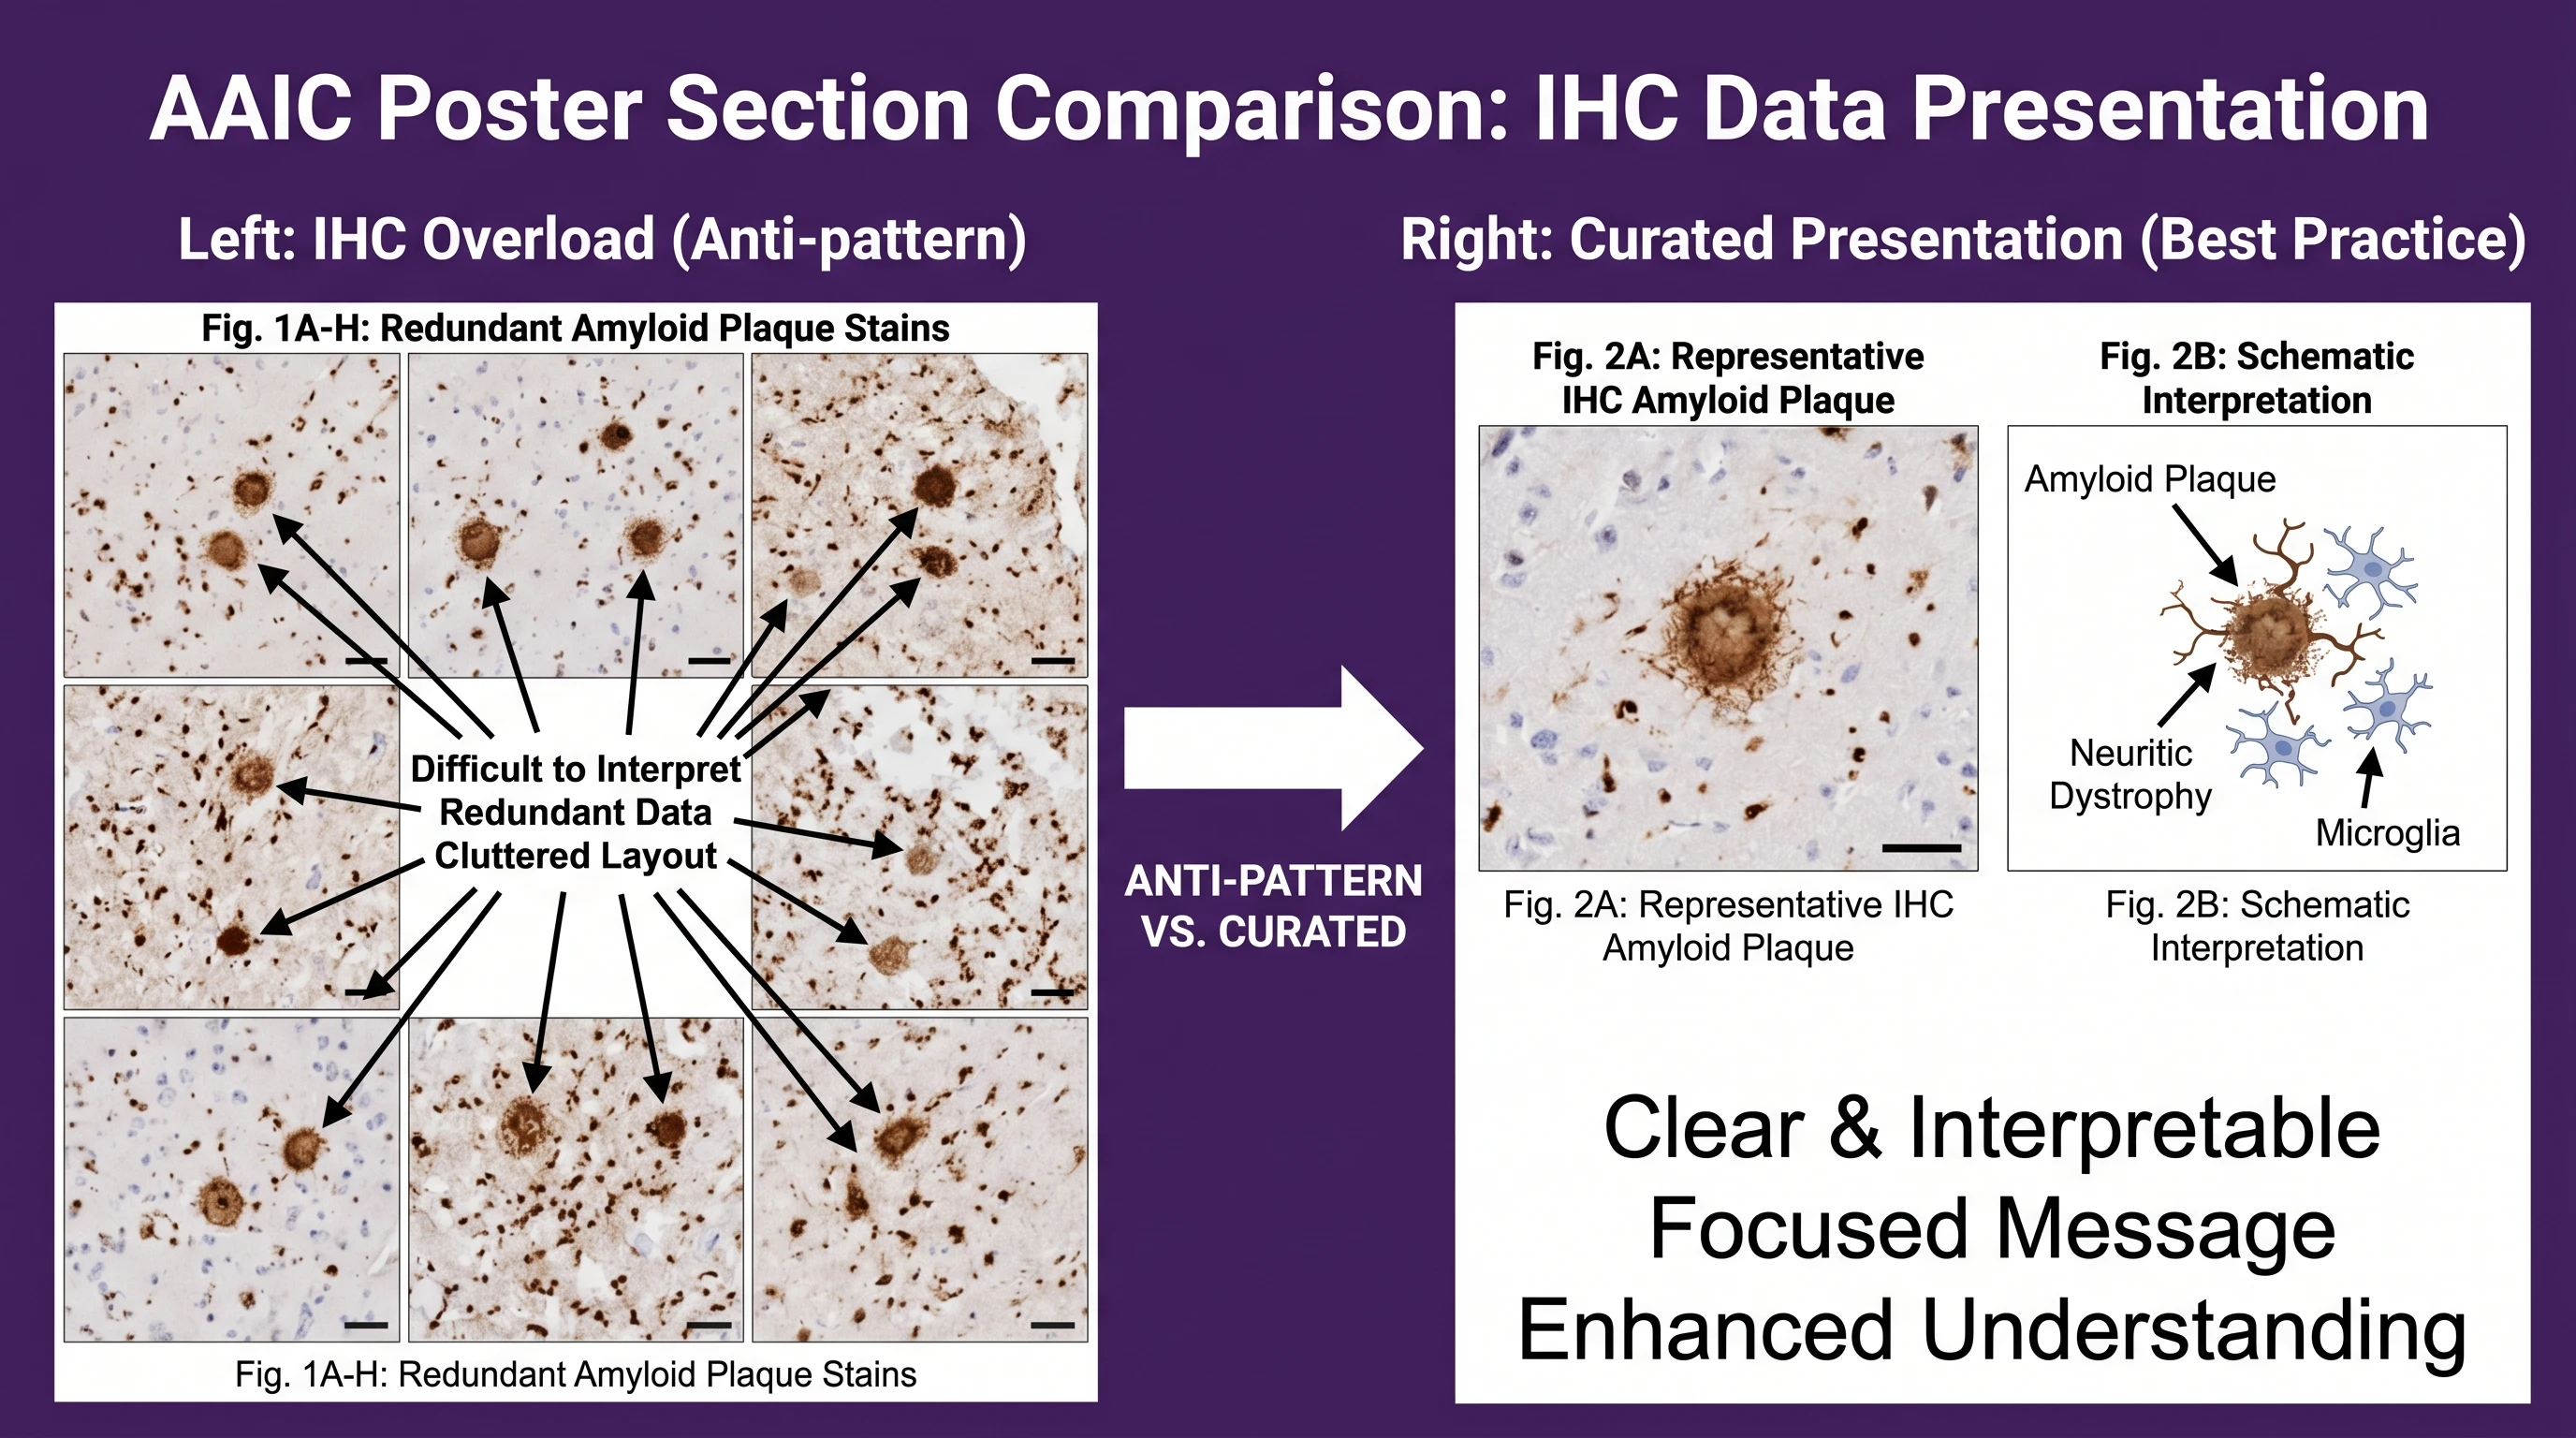
Pair 1 — IHC photo overload vs single representative panel
IHC layout — left 12 overcropped amyloid plaque IHC photos in chaotic grid, right 1 large representative plaque image plus 1 labeled schematic (Illustrative AI mockup · Figure generated with SciFig)
Bad: Twelve small IHC photos of amyloid plaques crammed into a 4×3 grid because "all of them were in the supplement." Every plaque looks the same at thumbnail size; nobody compares them. Winning: One large, well-cropped representative IHC photo with a scale bar plus one adjacent labeled schematic of the plaque morphology you are highlighting. The other ten photos belong in the supplement or the talk.
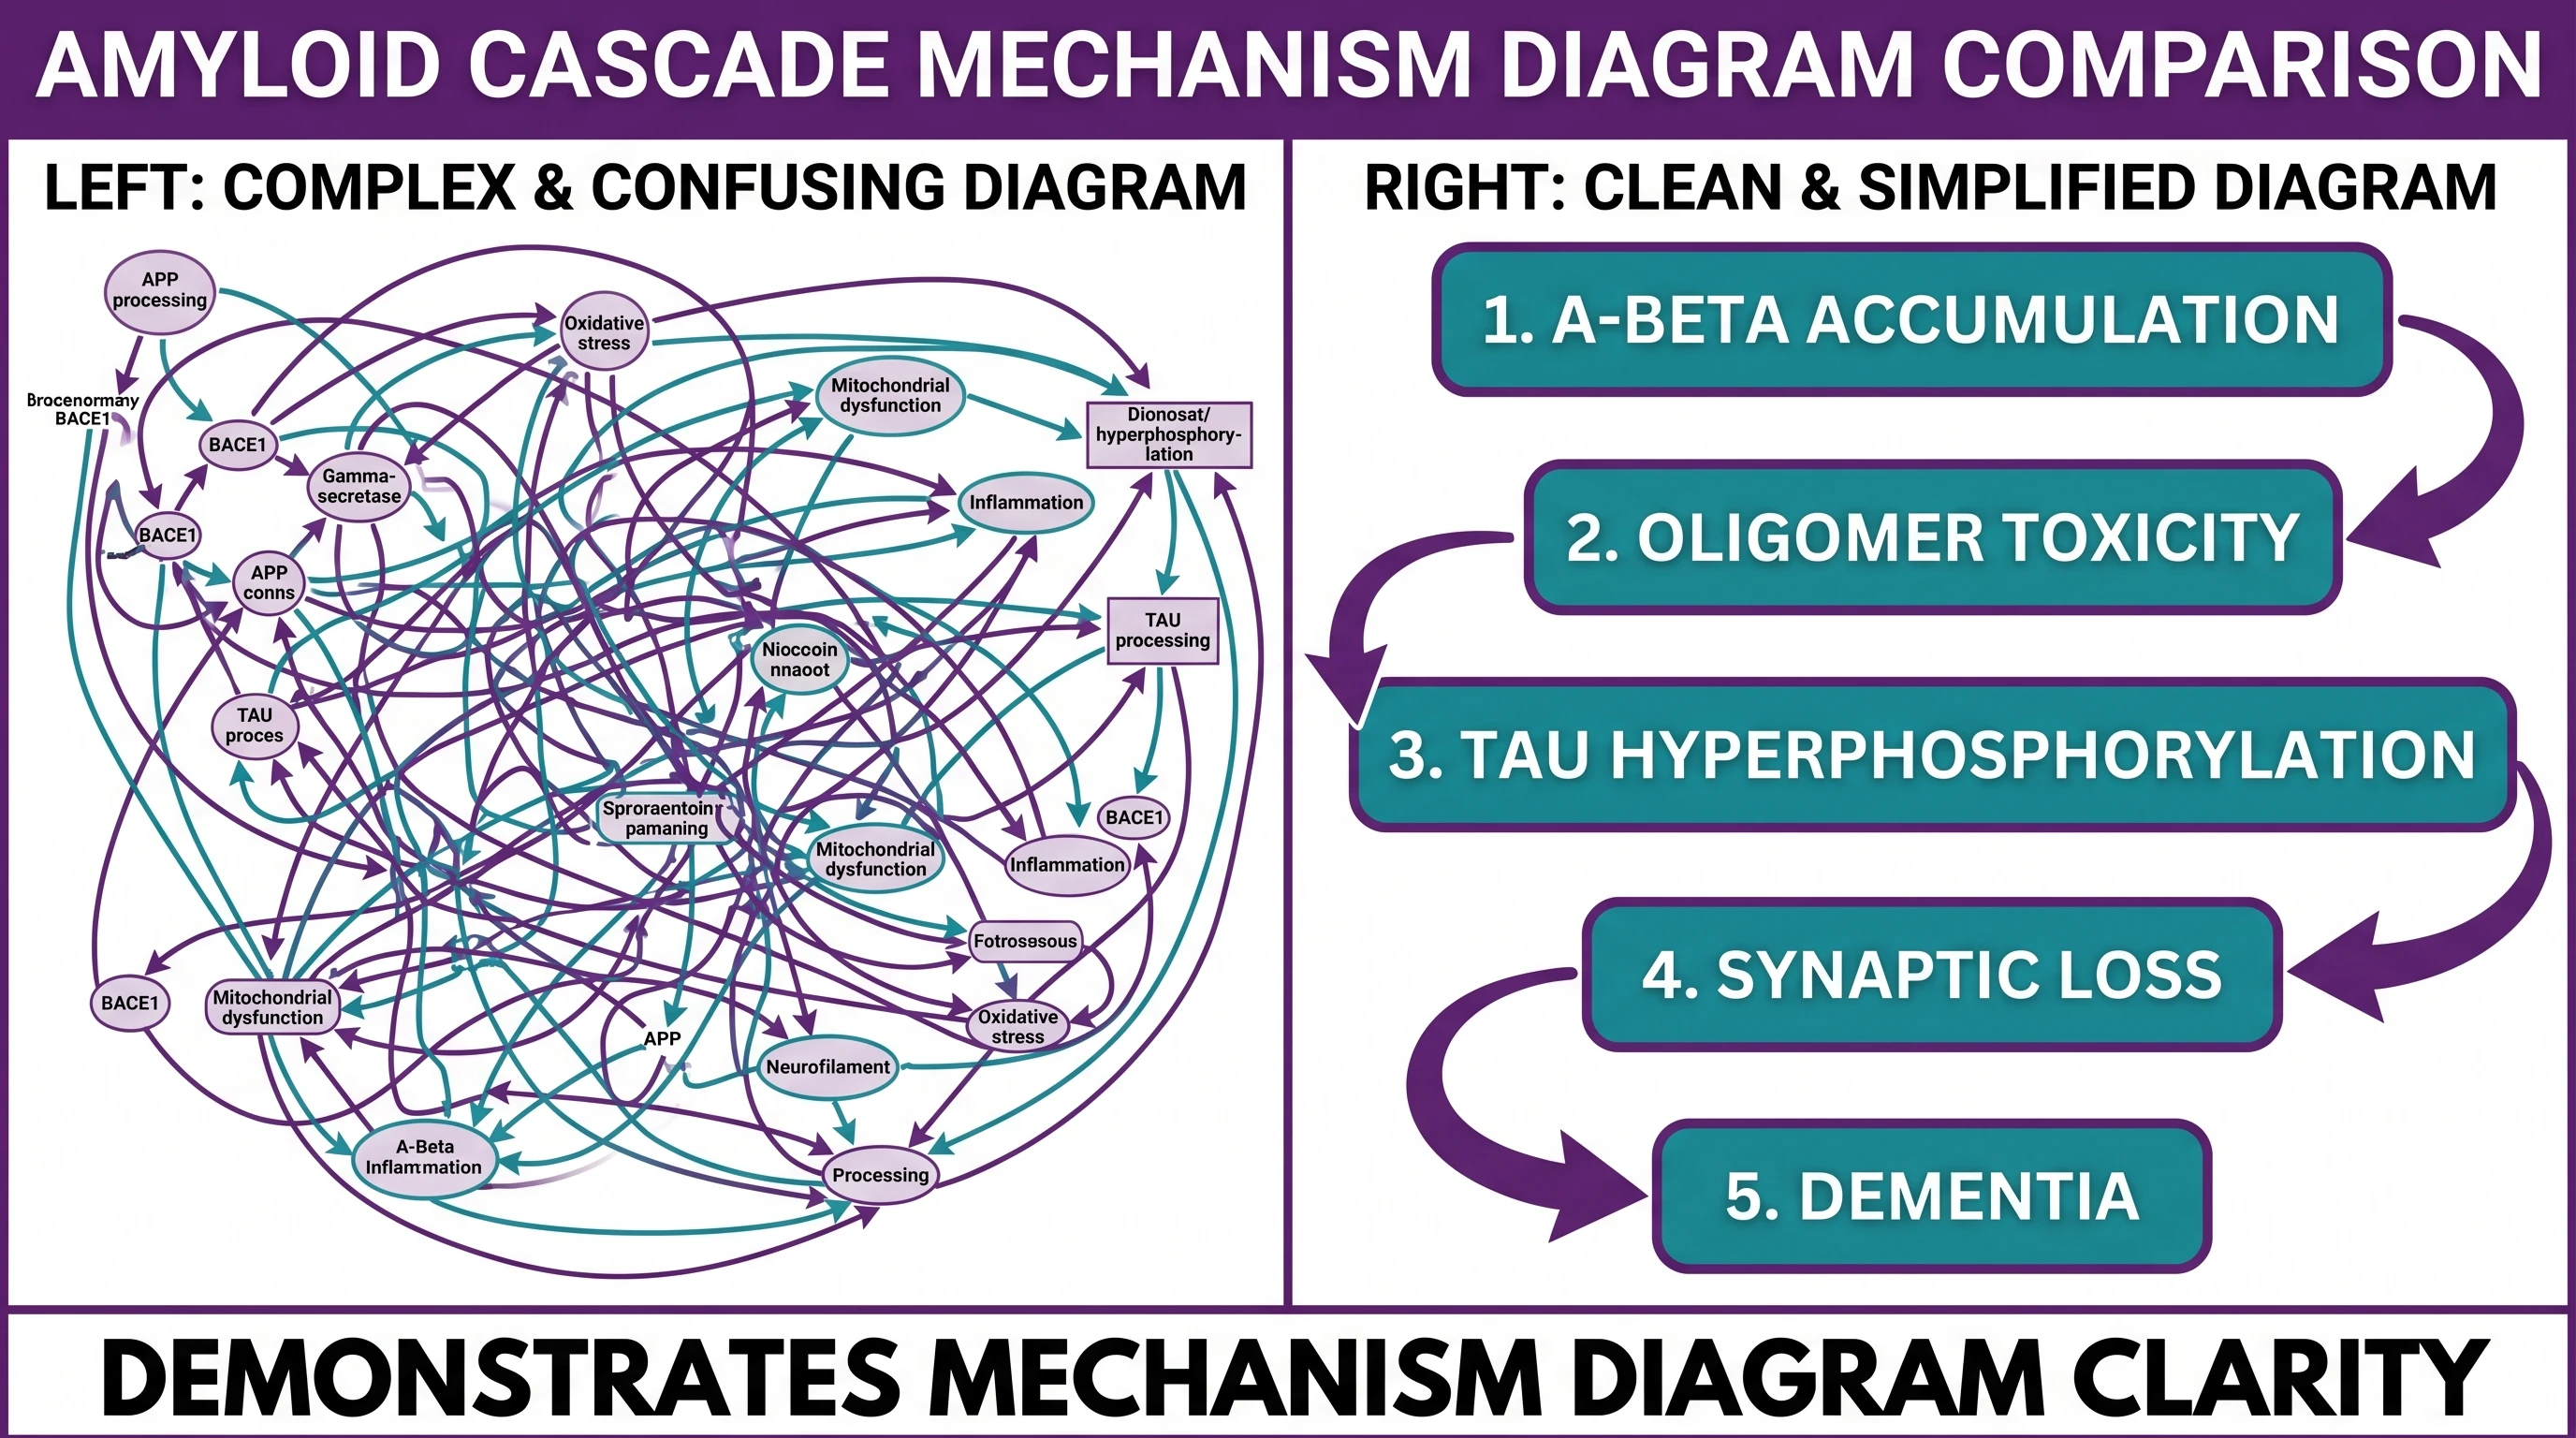
Pair 2 — Cluttered mechanism diagram vs simplified hero version
Mechanism layout — left dense amyloid-tau cascade with 40 molecules and overlapping arrows, right clean 6-node cascade with intervention point highlighted (Figure generated with SciFig)
The bad version packs every molecule from APP through Aβ oligomers through tau hyperphosphorylation through neuroinflammation into one figure no delegate can absorb in 3 seconds. A clearer version distills the cascade to six anchor nodes and highlights your specific intervention point. SciFig can help draft the conceptual illustration; verify its biology and test the labels at the final poster size before using it.
See What SciFig Can Do
Choose Illustration for mechanisms and concepts, DataChart for charts from table data, or FlowChart for editable process and structure diagrams.
Pair 3 — Wall of methods text vs schema replacement
Methods section — left 500-word wall of 10pt text on CSF biomarker workflow, right horizontal CONSORT-style schema with 5 boxes and patient counts (Figure generated with SciFig)
Bad: 500 words of methods in 10-point Calibri describing CSF Aβ42 / p-tau assays, screening, and enrollment — illegible from 3 meters, skipped by every delegate. Winning: A horizontal CONSORT-style schema with 5 phases (screening → enrollment → biomarker assay → follow-up → analysis) and participant counts on each arrow. Methods grasped in 8 seconds, not 8 minutes.
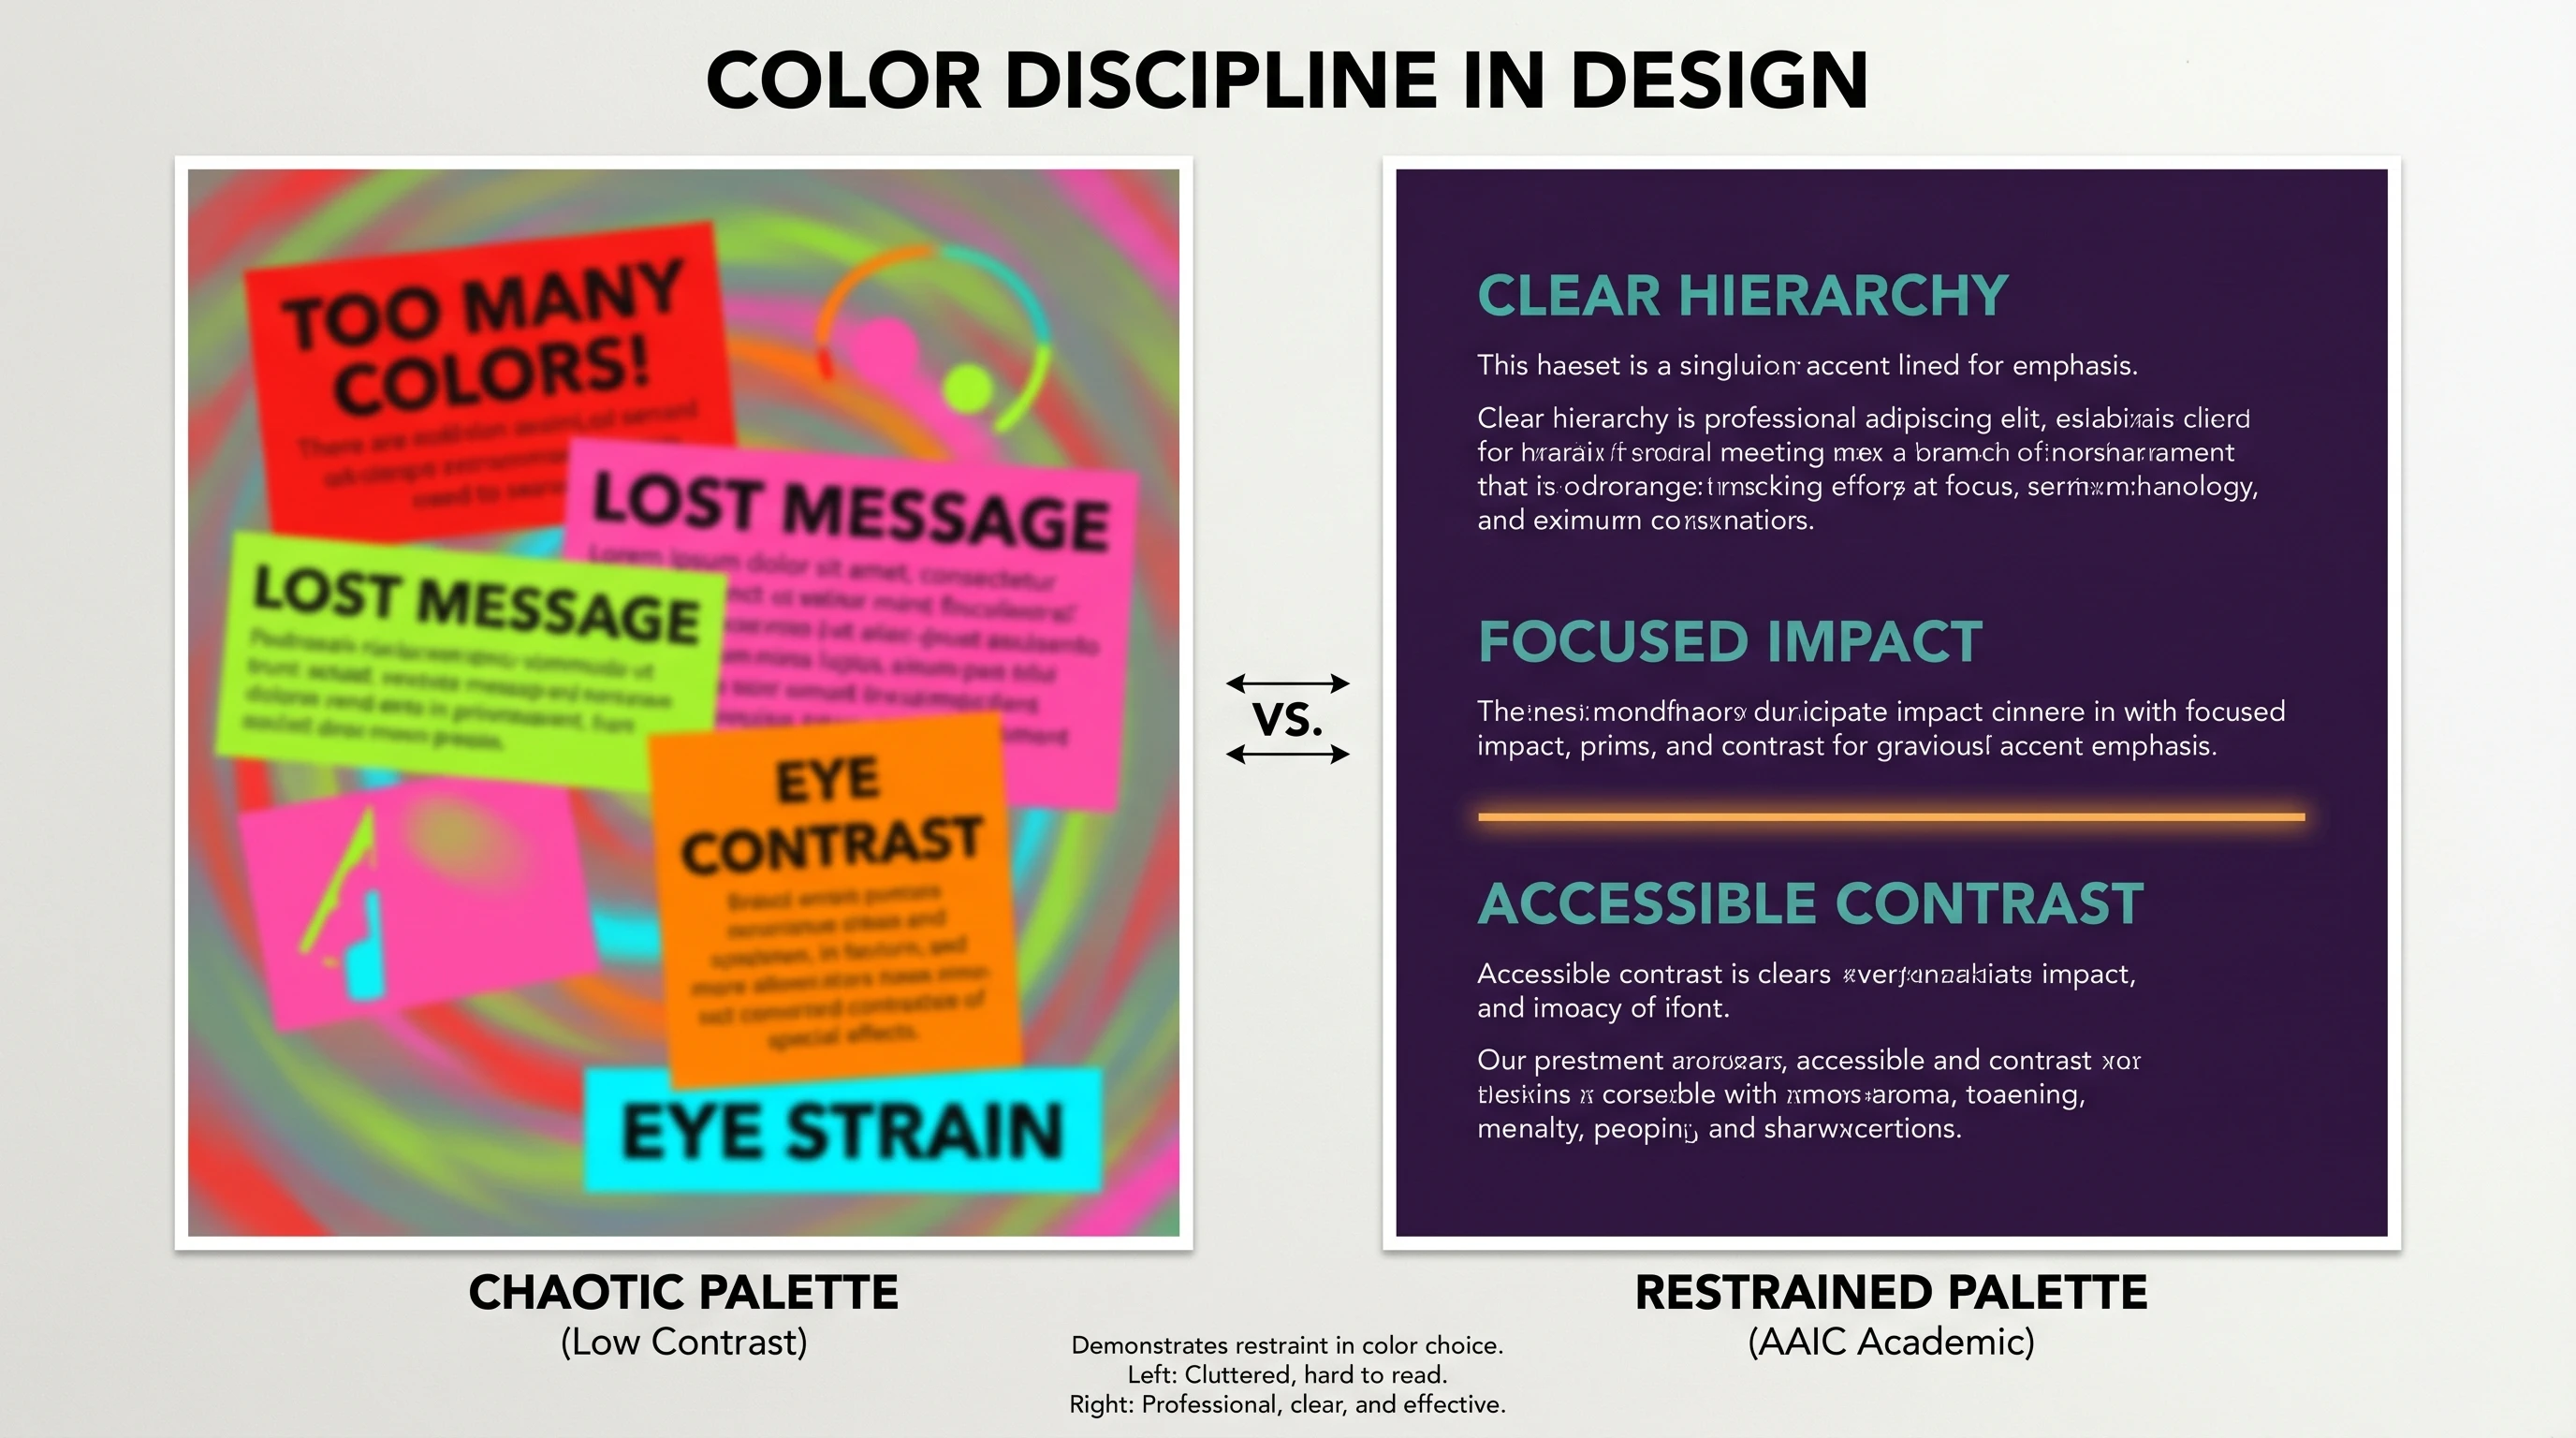
Pair 4 — Chaotic color palette vs disciplined dementia-research palette
Color palette — left chaotic 8-color rainbow used inconsistently across brain panels, right disciplined purple-teal-white palette with consistent semantic meaning (Figure generated with SciFig)
Bad: A rainbow of 8 saturated colors used inconsistently across brain panels — red sometimes meaning "amyloid burden" and sometimes "treatment arm." Eye fatigue sets in within 5 seconds. Winning: A restrained 3-color palette (Alzheimer's Association purple, muted teal accent, white background) with consistent semantic meaning across the poster — purple for amyloid, teal for tau, gray for controls. Red is reserved for warnings or significantly elevated risk.
Pair 5 — Vague descriptive title vs key-finding headline title
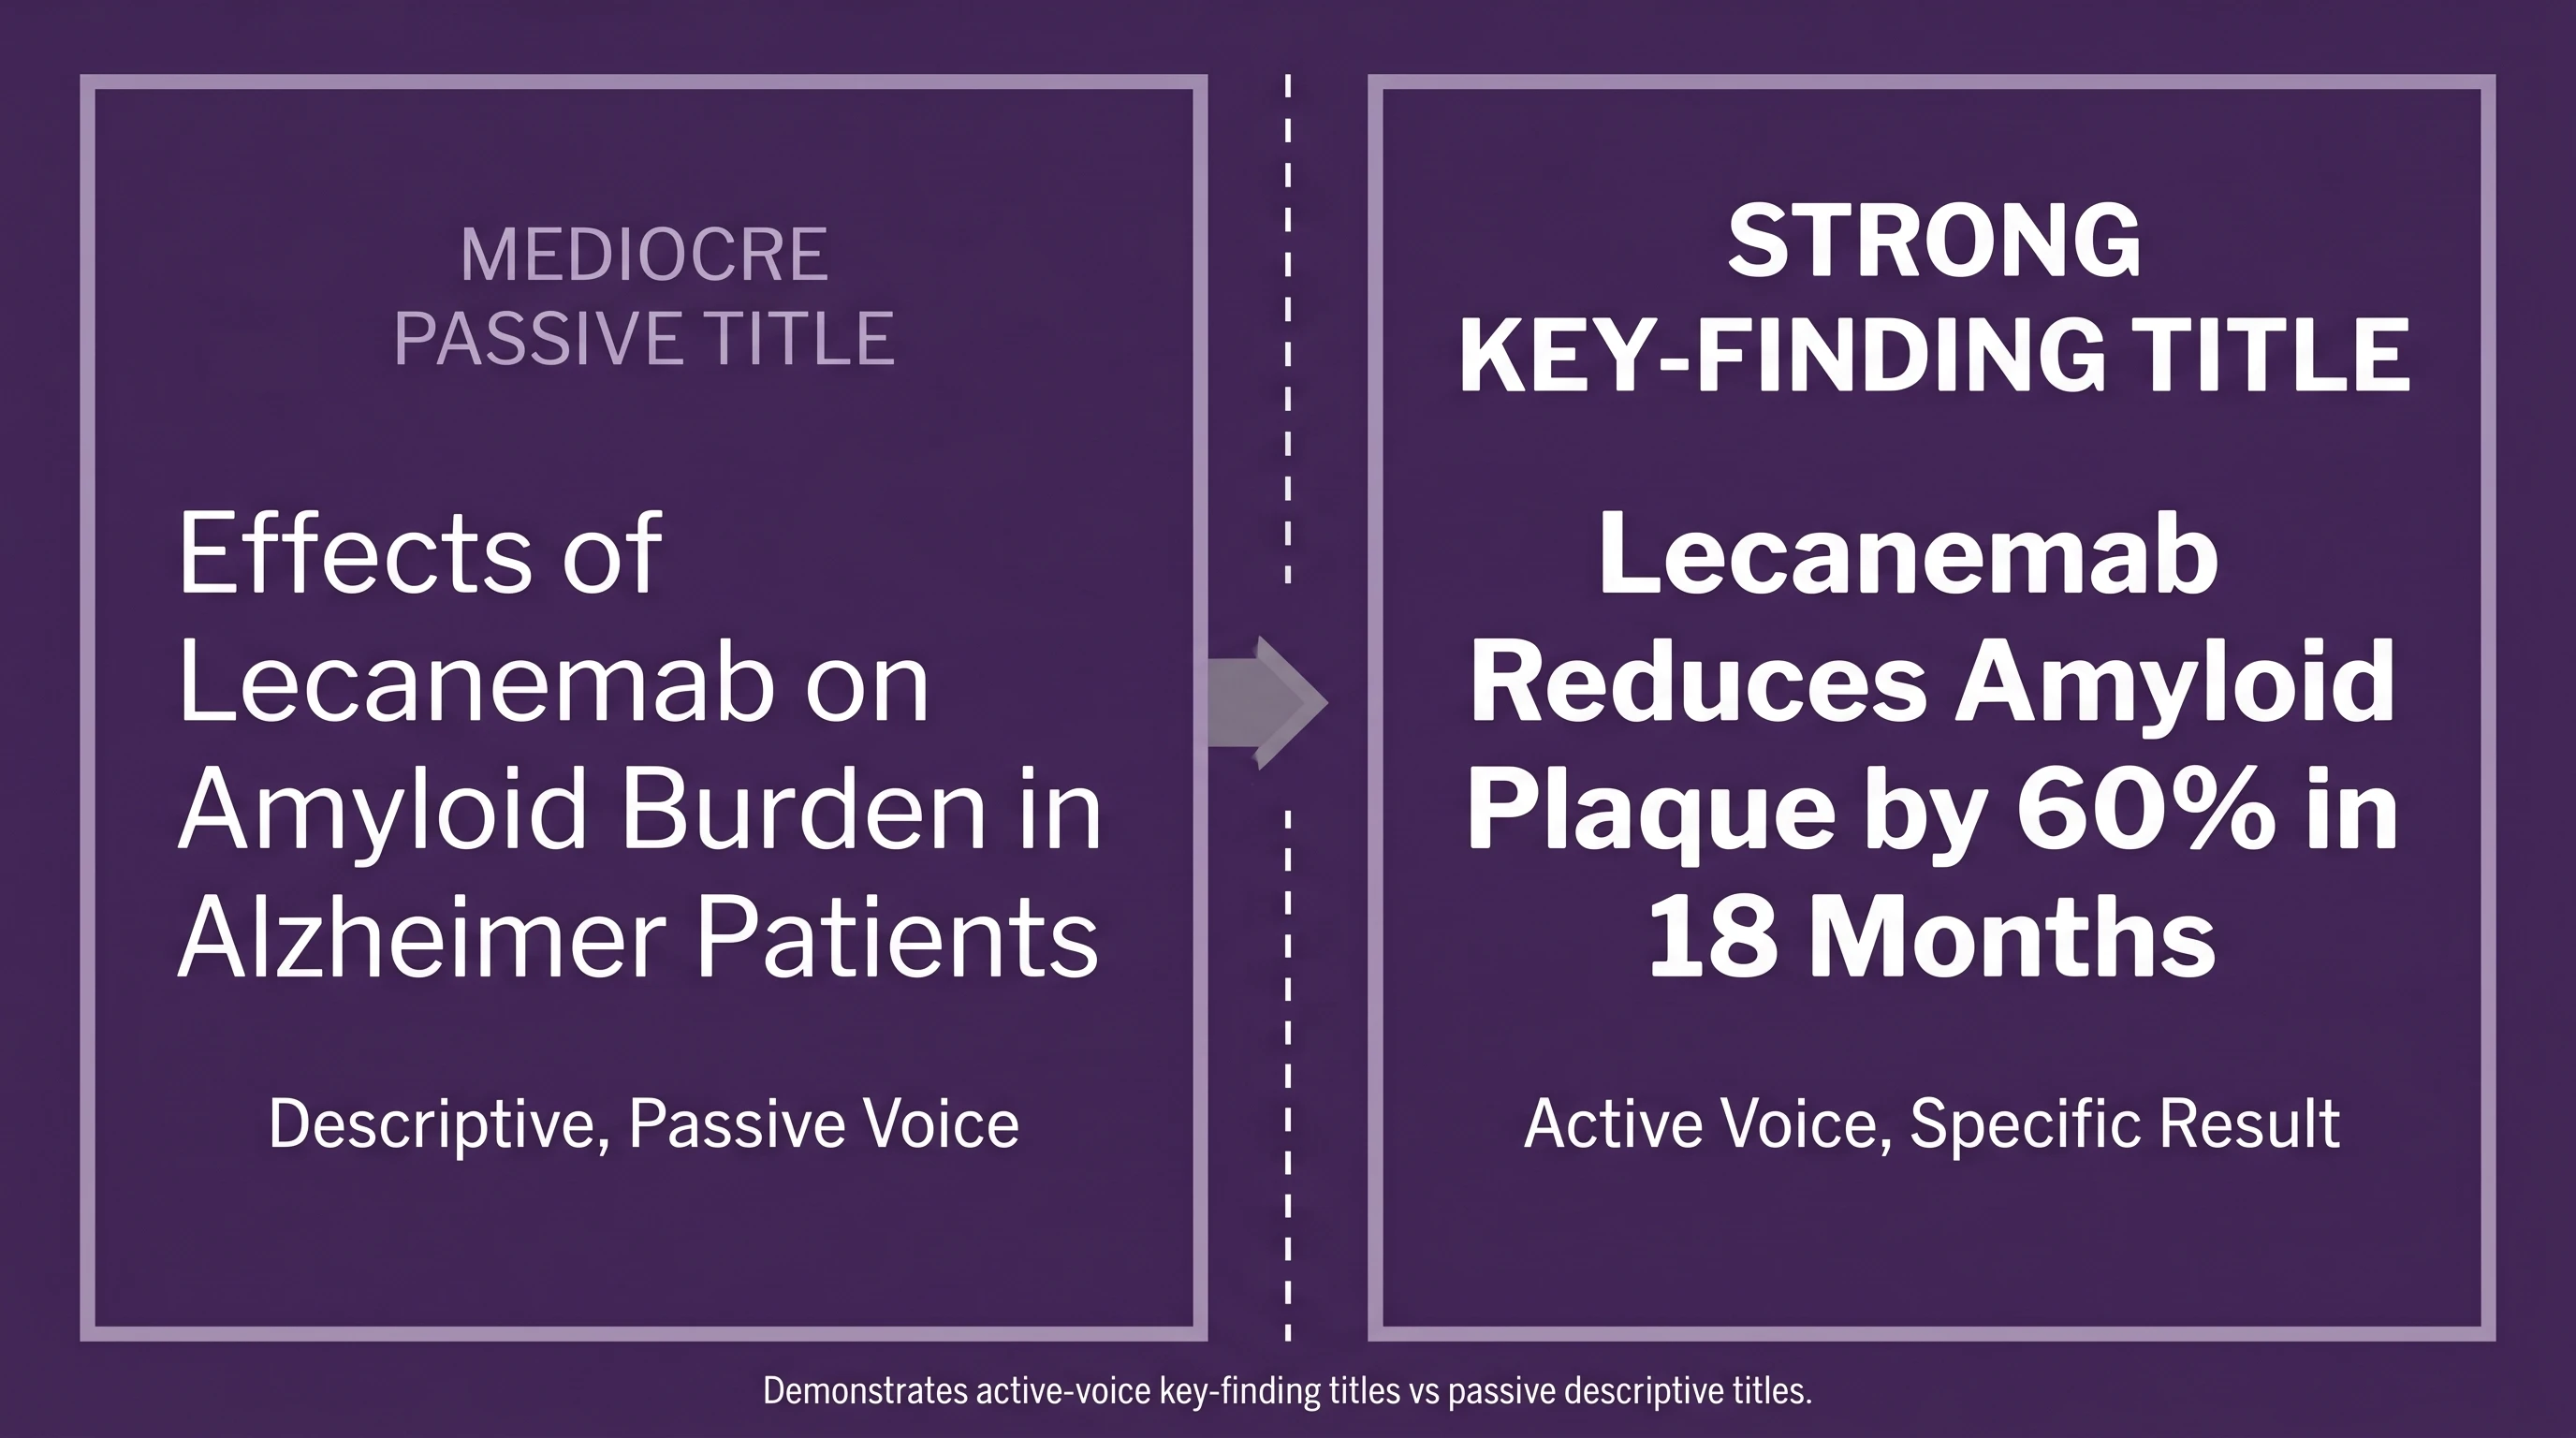
Poster title comparison — left vague descriptive multi-line title, right declarative headline "Lecanemab Reduces Aβ Burden by 60% on PET" (Figure generated with SciFig)
Bad: "A multicenter retrospective analysis of biomarker changes in 318 early Alzheimer's patients treated with anti-amyloid monoclonal antibody therapy." Winning: "Lecanemab reduces amyloid PET burden by 60% in early Alzheimer's: real-world data from 318 patients." The headline version gives the delegate the finding before they decide to stop.
The pattern: the winning version makes a decision about what matters most and lets everything else fall to second priority. The bad version refuses to decide and includes everything.
#
Failure Pattern
Bad Version
Winning Version
Why It Works
1
IHC photo overload
12 small plaque IHC photos in 4×3 grid
1 representative IHC plus 1 labeled schematic
Reviewer sees plaque morphology in 3 seconds, not 30
3-color palette (purple / teal / white) with semantic meaning
Eye finds consistent anchors across panels
5
Vague descriptive title
"A retrospective analysis of biomarker changes..."
"Lecanemab reduces amyloid PET burden by 60%..."
Headline result captured before delegate decides to stop
Tip
You do not need to fix all five failure patterns to win a tier. Pick the one or two failures most acute in your current draft and concentrate the AI-assisted upgrade there. A poster that gets 80% of one pattern right and 60% of the others outperforms a poster that gets 50% of all five — the 3-second test rewards focused decisions, not partial improvements across the board.
6. Common AAIC Poster Disqualifiers: Trade Names, Privacy, Embargo
Beyond design quality, AAIC and the Alzheimer's Association enforce specific submission rules that can disqualify a poster or trigger committee action regardless of how visually polished it is.
Trade names and commercial logos are discouraged or prohibited. Use generic drug names (international nonproprietary names, INN) throughout — lecanemab rather than "Leqembi", donanemab rather than "Kisunla", aducanumab rather than "Aduhelm". A single parenthetical brand mention on first use is acceptable if your audience would not recognize the INN, but the body of the poster, all figure labels, and the conclusion should use INN. Pharmaceutical company logos do not belong on the poster body — sponsor acknowledgment goes in a small disclosures footer.
Patient-identifying information is a hard red line. Any photograph that reveals a participant's face, MRI dataset with identifiable skull or facial reconstruction, or scan label containing a name or hospital ID violates the HIPAA Privacy Rule (HHS HIPAA Privacy Rule) and analogous GDPR requirements in Europe. Defacing of structural MRI and removal of accession numbers and DOBs from all on-poster imagery are non-negotiable. ARIA imaging from anti-amyloid trials is a particular leak risk because original DICOM headers often retain identifiers — confirm with your IRB before reproducing any patient-level imaging.
Encore and salami-slicing rules apply. AAIC accepts true encores when flagged correctly at submission, but unflagged re-presentation of published data, or splitting one cohort across multiple thin abstracts, is a recognized reason posters get pulled.
A final disqualifier — AI-generated content presented as experimental evidence. SciFig Illustration and similar image-generation tools are appropriate for mechanism diagrams, anatomical schematics, and conceptual figures. They are not appropriate for substituting AI output for actual histology, IHC, MRI, or PET data — that would be scientific misconduct. For the full framework on acceptable AI figure use, see are AI-generated figures allowed in journals?.
7. Design System for Winning AAIC 2026 Posters: Color, Typography, Spacing
A winning poster follows a tight design system. Three rules cover most of what matters in dementia-research contexts.
Color: Pick 3 colors and stick to them. A typical AAIC-friendly palette is one dark primary (Alzheimer's Association purple, or a deep navy), one cool accent (muted teal or sage), and white. Use the primary for headers and key labels, the accent for highlights, and white for background. Avoid rainbow palettes, overuse of red (which conventionally signals warning and desensitizes when overused), and color combinations that fail colorblind-safe checks. For IHC and PET overlays, stay with discipline-standard color maps (e.g., diverging blue-to-red for SUVR scales).
Typography: Pick 2 typefaces (one serif, one sans-serif). Hierarchy is established by size, not by introducing new fonts. Title at 80-100pt, section headers at 36-44pt, body text at 24-28pt minimum (10-12pt is invisible from 3 meters). Sans-serif (Helvetica, Lato, Open Sans, Inter) reads better at distance than serif. Italics are for emphasis or species names only.
Spacing: Generous whitespace distinguishes professional from amateur. Margins 5-7 cm, panel spacing ≥3 cm, internal padding so text never hits a border. Resist the instinct to fill space — that is what produces walls of text.
8. From Mediocre to Winning Poster in 1 Hour Using AI
Here is the practical workflow that takes a draft poster figure from "I should fix this" to "this is winning" in under an hour. Each step takes 5–20 minutes; the full sequence fits within a single focused work block.
Step 1: Identify the one figure that fails the 3-second test
(5 minutes) Pick the single weakest figure by 3-second-test criteria — usually the amyloid-tau cascade, the trial schema, or a conceptual brain-atlas figure that consumes the most real estate without communicating quickly. Resist the urge to upgrade all of them; focused replacement of one hero outperforms diffuse polish across many.
Step 2: Articulate the figure in one sentence
(5 minutes) Write one sentence stating what the figure should communicate — e.g., "the amyloid cascade from APP cleavage through Aβ oligomer aggregation to synaptic loss, with our anti-Aβ antibody intervention point at the oligomer stage." That sentence becomes the spine of your SciFig prompt.
Step 3: Generate the first draft with SciFig
Choose the workspace in SciFig that matches each poster panel. DataChart plots your supplied table data as Kaplan–Meier curves, box plots, and forest plots, with dozens of scientific chart types available. FlowChart creates editable SVG trial timelines and participant-flow diagrams. Illustration creates dementia mechanisms and anatomical schematics from a description, PDF, sketch, or reference material.
Choose the panel that needs the clearest explanation. Draw numerical results from your original table in DataChart; use FlowChart for steps and relationships, or Illustration for a conceptual mechanism.
Step 4: Refine in the appropriate workspace
Refine each result in its workspace: adjust column mappings, plotting parameters, and colours in DataChart; edit steps, connections, and labels in FlowChart. Convert Illustration artwork to SVG and refine its vector elements in Vector Canvas. Set the final figure size for the intended panel.
Step 5: Drop into your poster layout
(15 minutes) Place the new figure into your layout, resize neighboring panels to give the hero 30-50% real estate, and re-balance whitespace so the new hero anchors rather than looking pasted-in.
Choose the export that matches the figure. DataChart provides PNG, PDF, EPS, and TIFF plus the plotting code; FlowChart provides SVG, PNG, JPG, and PPTX. Illustration artwork can be converted to SVG, then edited in Vector Canvas. DataChart results can also be converted to SVG for further editing in Canvas.
Start Creating Scientific Figures
Choose Illustration for mechanisms and concepts, DataChart for charts from table data, or FlowChart for editable process and structure diagrams.
9. Beyond the Data: Crossing Over to AAIC's Art Track
Winning poster design and the Beyond the Data visual art competition share more underlying principles than most authors realize. Beyond the Data is the Alzheimer's Association's parallel acceptance path for artistic interpretations of dementia research (official details) — paintings, illustrations, sculptures, photographs, and digital art that visualize a scientific concept rather than presenting raw data. Judges evaluate three things: scientific accuracy, artistic merit, and the clarity with which a single concept is communicated.
That third criterion — single-concept clarity — is identical to what produces a winning Poster Presentation. A Beyond the Data piece that tries to depict the entire amyloid cascade, the entire TREM2 signaling network, and every trial endpoint at once loses. So does a Poster Presentation that tries the same thing. Visual hierarchy, disciplined palette, headline framing, and the "one hero idea" rule all transfer across the boundary.
The difference is what the two formats permit. A regular Poster Presentation must include experimental evidence, methods, and results in a recognizable scientific structure. Beyond the Data permits stylization, metaphor, and emotional resonance — a hand-drawn neuron, a stained-glass connectome, an abstract rendering of memory loss. Authors with a strong Poster Presentation hero figure often grow that same conceptual image into a Beyond the Data submission for the next congress. For the full Beyond the Data rules, eligible media, submission window, and evaluation criteria, see AAIC 2026 poster guidelines and the Beyond the Data art track.
10. Free Trial CTA and Pre-Congress Poster Checklist
Twelve items to confirm before you ship your printed poster to ExCeL London for AAIC 2026 (July 12-15). This is the same checklist that appears in the AAIC 2026 poster guidelines and the Beyond the Data art track overview — keep it open while you finalize.
A winning AAIC poster passes the 3-second test — a delegate walking past the ExCeL London hall must be able to grasp the research question and key finding within three seconds of glancing at it. The mechanics: a clear declarative title visible from 3 meters, one hero figure (typically a brain atlas, amyloid-tau cascade, or biomarker plot) occupying 30-50% of real estate, a 3-color disciplined palette built around Alzheimer's Association purple, body text ≥24pt for legibility, and generous whitespace. Beyond visual design, the ISTAART Fellow Awards recognize the highest-ranked abstracts from early-career researchers, with selection based on both scientific rigor (SPC peer review) and visual presentation quality during the Congress.
Body text below 24pt is effectively invisible from 3 meters. Concretely: title 80-100pt, section headers 36-44pt, body text 24-28pt minimum, figure captions 18-20pt absolute floor. The common failure mode is pasting paragraphs from a manuscript at 10-12pt to fit everything in — the result is dense and unreadable at viewing distance. If you cannot fit your content at ≥24pt, the right fix is to cut the content (replace text with diagrams, move detail to the supplement or the talk), not to shrink the font.
Use generic international nonproprietary names (INN) throughout — lecanemab, not "Leqembi"; donanemab, not "Kisunla"; aducanumab, not "Aduhelm". A single parenthetical brand mention on first use is acceptable if your audience genuinely would not recognize the INN, but the body of the poster, every figure label, and the conclusion should use INN. Pharmaceutical company logos do not belong on the poster body — sponsor acknowledgment goes in a small disclosures footer. AAIC and most dementia journals enforce this convention to avoid the appearance of commercial promotion.
Only after rigorous de-identification, and never with identifying detail intact. Photographs that reveal a participant's face, MRI datasets with identifiable skull or facial reconstruction, and scan labels containing names, DOBs, or hospital IDs violate the HIPAA Privacy Rule (HHS guidance) in the United States and analogous GDPR requirements in Europe. Defacing of structural MRI before display is now standard practice; ARIA imaging from anti-amyloid trials is a particular leak risk because original DICOM headers often retain identifiers. Confirm with your IRB before reproducing any patient-level imagery and document the de-identification step in your methods.
Poster Presentations require experimental evidence, methods, and results in a recognizable scientific structure; Beyond the Data permits stylized, metaphorical, or emotionally resonant visualizations of a scientific concept without the requirement for raw data. Submission to Beyond the Data is a separate track during the AAIC abstract window, judged on scientific accuracy, artistic merit, and single-concept clarity. The underlying design principles — hierarchy, disciplined palette, one dominant idea — transfer across both formats. For the full Beyond the Data submission window, eligible media, and evaluation criteria, see the AAIC 2026 poster guidelines.
Disclaimer: This article is educational content focused on scientific figure design for conference posters and publications. It is not medical advice and should not be used for clinical decisions. The disease mechanisms, drug indications, and treatment protocols referenced here are summarized from peer-reviewed sources and AAIC official materials; for clinical practice, consult primary literature, official treatment guidelines (e.g., NIA / Alzheimer's Association / NCCN), and licensed clinicians. SciFig is a scientific figure tool — it does not diagnose, treat, or advise on patient care.
Keep going
Recommended resources
Templates, tools, and further reading for your research