
Guides
Long-form guides for researchers covering scientific figure workflows, budget-friendly production, and quality standards for publication-ready visuals.
Articles
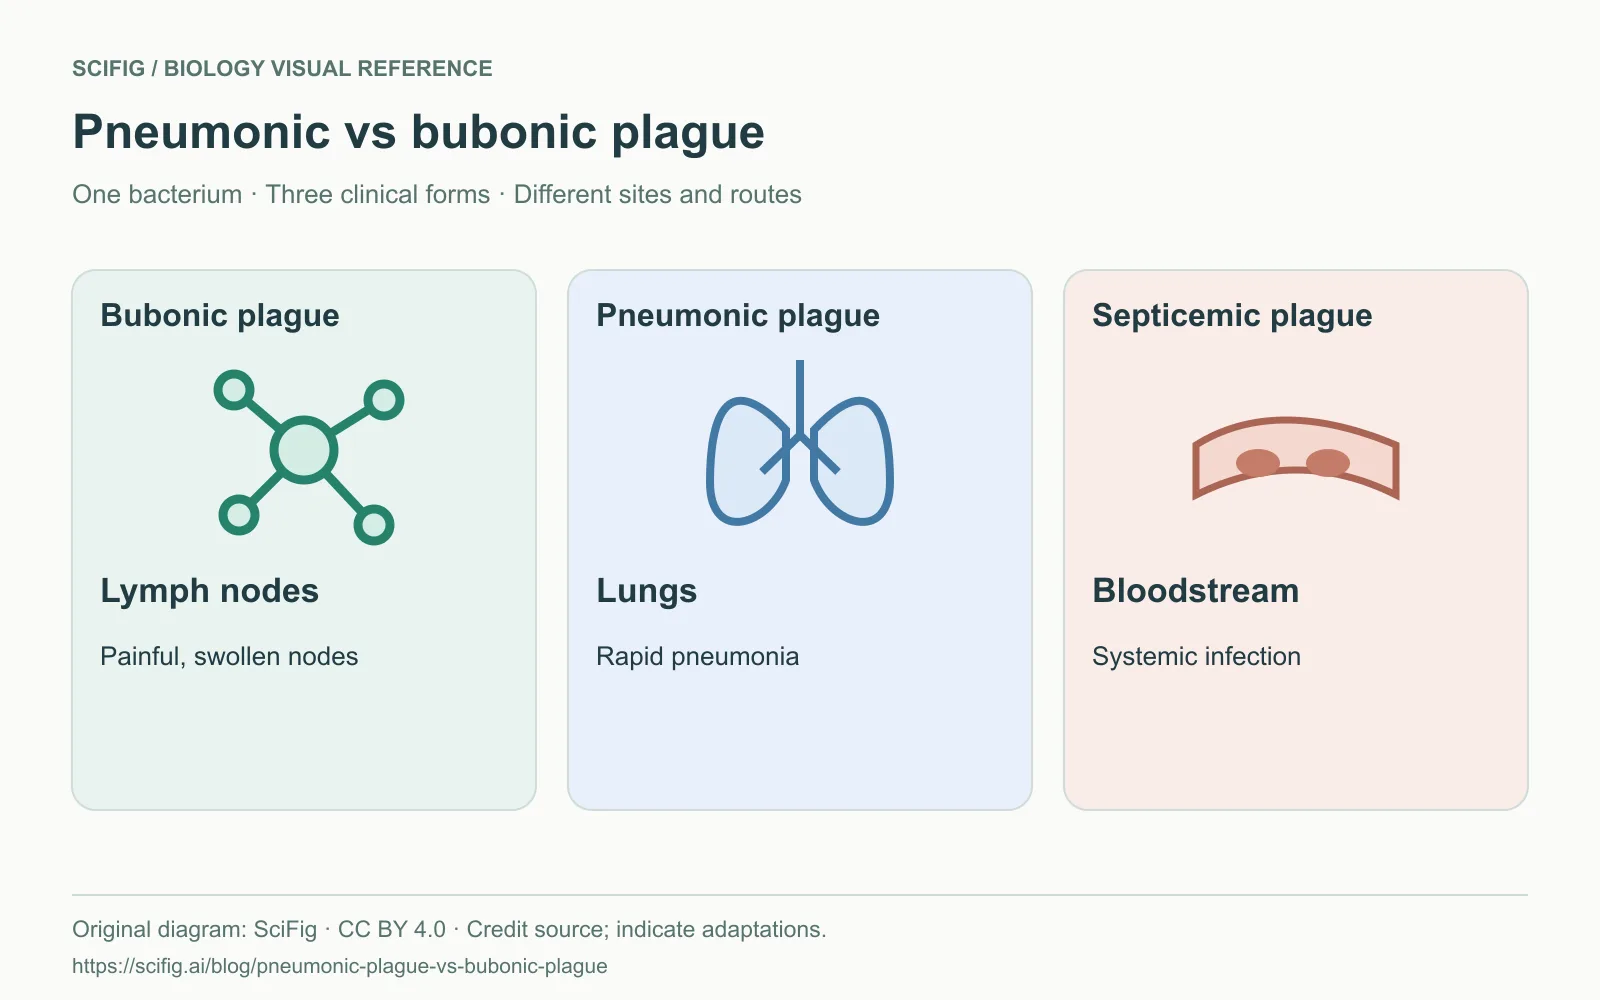
Pneumonic Plague vs Bubonic Plague: Chart & Diagrams
Compare pneumonic, bubonic and septicemic plague with a clear chart and transmission diagrams. Download free PNGs and editable SVGs for lessons and slides.
 SciFig Team·
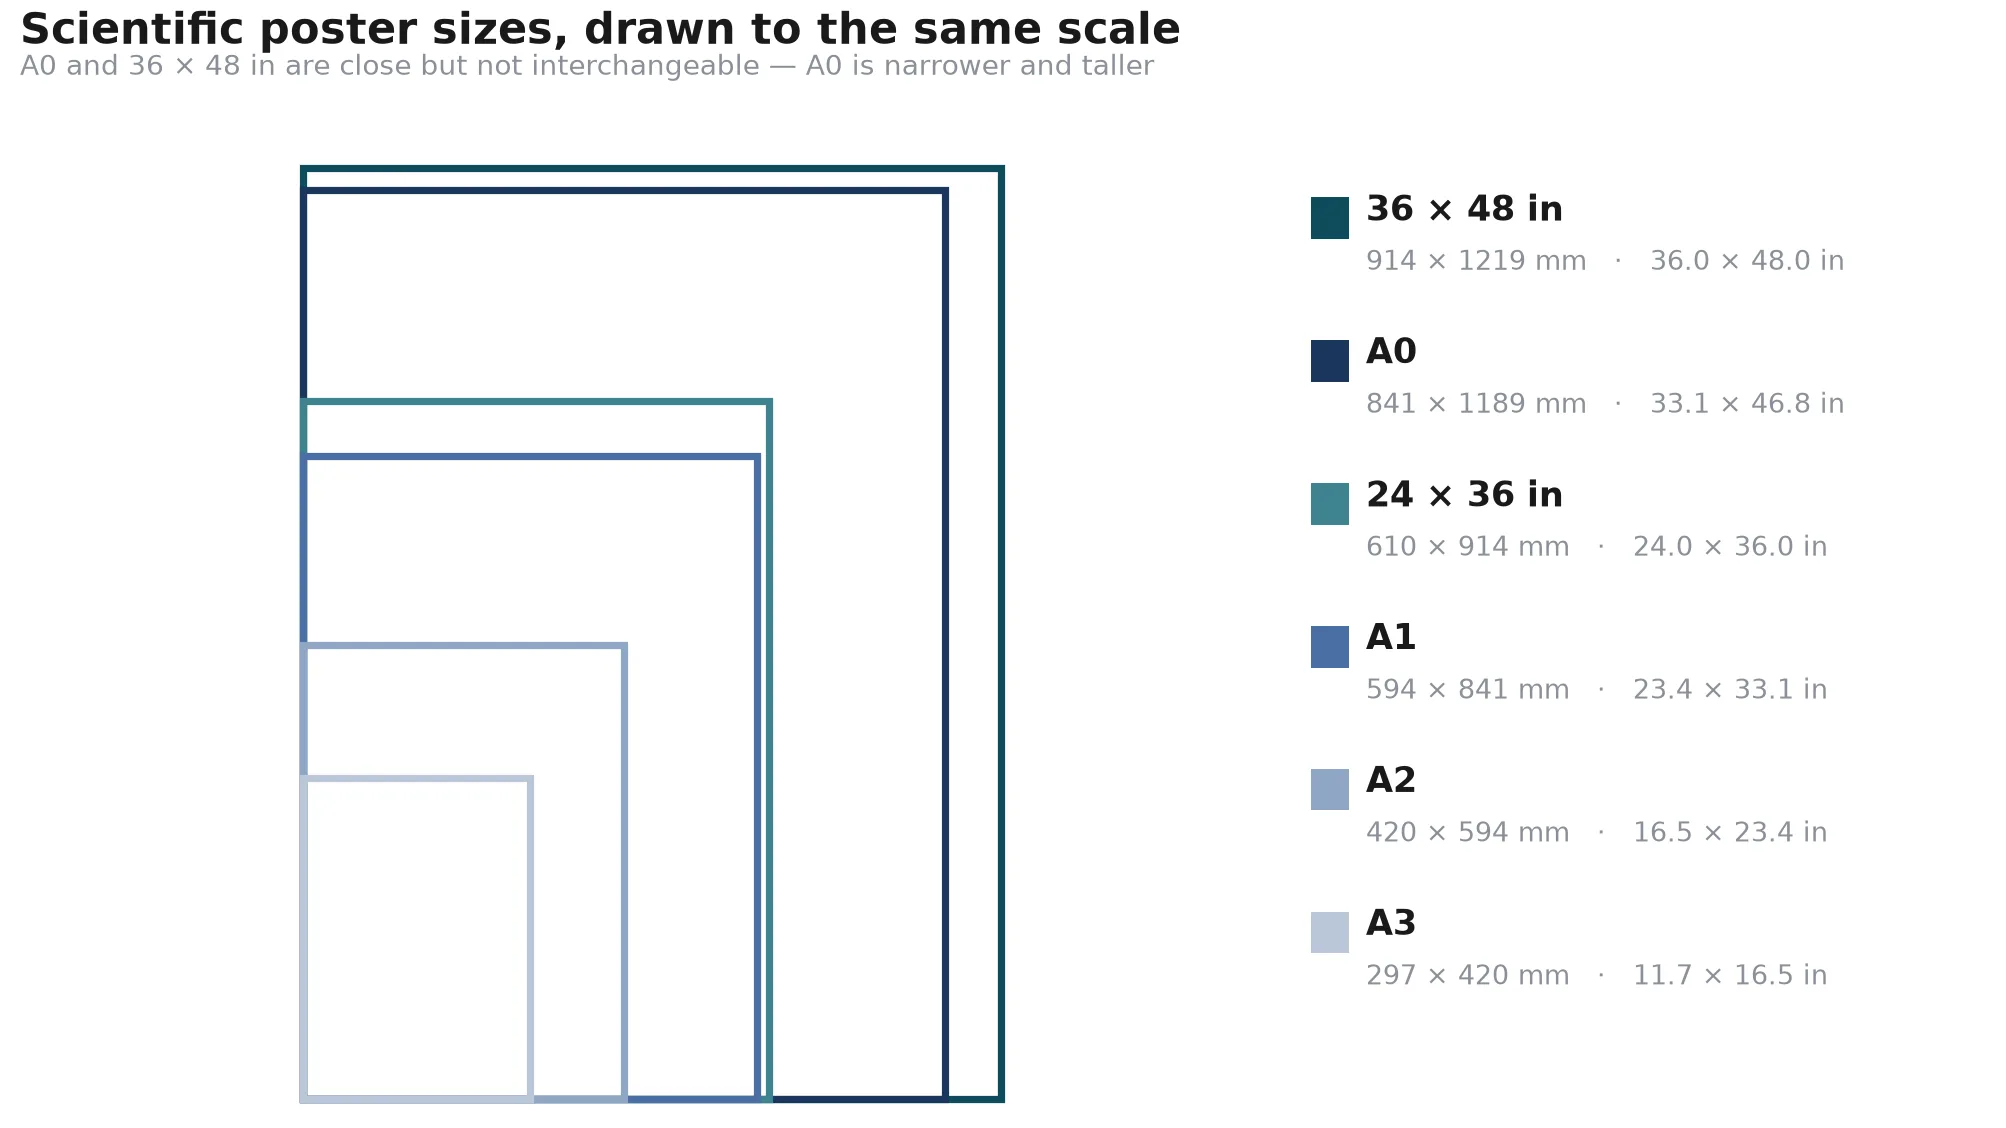
Scientific Poster Dimensions: Sizes and Layout Guide
Scientific poster dimensions in mm, cm and inches — A0 to A3, 36x48, 24x36 — plus how many columns each size holds and what conferences actually require.
SciFig Team·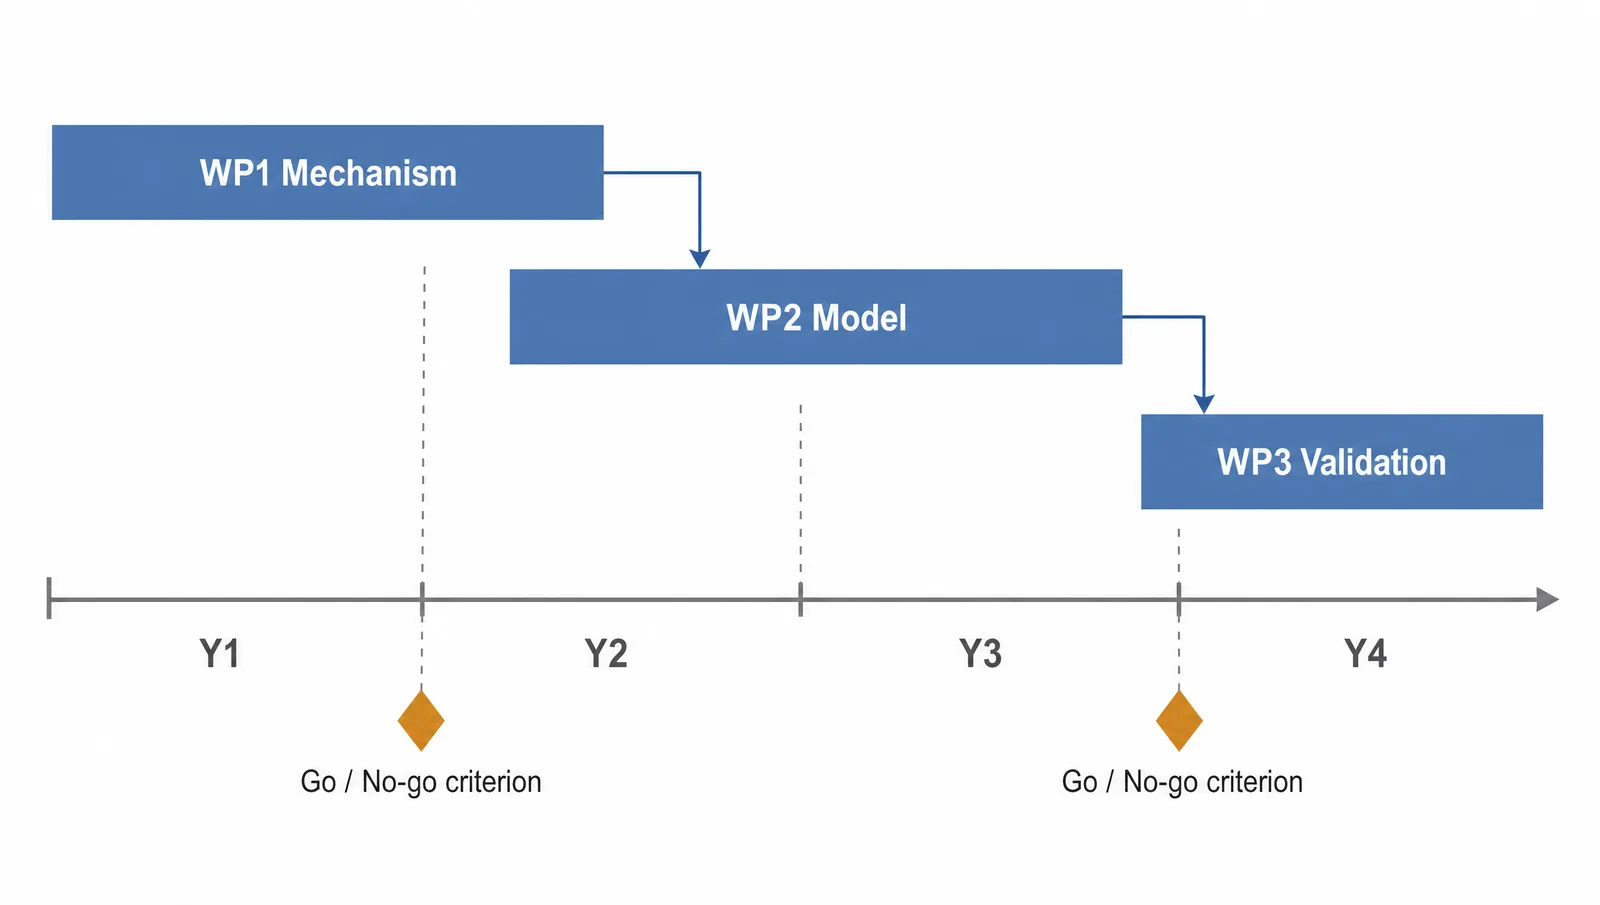
Research Roadmap Figure: How to Draw One Reviewers Trust
A research roadmap figure shows how your aims connect, when they happen, and what depends on what. Three layouts that work, and what to leave out.
SciFig Team·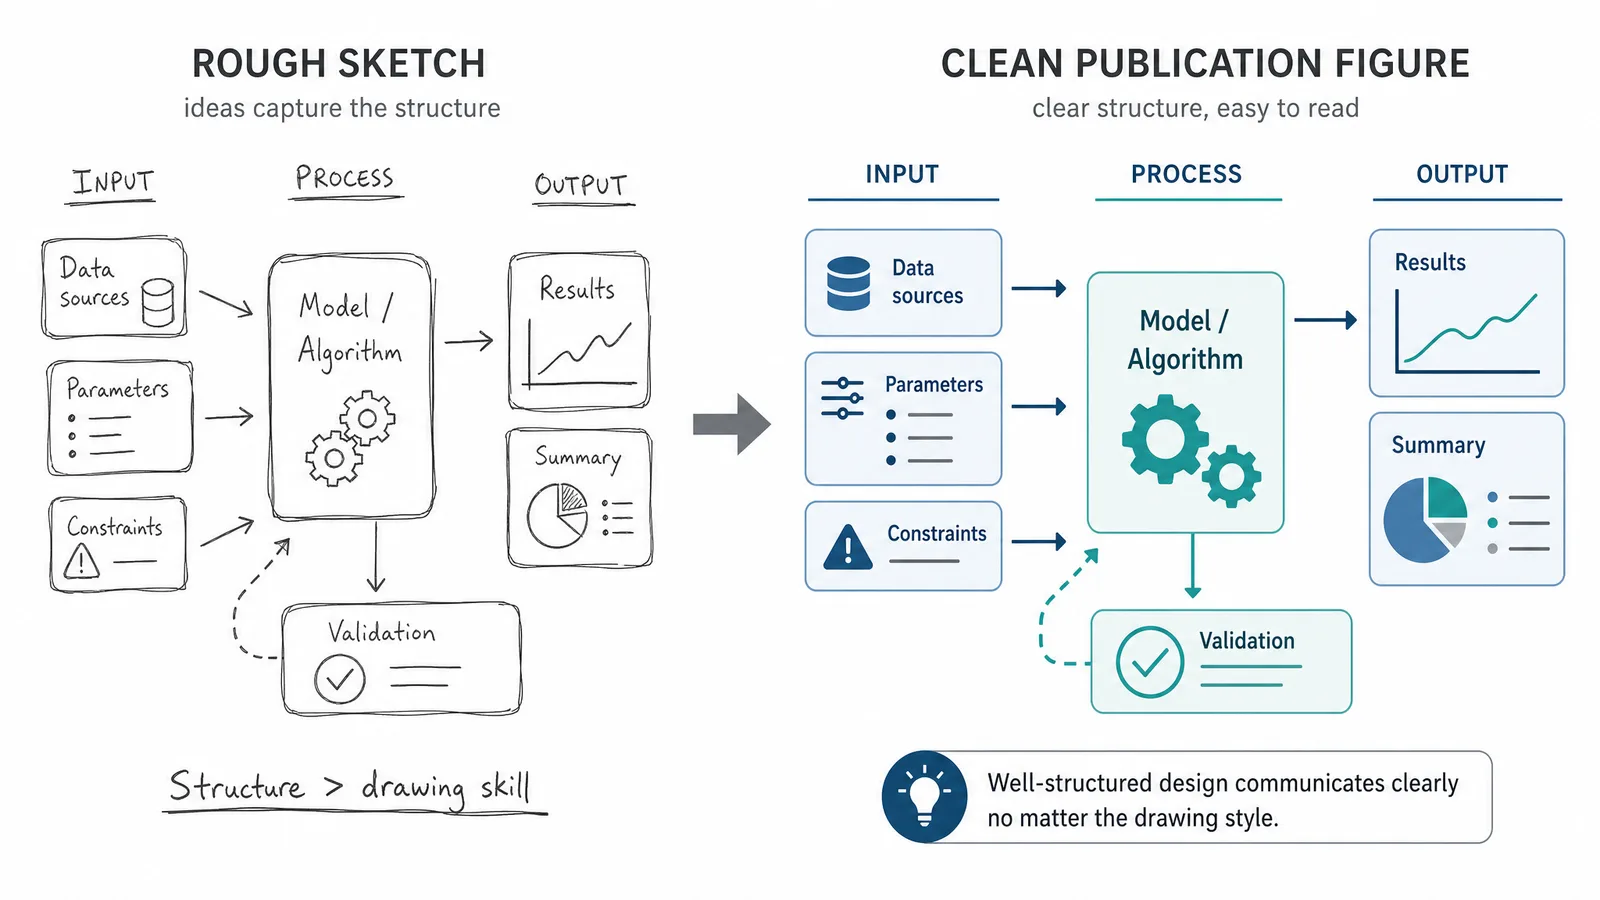
How to Make Scientific Figures: A Practical Guide (2026)
Learn how to make scientific figures from idea to publication: choose software, build a clear layout, avoid common errors, and export a readable final file.
SciFig Team·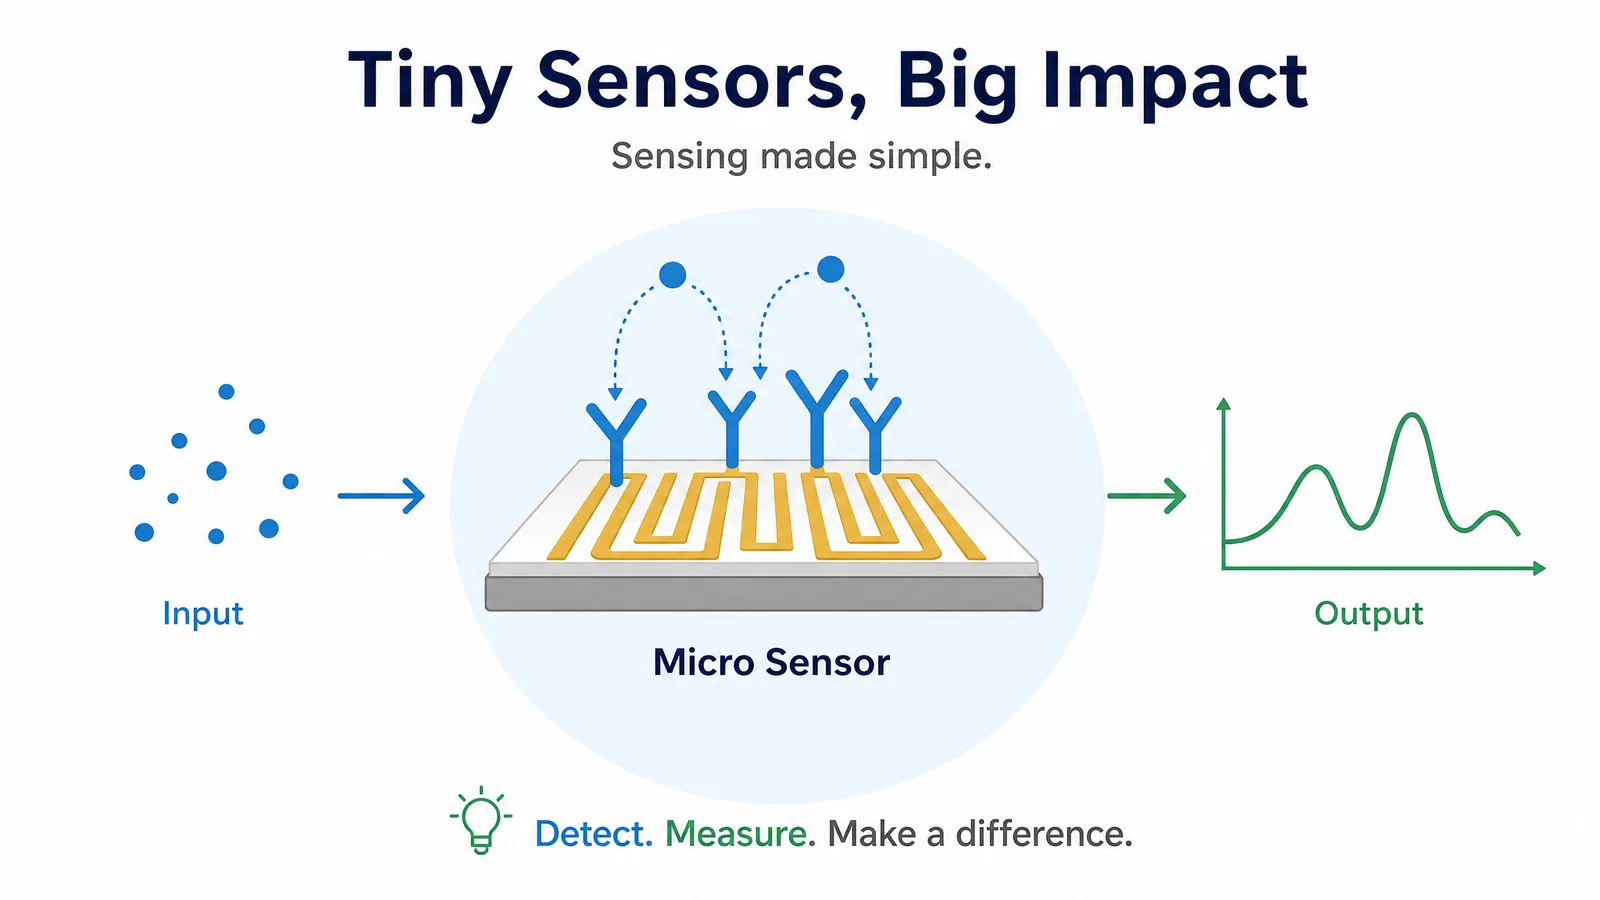
3 Minute Thesis Slide: Design Guide (2026)
How to design the single static slide for a Three Minute Thesis, covering the one-idea rule, visual hierarchy, common judging criteria, and what to leave out.
SciFig Team·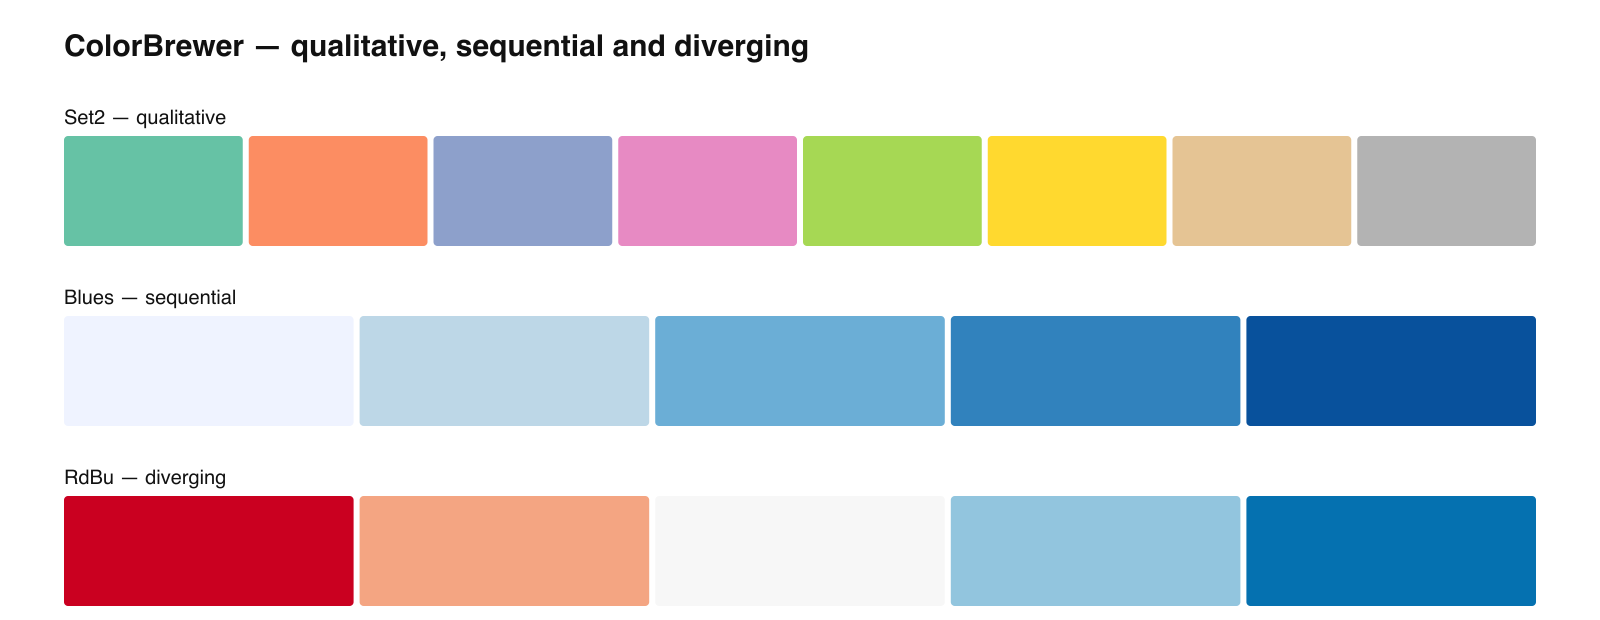
ColorBrewer Palettes for Scientific Figures
ColorBrewer hex codes for Set2, Dark2, Paired, Blues, RdBu, and RdYlBu, with guidance on picking sequential, diverging, or qualitative for research data.
SciFig Team·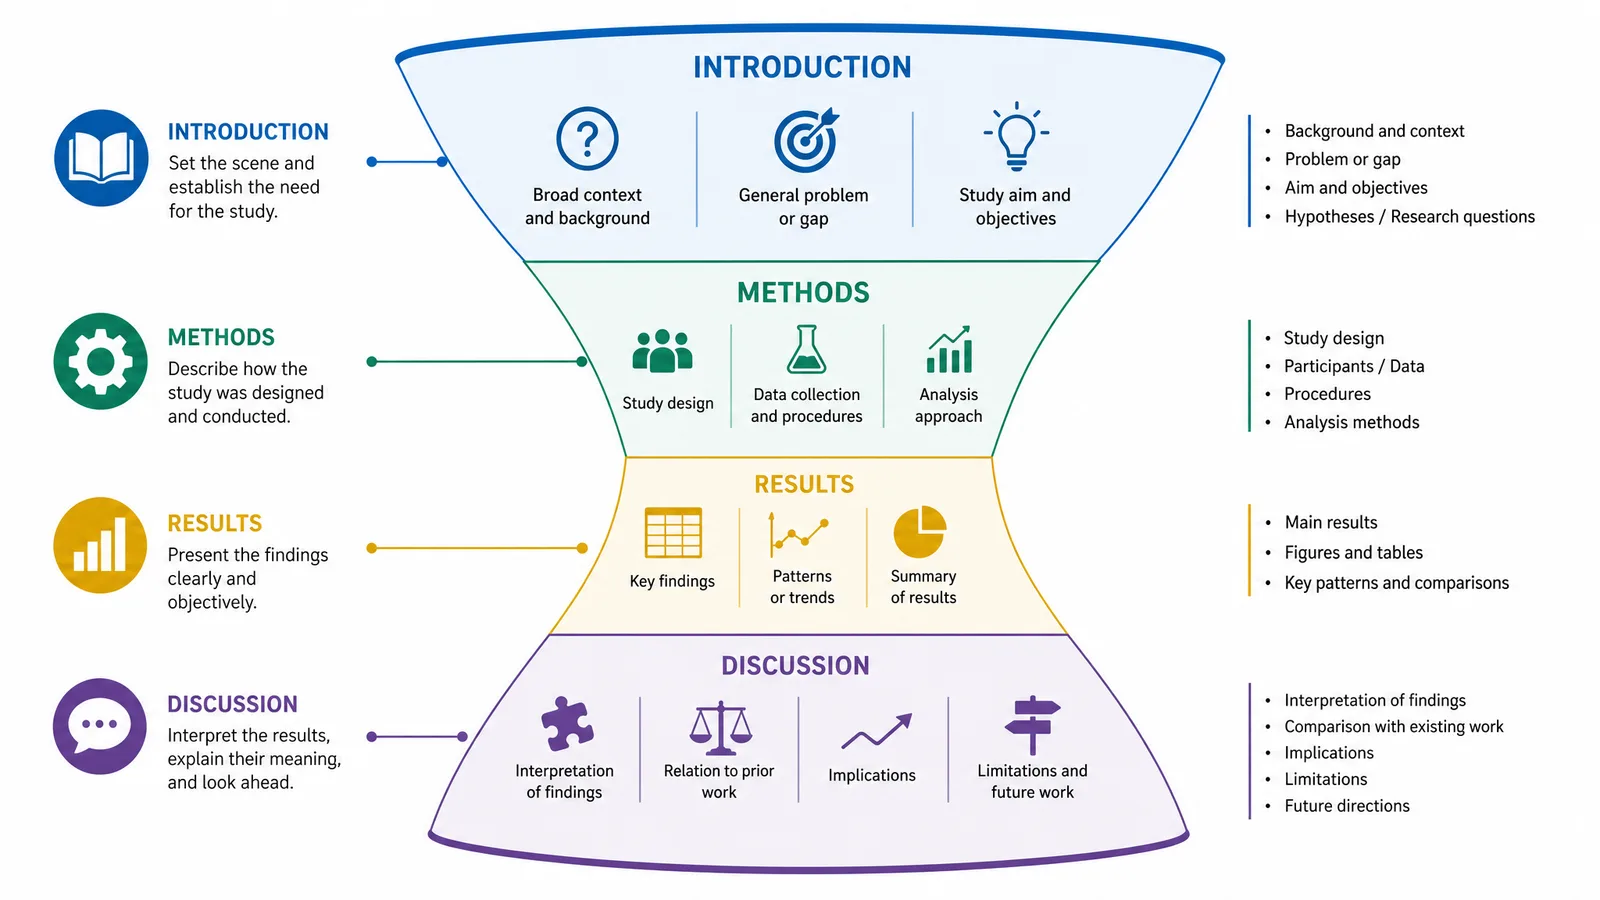
IMRaD Format: Structure a Research Paper
What IMRaD stands for, what belongs in each section, the mistakes that blur the boundaries, and how figures map onto the structure in a research paper.
SciFig Team·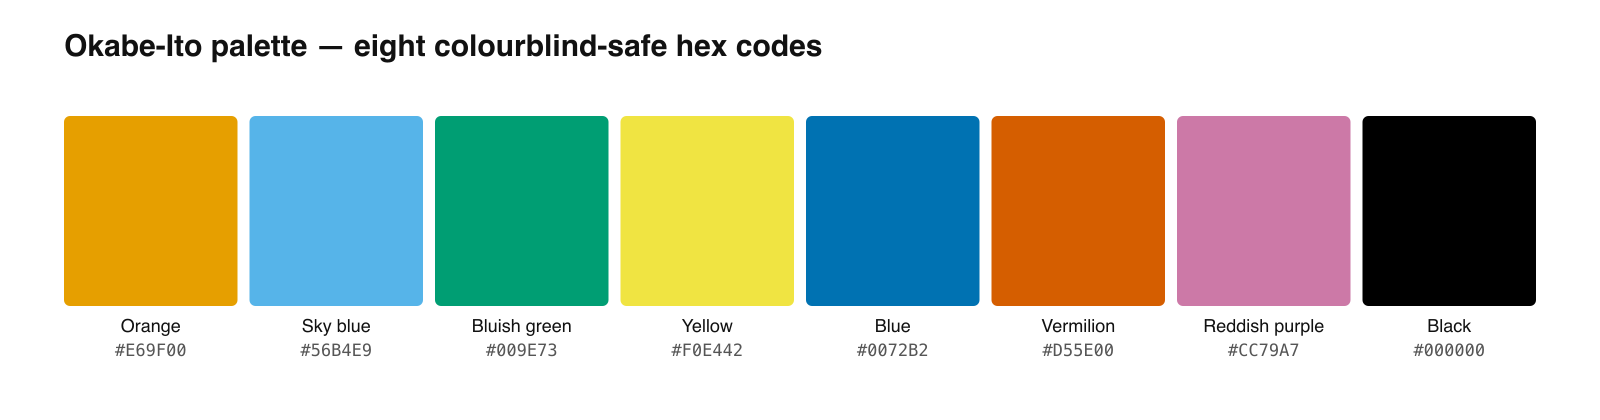
Okabe-Ito Color Palette: Hex Codes Reference
All eight Okabe-Ito hex codes with RGB values, colorblind-safe ordering rules, and copy-ready R, Python, and CSS snippets for scientific figures.
SciFig Team·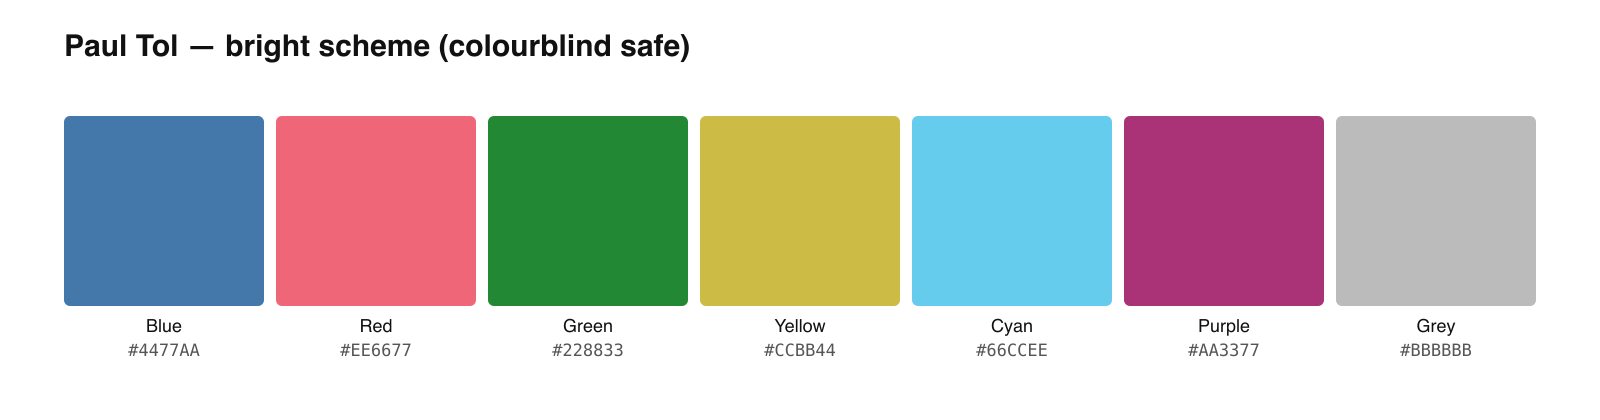
Paul Tol Color Schemes: Hex Codes Reference
Paul Tol's bright, high-contrast, vibrant, and muted scheme hex codes, when to pick each, and copy-ready snippets for colorblind-safe scientific figures.
SciFig Team·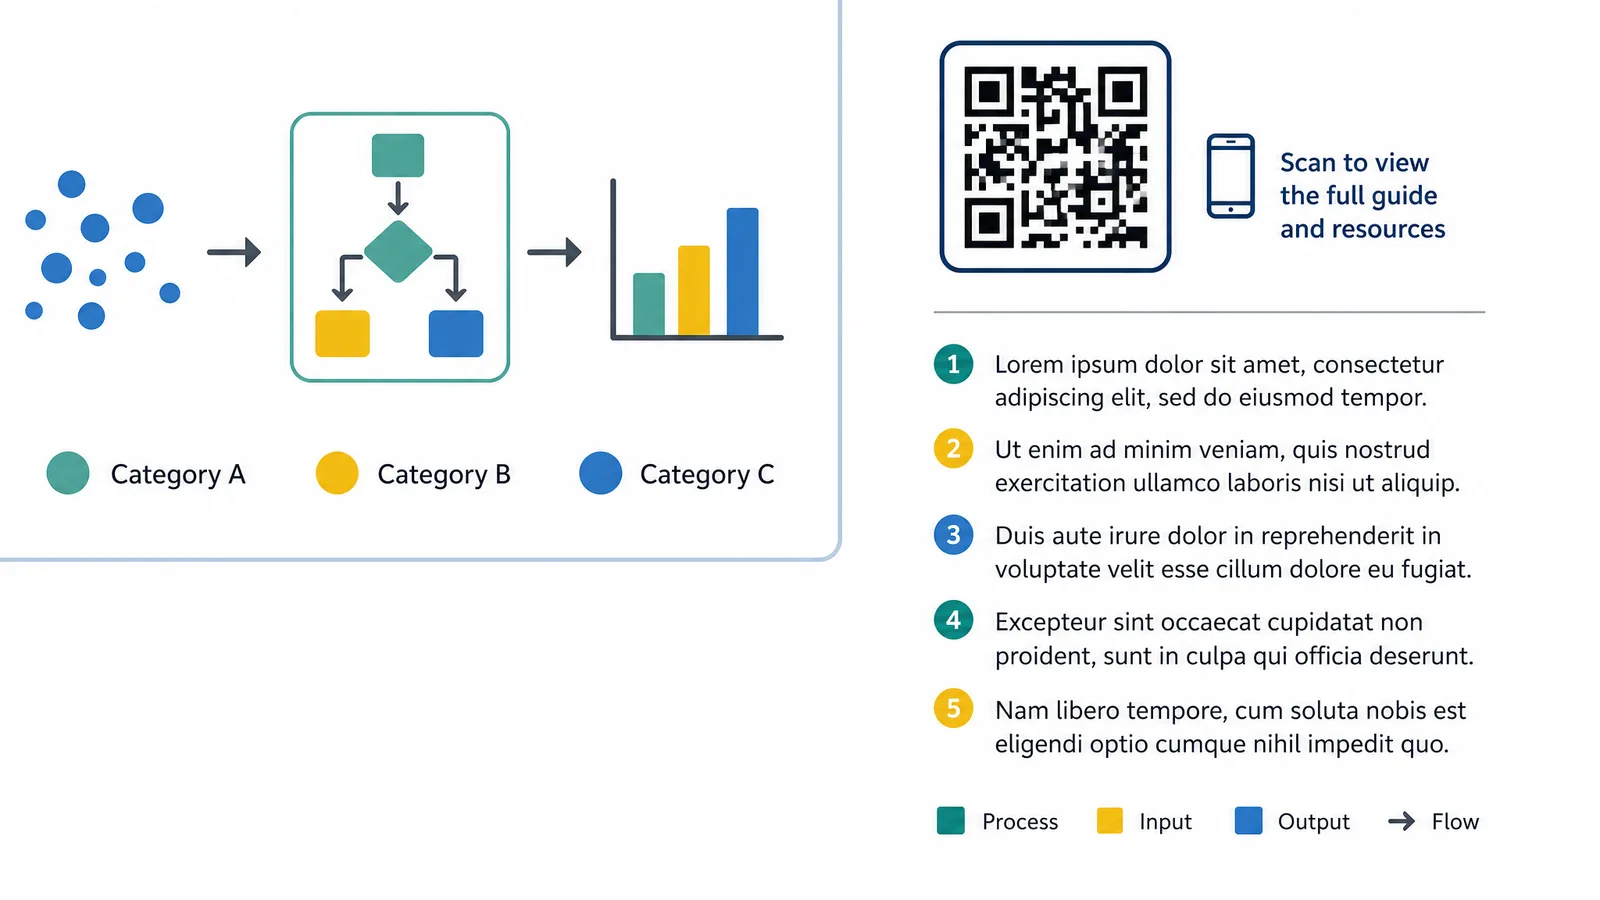
Poster References: How to Format Them
How to format references on a research poster, including how many to include, sizing, numbered versus author-date styles, and using QR codes for full lists.
SciFig Team·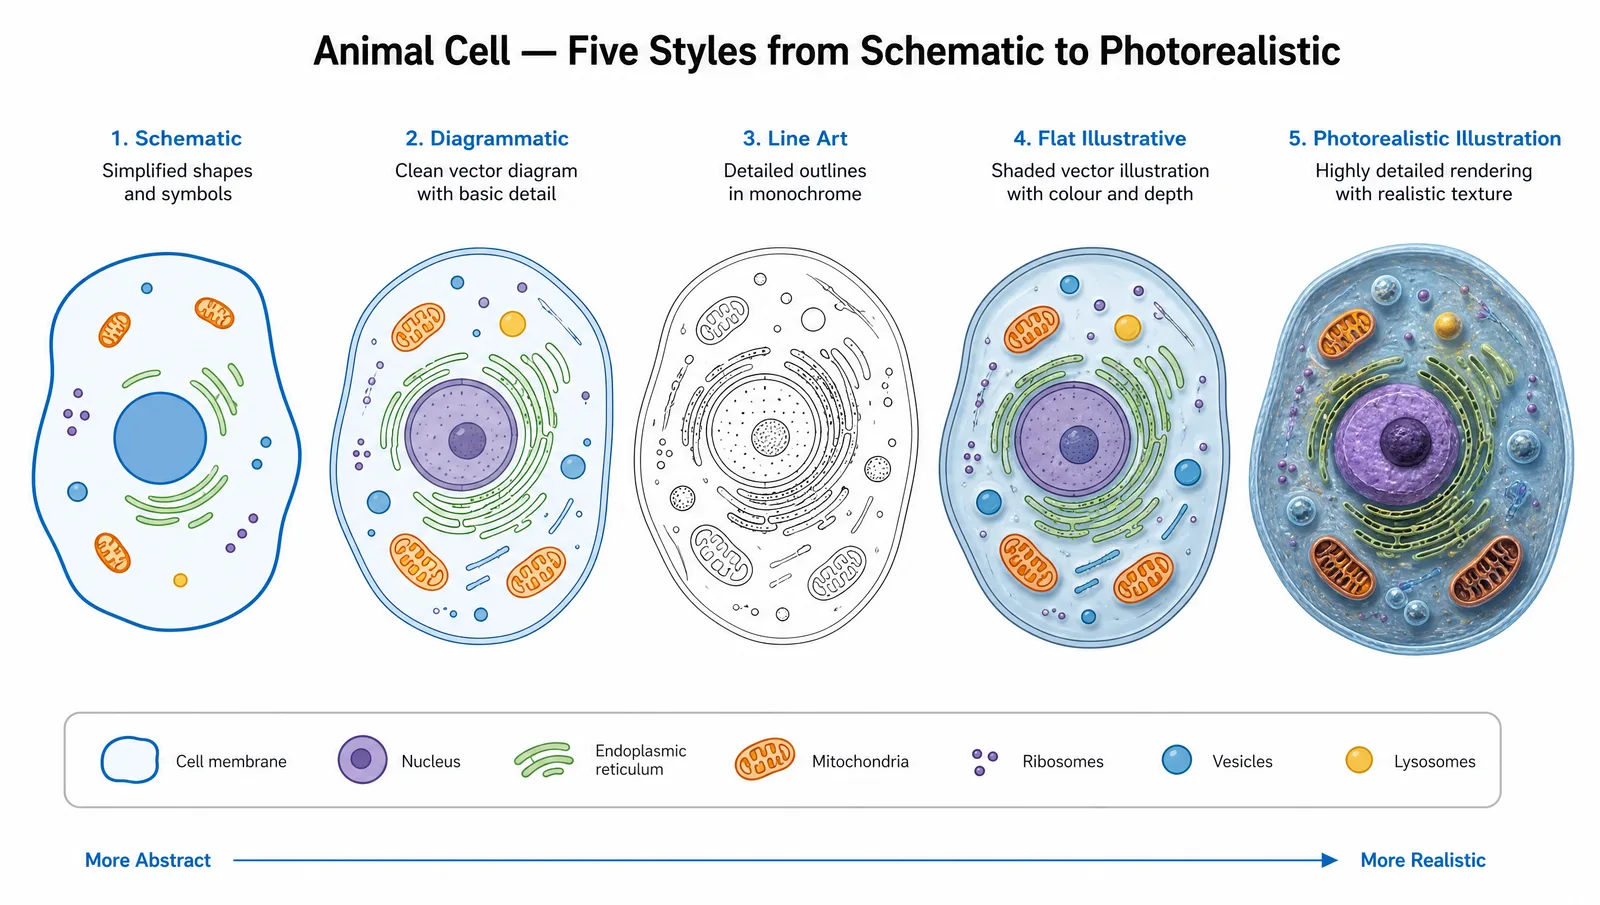
Scientific Illustration Styles Explained
The main scientific illustration styles from line art to 3D render, when each is appropriate, and how to pick one that matches your journal and discipline.
SciFig Team·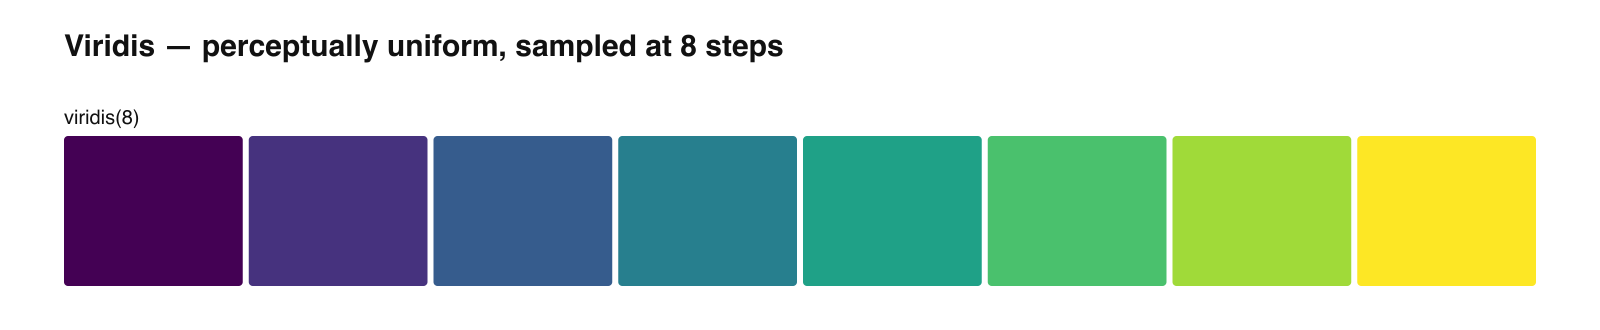
Viridis Color Palette: Hex Codes Reference
Viridis hex codes at 5, 8, and 10 steps, why it stays readable in grayscale and for colorblind readers, plus copy-ready R, Python, and CSS snippets.
SciFig Team·More on scientific figures
SciFig
Free AI Scientific Figure Generator for Illustrations, Images, Charts and Flowcharts
Pricing
View pricing
Tools
Three AI workspaces for figures, charts, and diagrams, plus free tools for every research figure.
Models
Default to GPT Image 2 for journal papers; switch to Nano Banana Pro for slides and posters; pick Nano Banana 2.1 for routine figure work
Tutorials
Seven short walkthroughs of the AI scientific figure generator
Inspiration
Explore publication-ready illustrations, charts and flowcharts. Copy a prompt or open any template as the starting point for your own figure.
The Best Color Palettes for Scientific Figures (2026)
Publication-grade and colorblind-safe color palettes for scientific figures, graphs, pie charts, combo charts, and diagrams, with HEX values.
18 Scientific Poster Examples to Learn From in 2026
18 scientific poster examples across biology, chemistry, medicine, and engineering — plus PhD examples, poster templates, and a poster-maker workflow.
How to Add Figures to a Research Paper
Step-by-step guide to including figures in research papers: placement, captions, DPI, vector formats, and journal-specific rules. Avoid common rejection causes.

Ready to start?
Publication-ready scientific figures, in minutes
Start Creating FreeFree to start · No credit card required · Built for researchers