IMRaD stands for Introduction, Methods, Results, and Discussion.
It is the dominant structure for empirical papers in the sciences because it matches the shape of the argument: why the question matters, how you answered it, what you found, and what it means. Once you see it as an argument rather than a template, the boundaries between sections stop being arbitrary.
What Belongs in Each Section
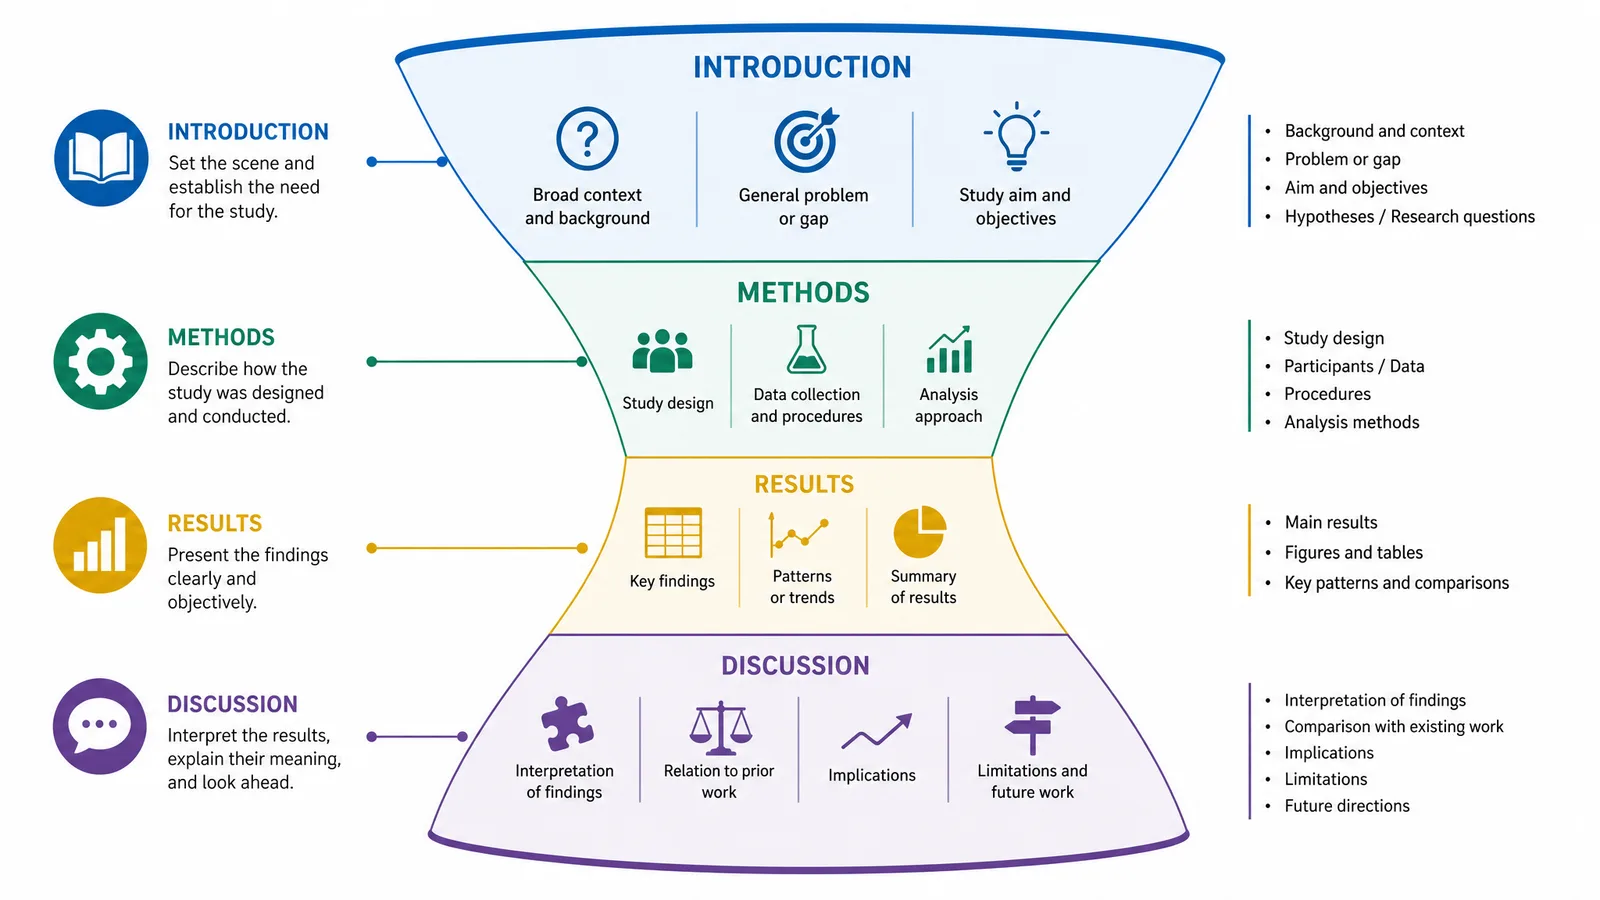
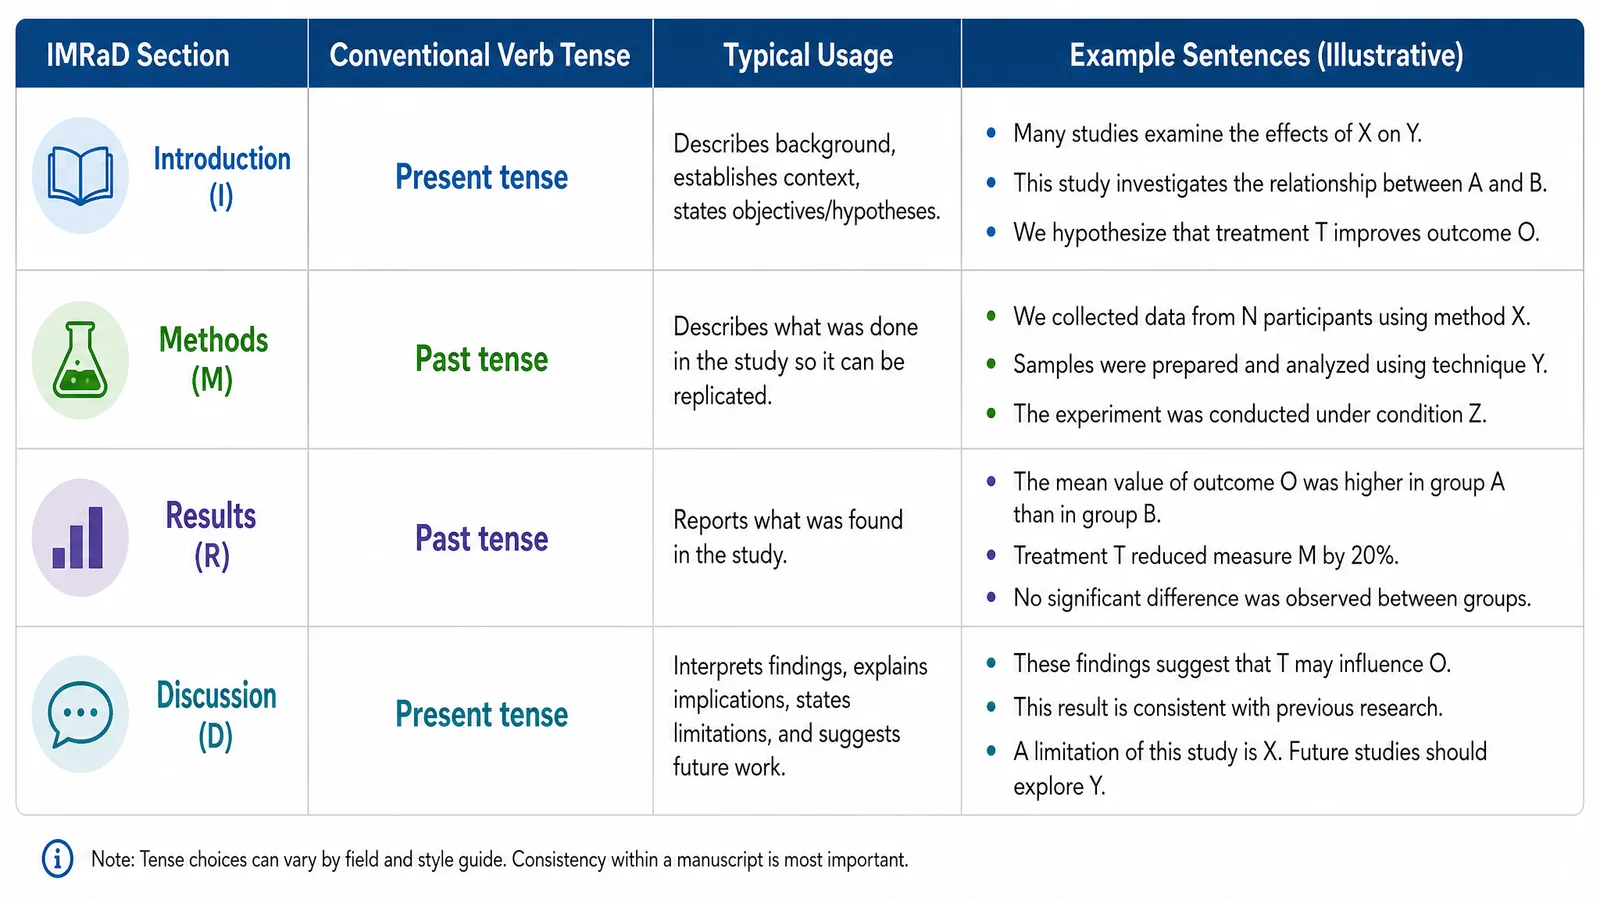
| Section | Question it answers | Tense | Common failure |
|---|---|---|---|
| Introduction | Why does this matter, and what is unknown? | Present / present perfect | Reviewing everything instead of building to one gap |
| Methods | What exactly did you do? | Past | Too little detail to reproduce |
| Results | What did you find? | Past | Interpreting instead of reporting |
| Discussion | What does it mean, and what are the limits? | Present | Restating results without interpreting |
The structure is often drawn as an hourglass. The introduction starts broad and narrows to your specific question. Methods and results are the narrow waist — maximally specific. The discussion widens again, back out to implications for the field.
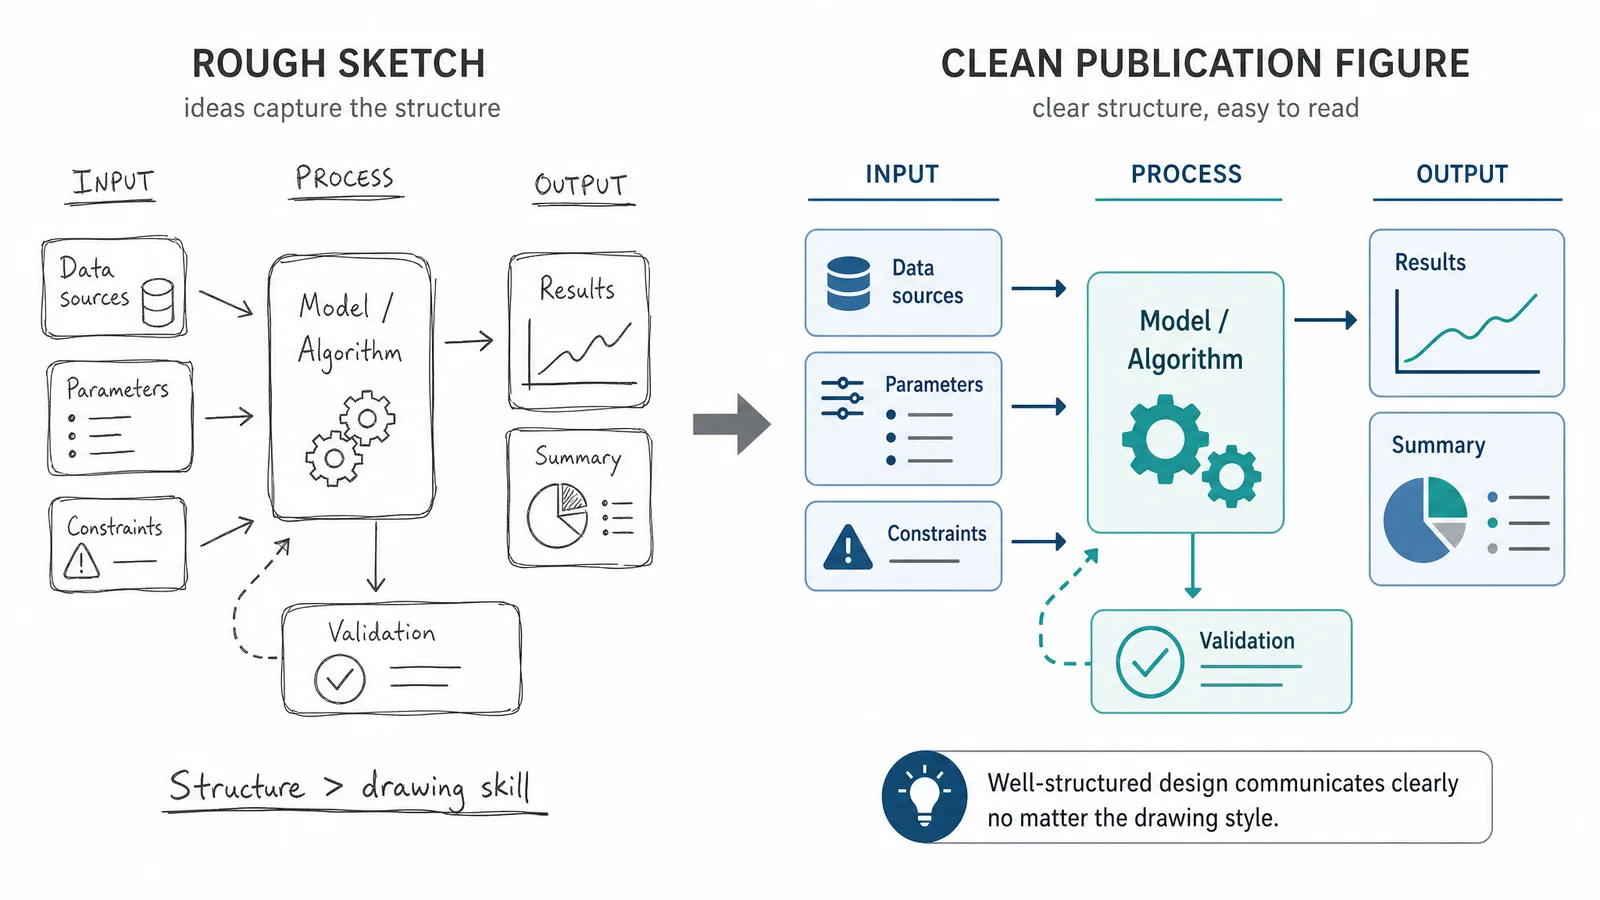
See AI Scientific Figure Generation in Action
Watch how researchers create publication-ready scientific figures from text descriptions.
Explore the Tool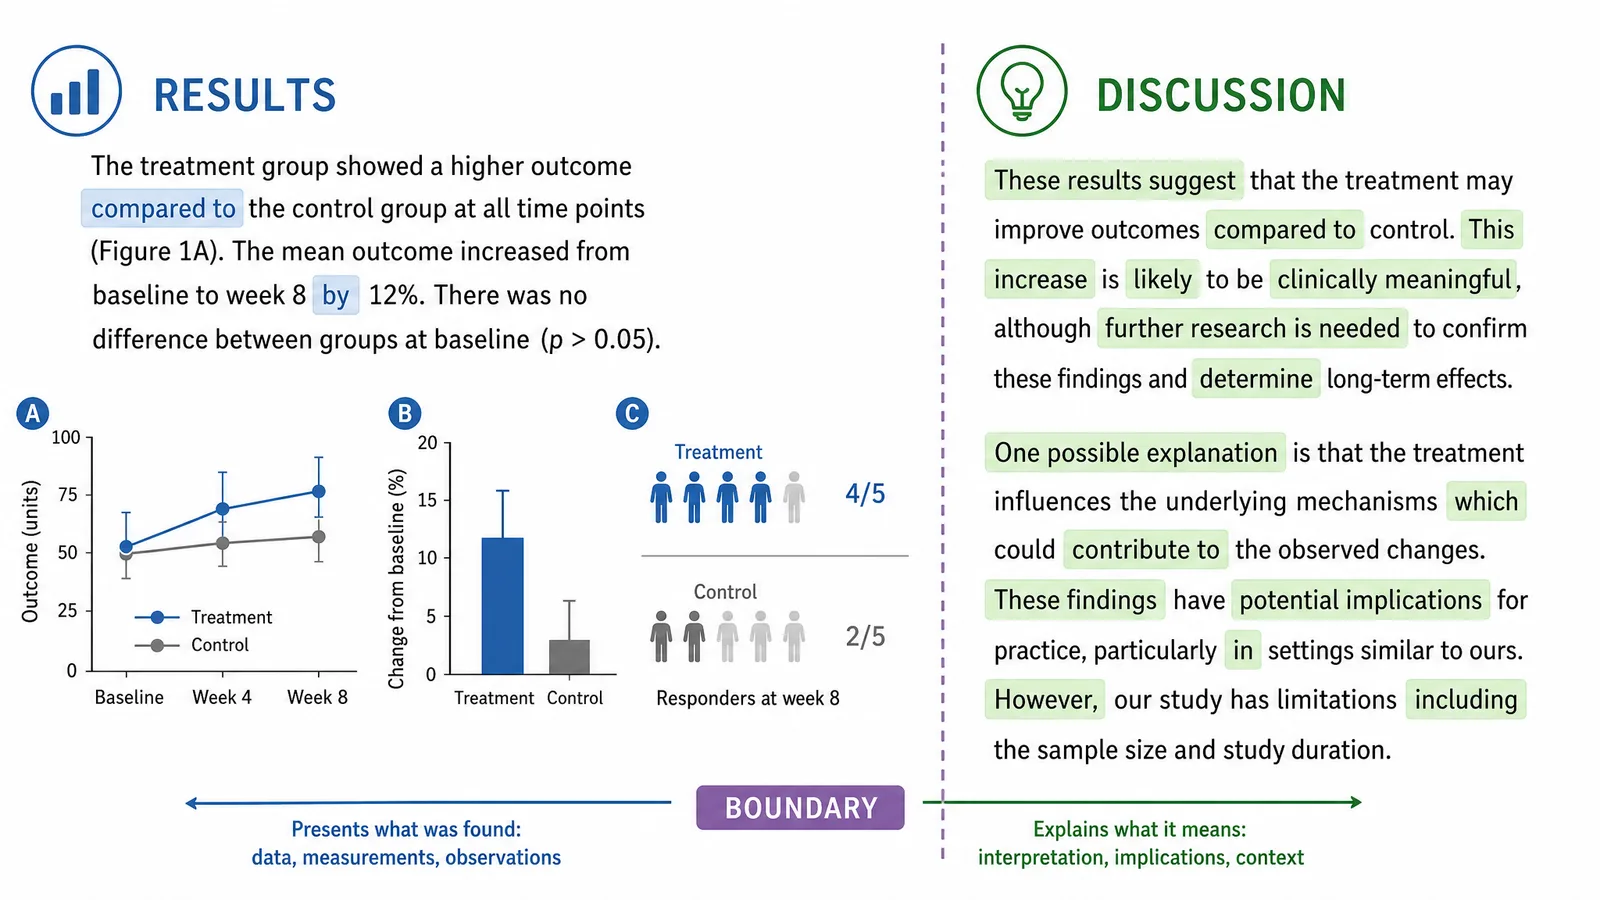
The Boundary That Causes Most Trouble
The results and discussion boundary is where most drafts blur. A working rule:
- Results report what the data show. "Treatment reduced tumour volume by 42% relative to control (p = 0.003)."
- Discussion explains what that means. "The reduction is consistent with the proposed mechanism, though the effect size is smaller than reported in xenograft models, possibly because…"
If a sentence in your results contains because, suggests, likely, or consistent with, it probably belongs in the discussion. Some journals permit a combined Results and Discussion section, which removes the problem but requires more discipline, not less.
Where Figures Fit
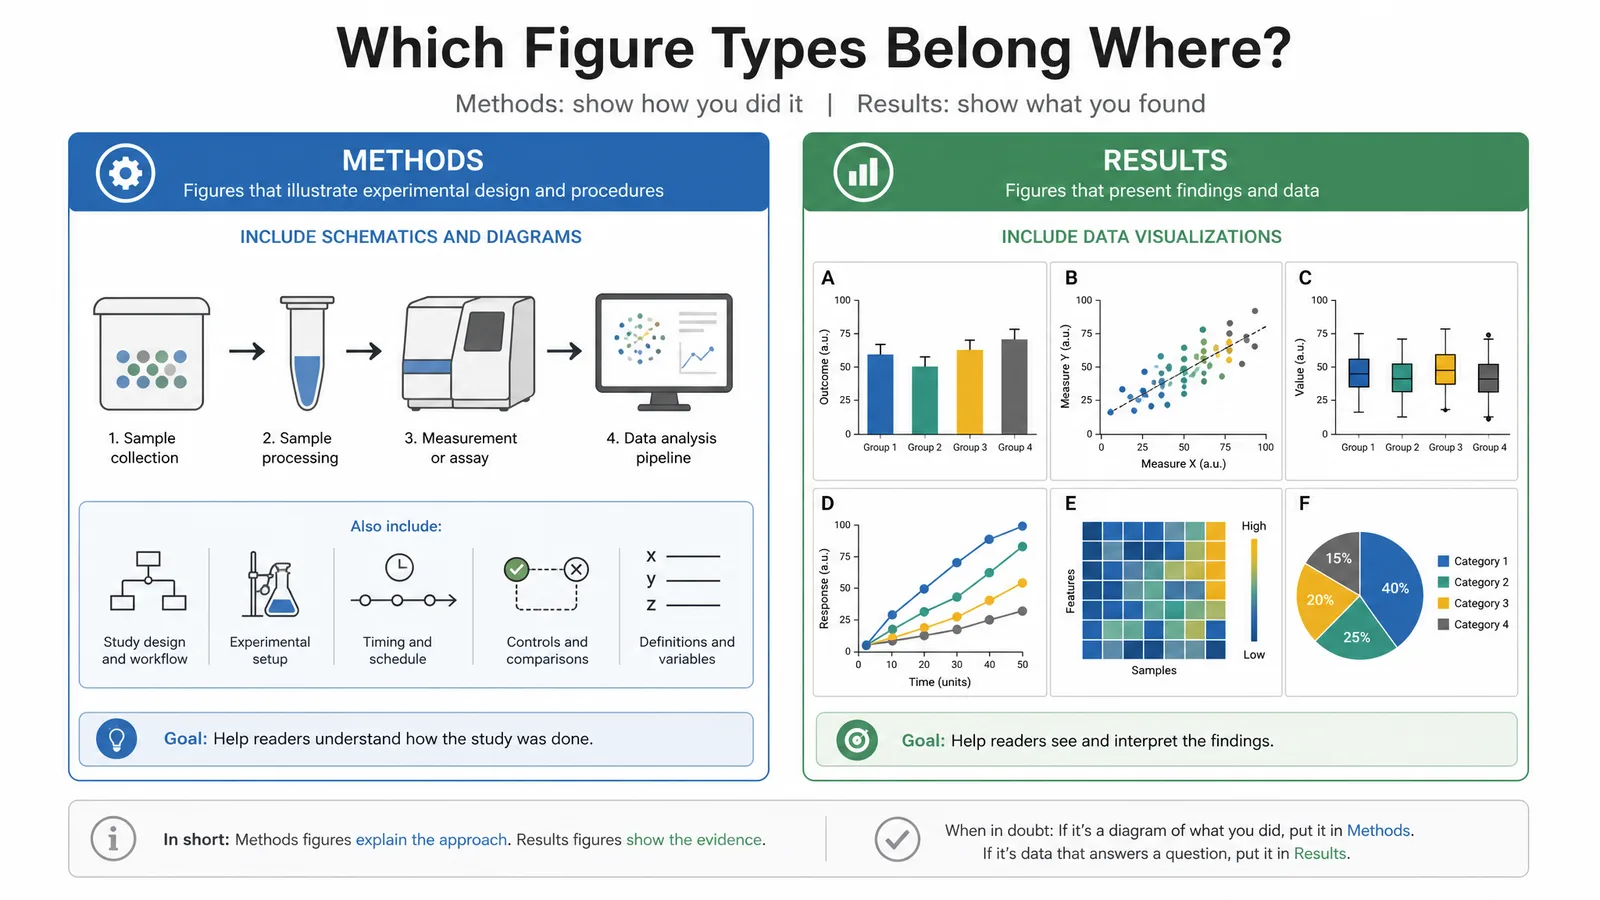
Figures are not decoration distributed evenly through the paper. Each section uses them differently:
- Introduction — rarely. Occasionally a conceptual diagram establishing the model being tested.
- Methods — workflow diagrams, experimental schematics, study flow such as CONSORT or PRISMA.
- Results — the bulk. Data figures carrying the findings.
- Discussion — rarely. Sometimes a summary model integrating the findings.
A useful check: every results scientific figure should map to a specific claim, and every substantive claim should be supported by a figure, a table, or a statistic in the text. Figures that support no claim should be cut or moved to supplementary material.
Where IMRaD Does Not Apply
IMRaD assumes original empirical work. It fits poorly for:
- Review articles, which are organized thematically
- Theoretical or methods papers, which often replace results with derivation or validation
- Case reports, which use a presentation-investigation-outcome structure
- Humanities and much of mathematics, which follow entirely different conventions
Some fields also invert the order, placing methods after the discussion. Follow the target journal.
Tip
Write the methods first. It is the most concrete section, it is written from records rather than from argument, and having it on the page makes the results easier to organise. The introduction is usually written last, because only then do you know which gap the paper actually addresses.
Create Scientific Figures Now
Describe your scientific figure in natural language — get publication-ready illustrations in minutes.
Try FreeRelated Reading
Related reading: How to Add Figures to a Research Paper, Definition of Terms in Research: How to Write It.