Pneumonic Plague vs Bubonic Plague: Chart & Diagrams
Compare pneumonic, bubonic and septicemic plague with a clear chart and transmission diagrams. Download free PNGs and editable SVGs for lessons and slides.
Both are caused by Yersinia pestis, the same bacterium. Septicemic plague involves the bloodstream. These names describe clinical forms, rather than three different pathogens.
For a biology lesson, a slide or a science explainer, the useful comparison is where infection develops and how it can spread. This guide pairs a readable comparison chart with three original diagrams. Download the figures below, or adapt the SVG labels and layout in Vector Canvas.
Warning
This page is an educational visual reference, not a diagnostic tool. Plague is a serious illness: CDC advises immediate medical attention for suspected symptoms. Follow local public-health advice for an actual exposure.
Pneumonic plague vs bubonic plague: the comparison chart
The main difference is the affected site: lungs in pneumonic plague, lymph nodes in bubonic plague.
The CDC signs and symptoms guide describes three common clinical forms. The table separates their characteristic features without treating a symptom as proof of a diagnosis. Laboratory testing is needed to confirm plague, as explained in the WHO fact sheet.
Feature
Bubonic plague
Pneumonic plague
Septicemic plague
Main site
Lymph nodes
Lungs
Bloodstream
Shared cause
Yersinia pestis
Yersinia pestis
Yersinia pestis
Typical route or development
Often an infected flea bite
Inhaled infectious respiratory particles, or spread to lungs from another form
Can begin as bloodstream infection or develop from another form
Characteristic finding
Painful, swollen lymph nodes called buboes
Rapidly developing pneumonia, cough and breathing difficulty
Severe systemic illness; shock and bleeding can occur
Person-to-person respiratory spread
Not the characteristic route of this form
Can occur with pneumonic infection
Not the characteristic route of this form
Possible progression
Can spread to bloodstream or lungs
May arise after infection elsewhere reaches lungs
Can progress to lung involvement
Teaching emphasis
A lymph-node presentation
A lung presentation and respiratory transmission
A bloodstream presentation
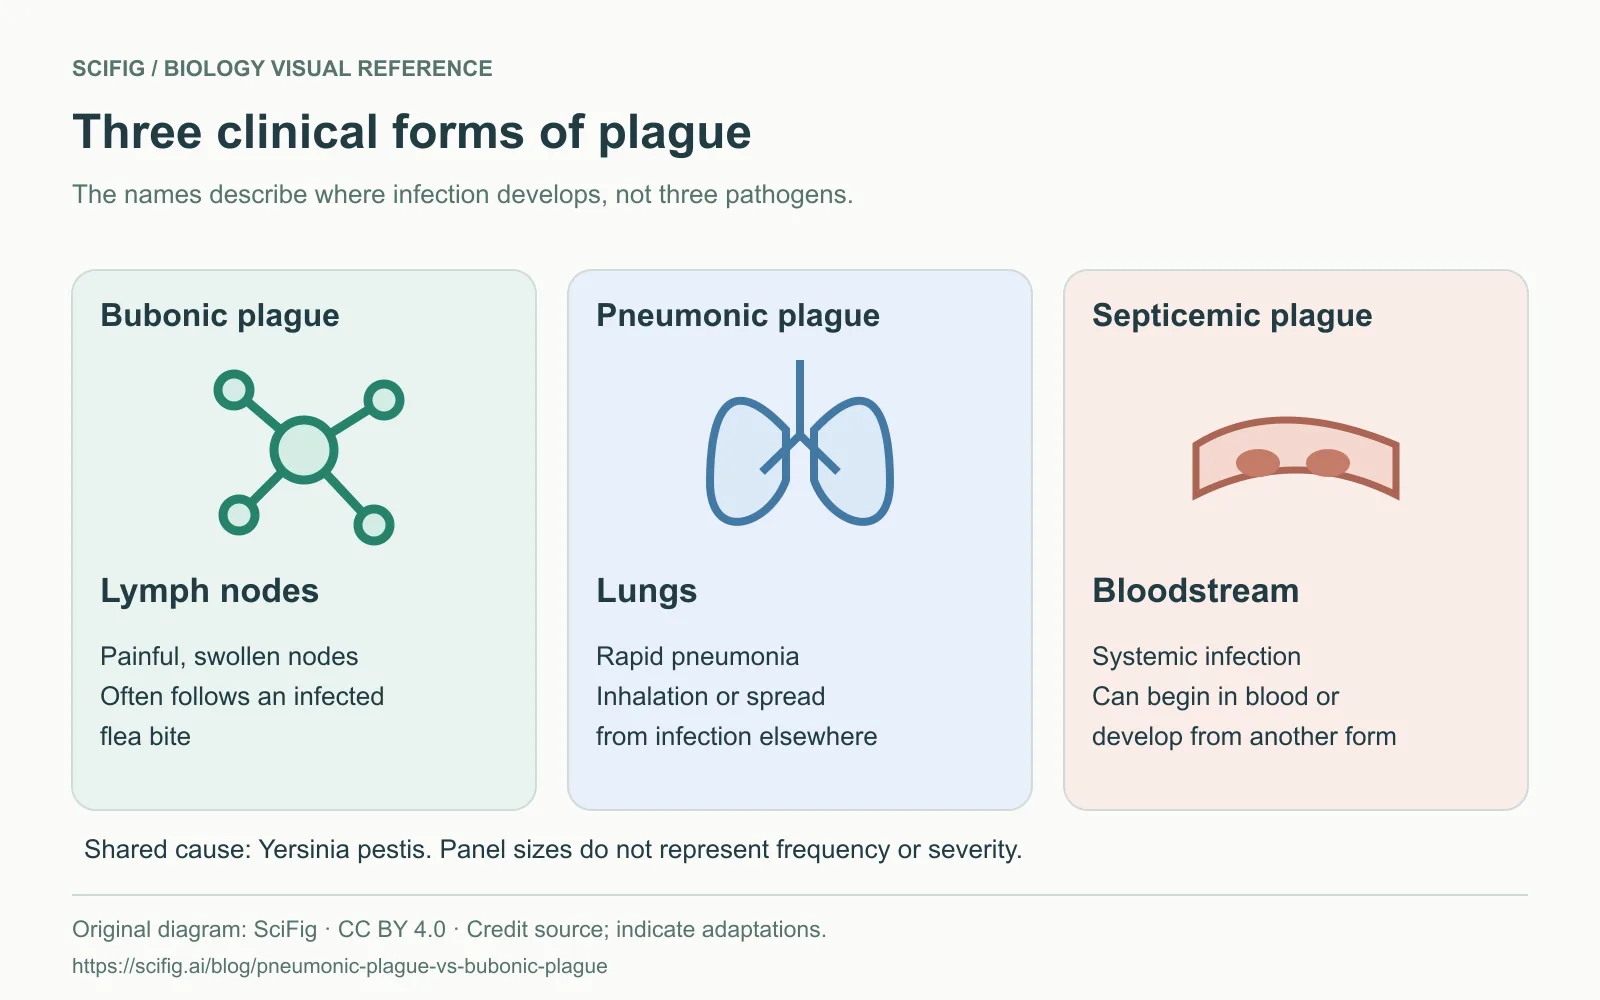
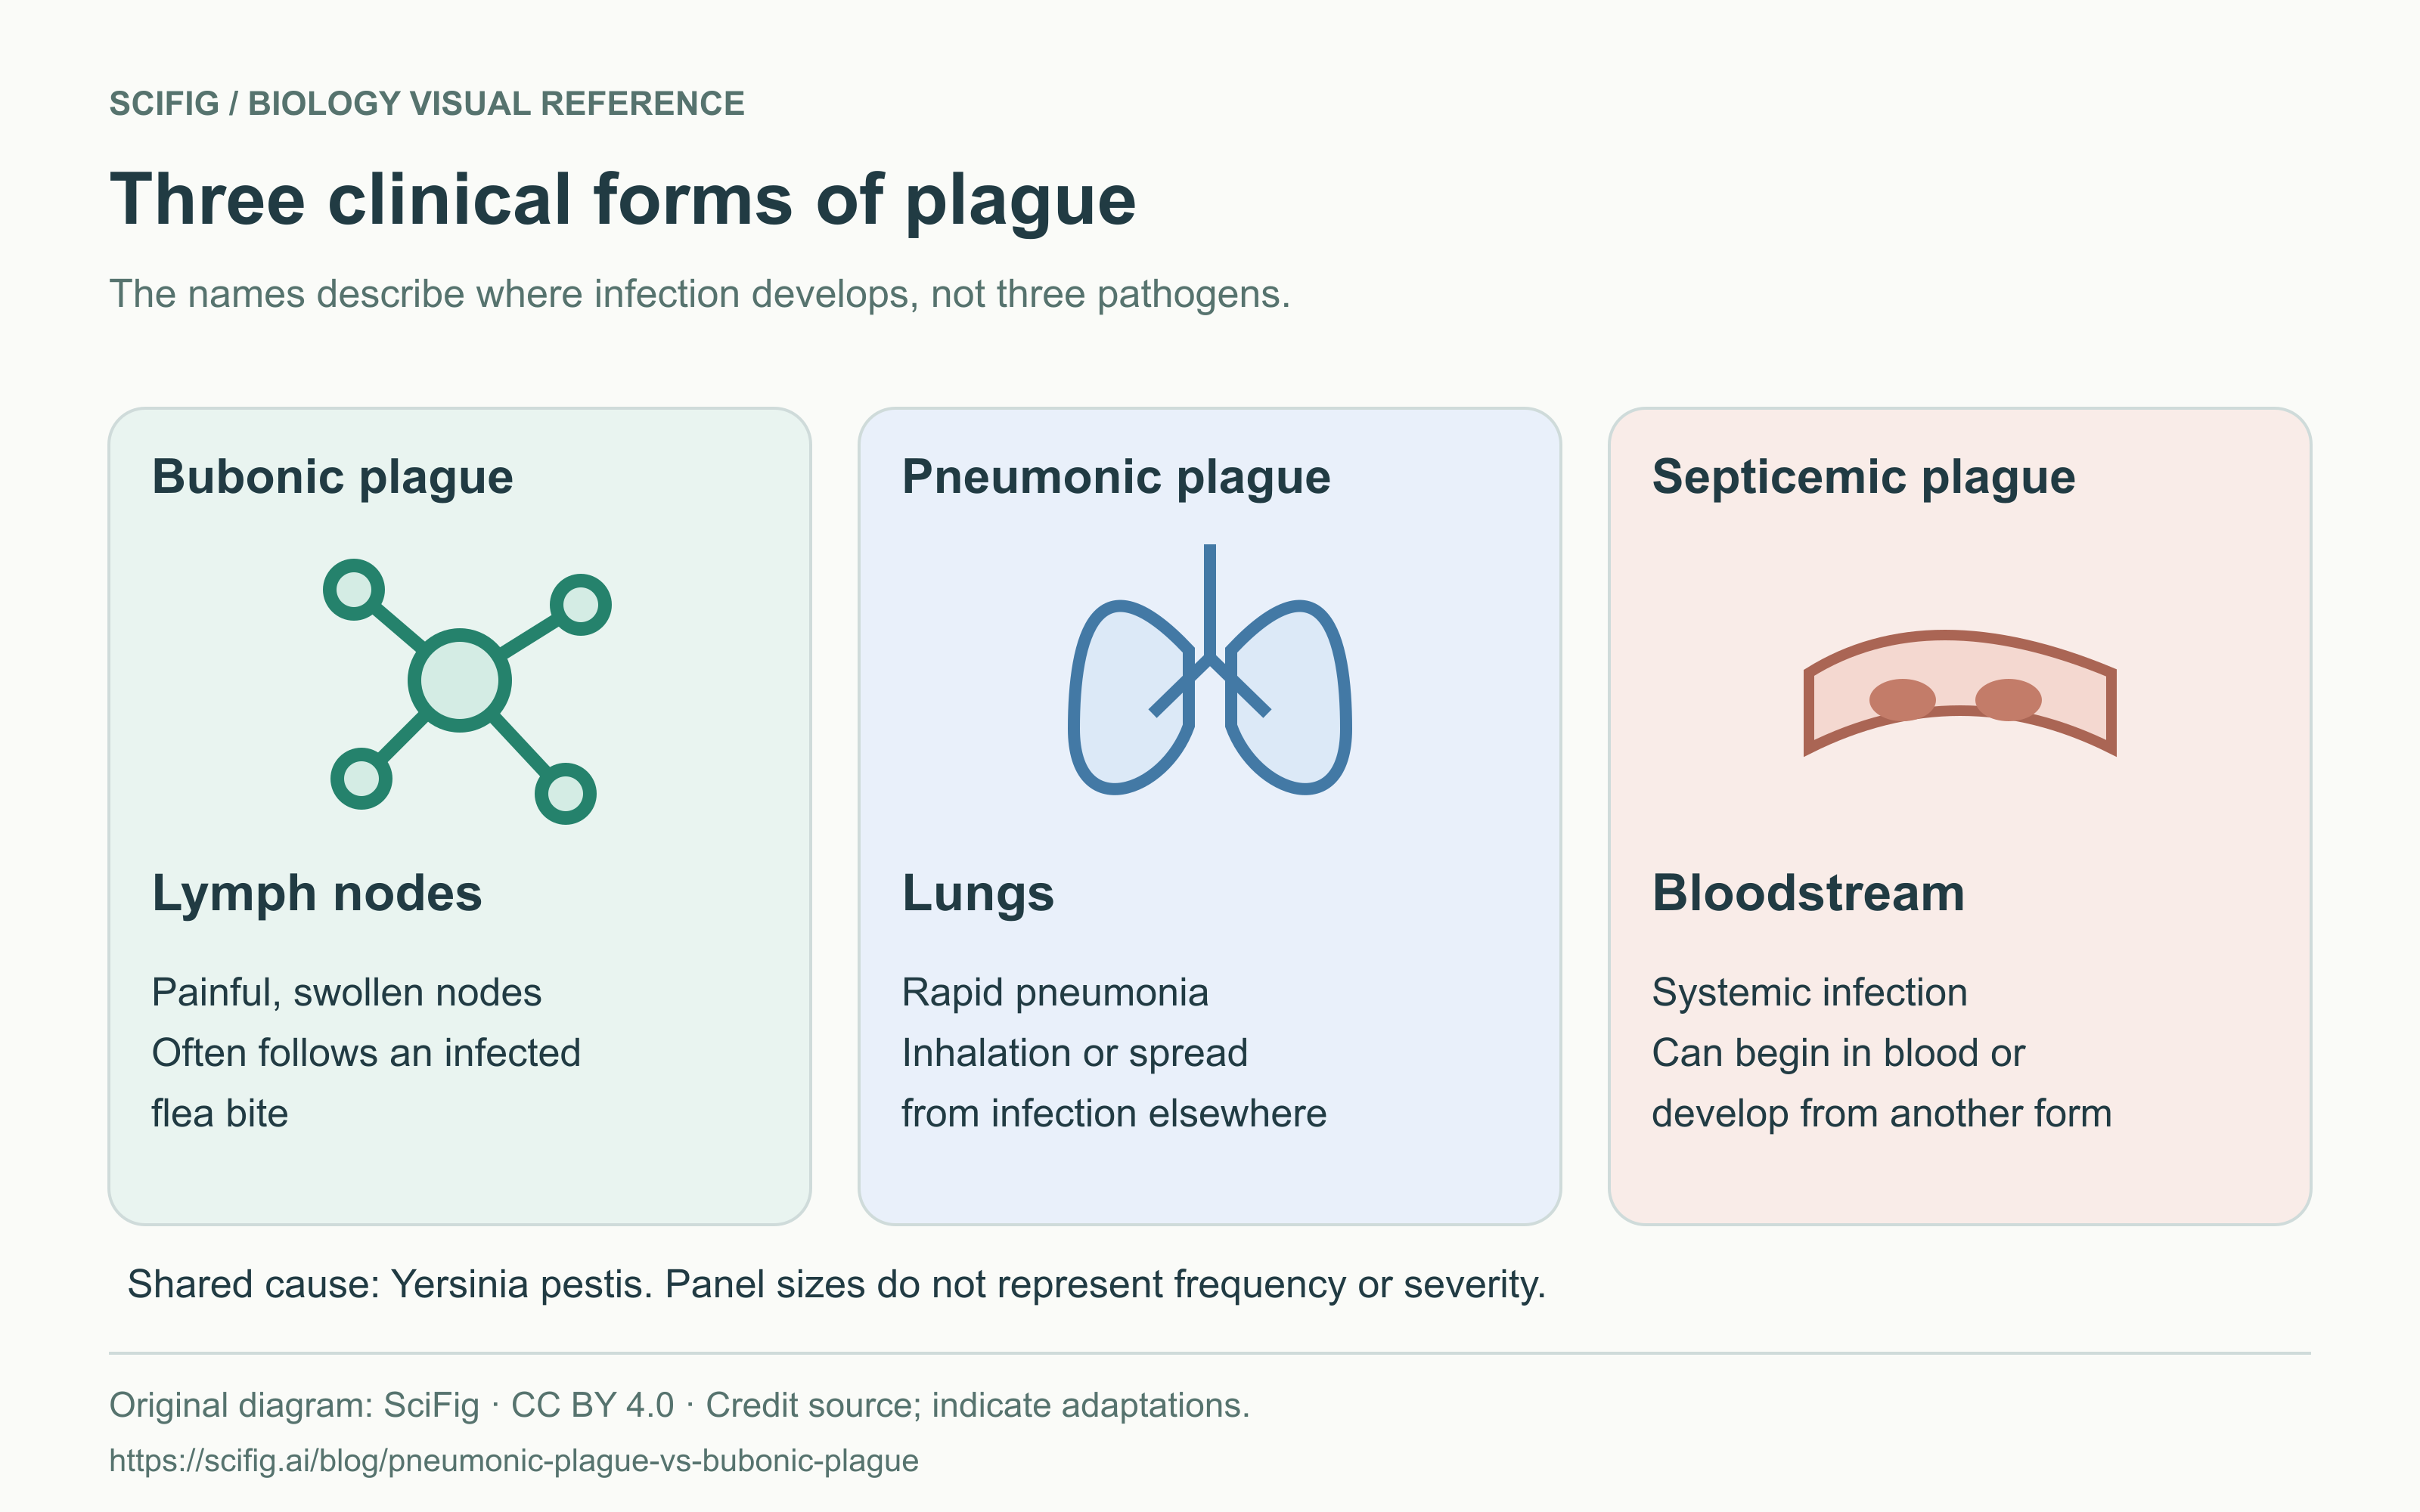
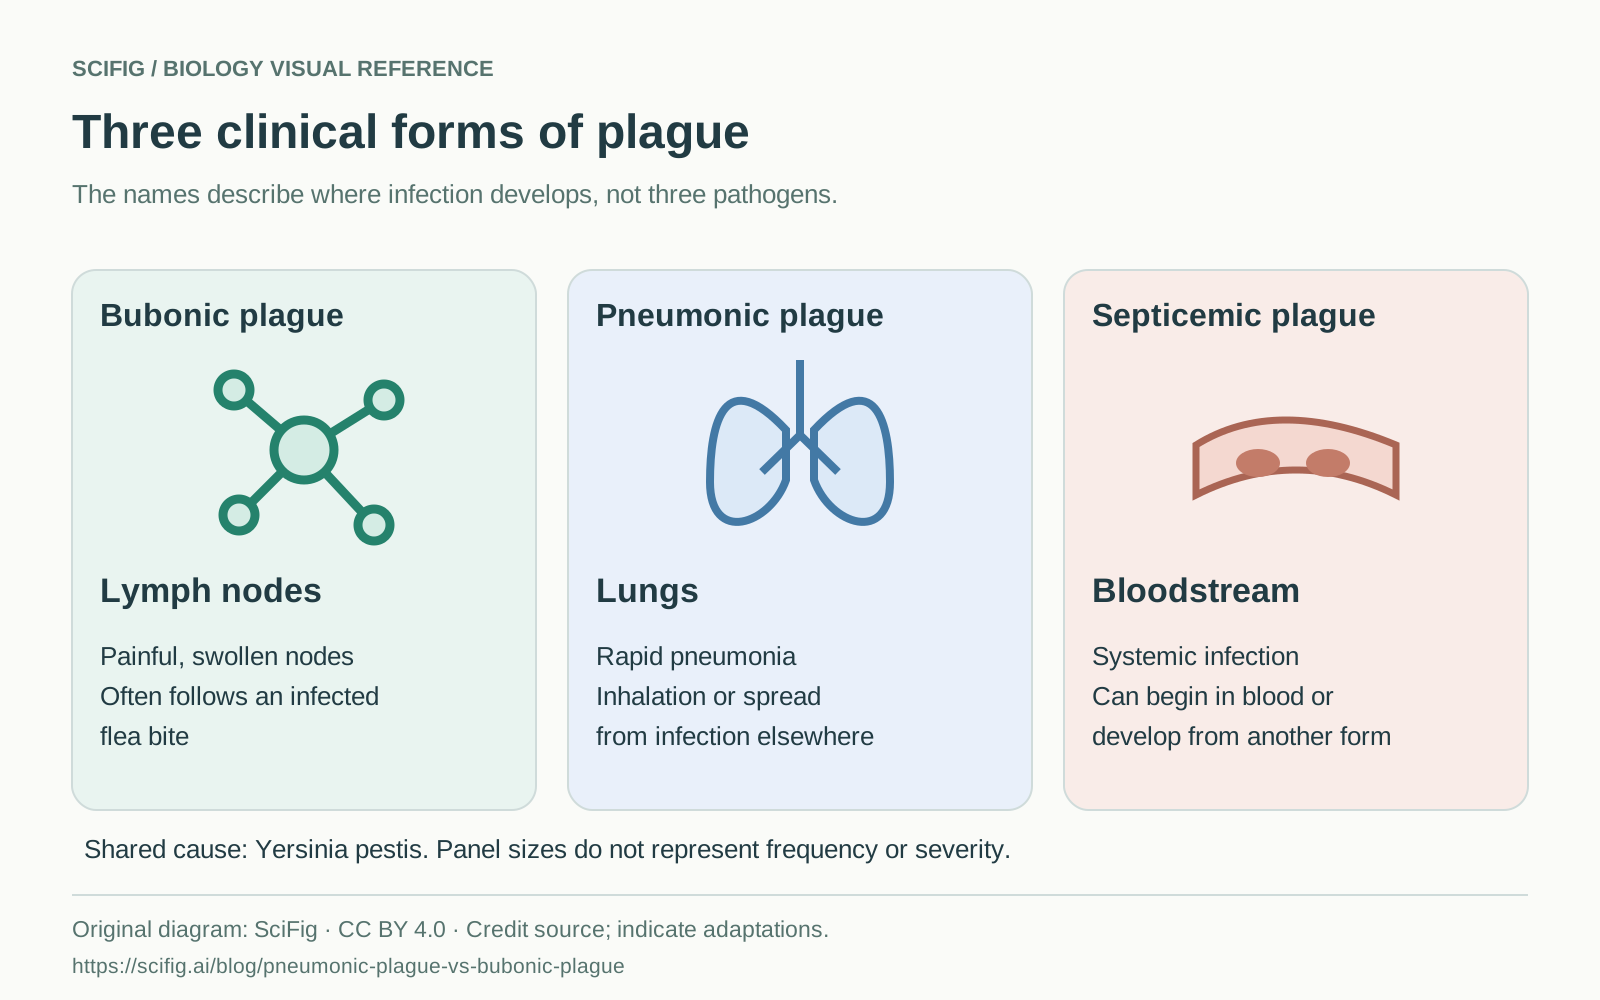
Three types of plague compared by their main affected site: lymph nodes, lungs and bloodstream. Original SciFig diagram with English labels.
The diagram uses color as a secondary cue; the written labels carry the distinction. This helps when a slide is printed in grayscale or viewed on a small screen. The organ symbols are schematic, not anatomical scans, and the panel sizes do not represent frequency or severity.
How plague spreads: separate exposure from disease form
Plague can reach people through infected fleas, infected animal tissues or infectious respiratory particles.
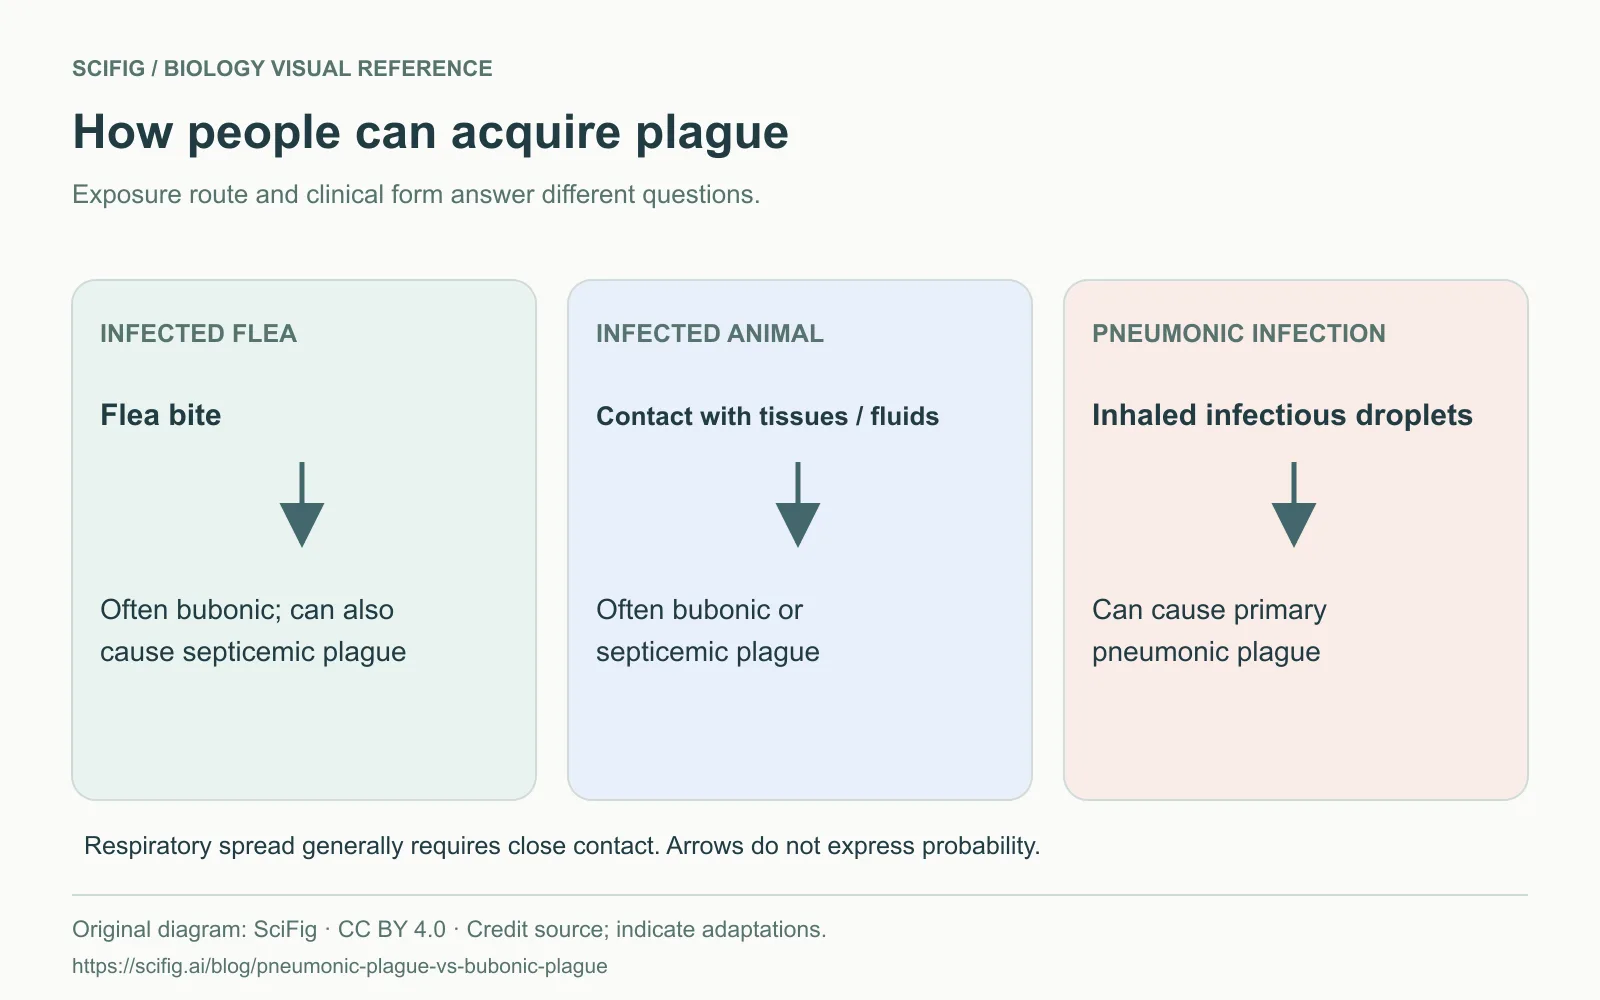
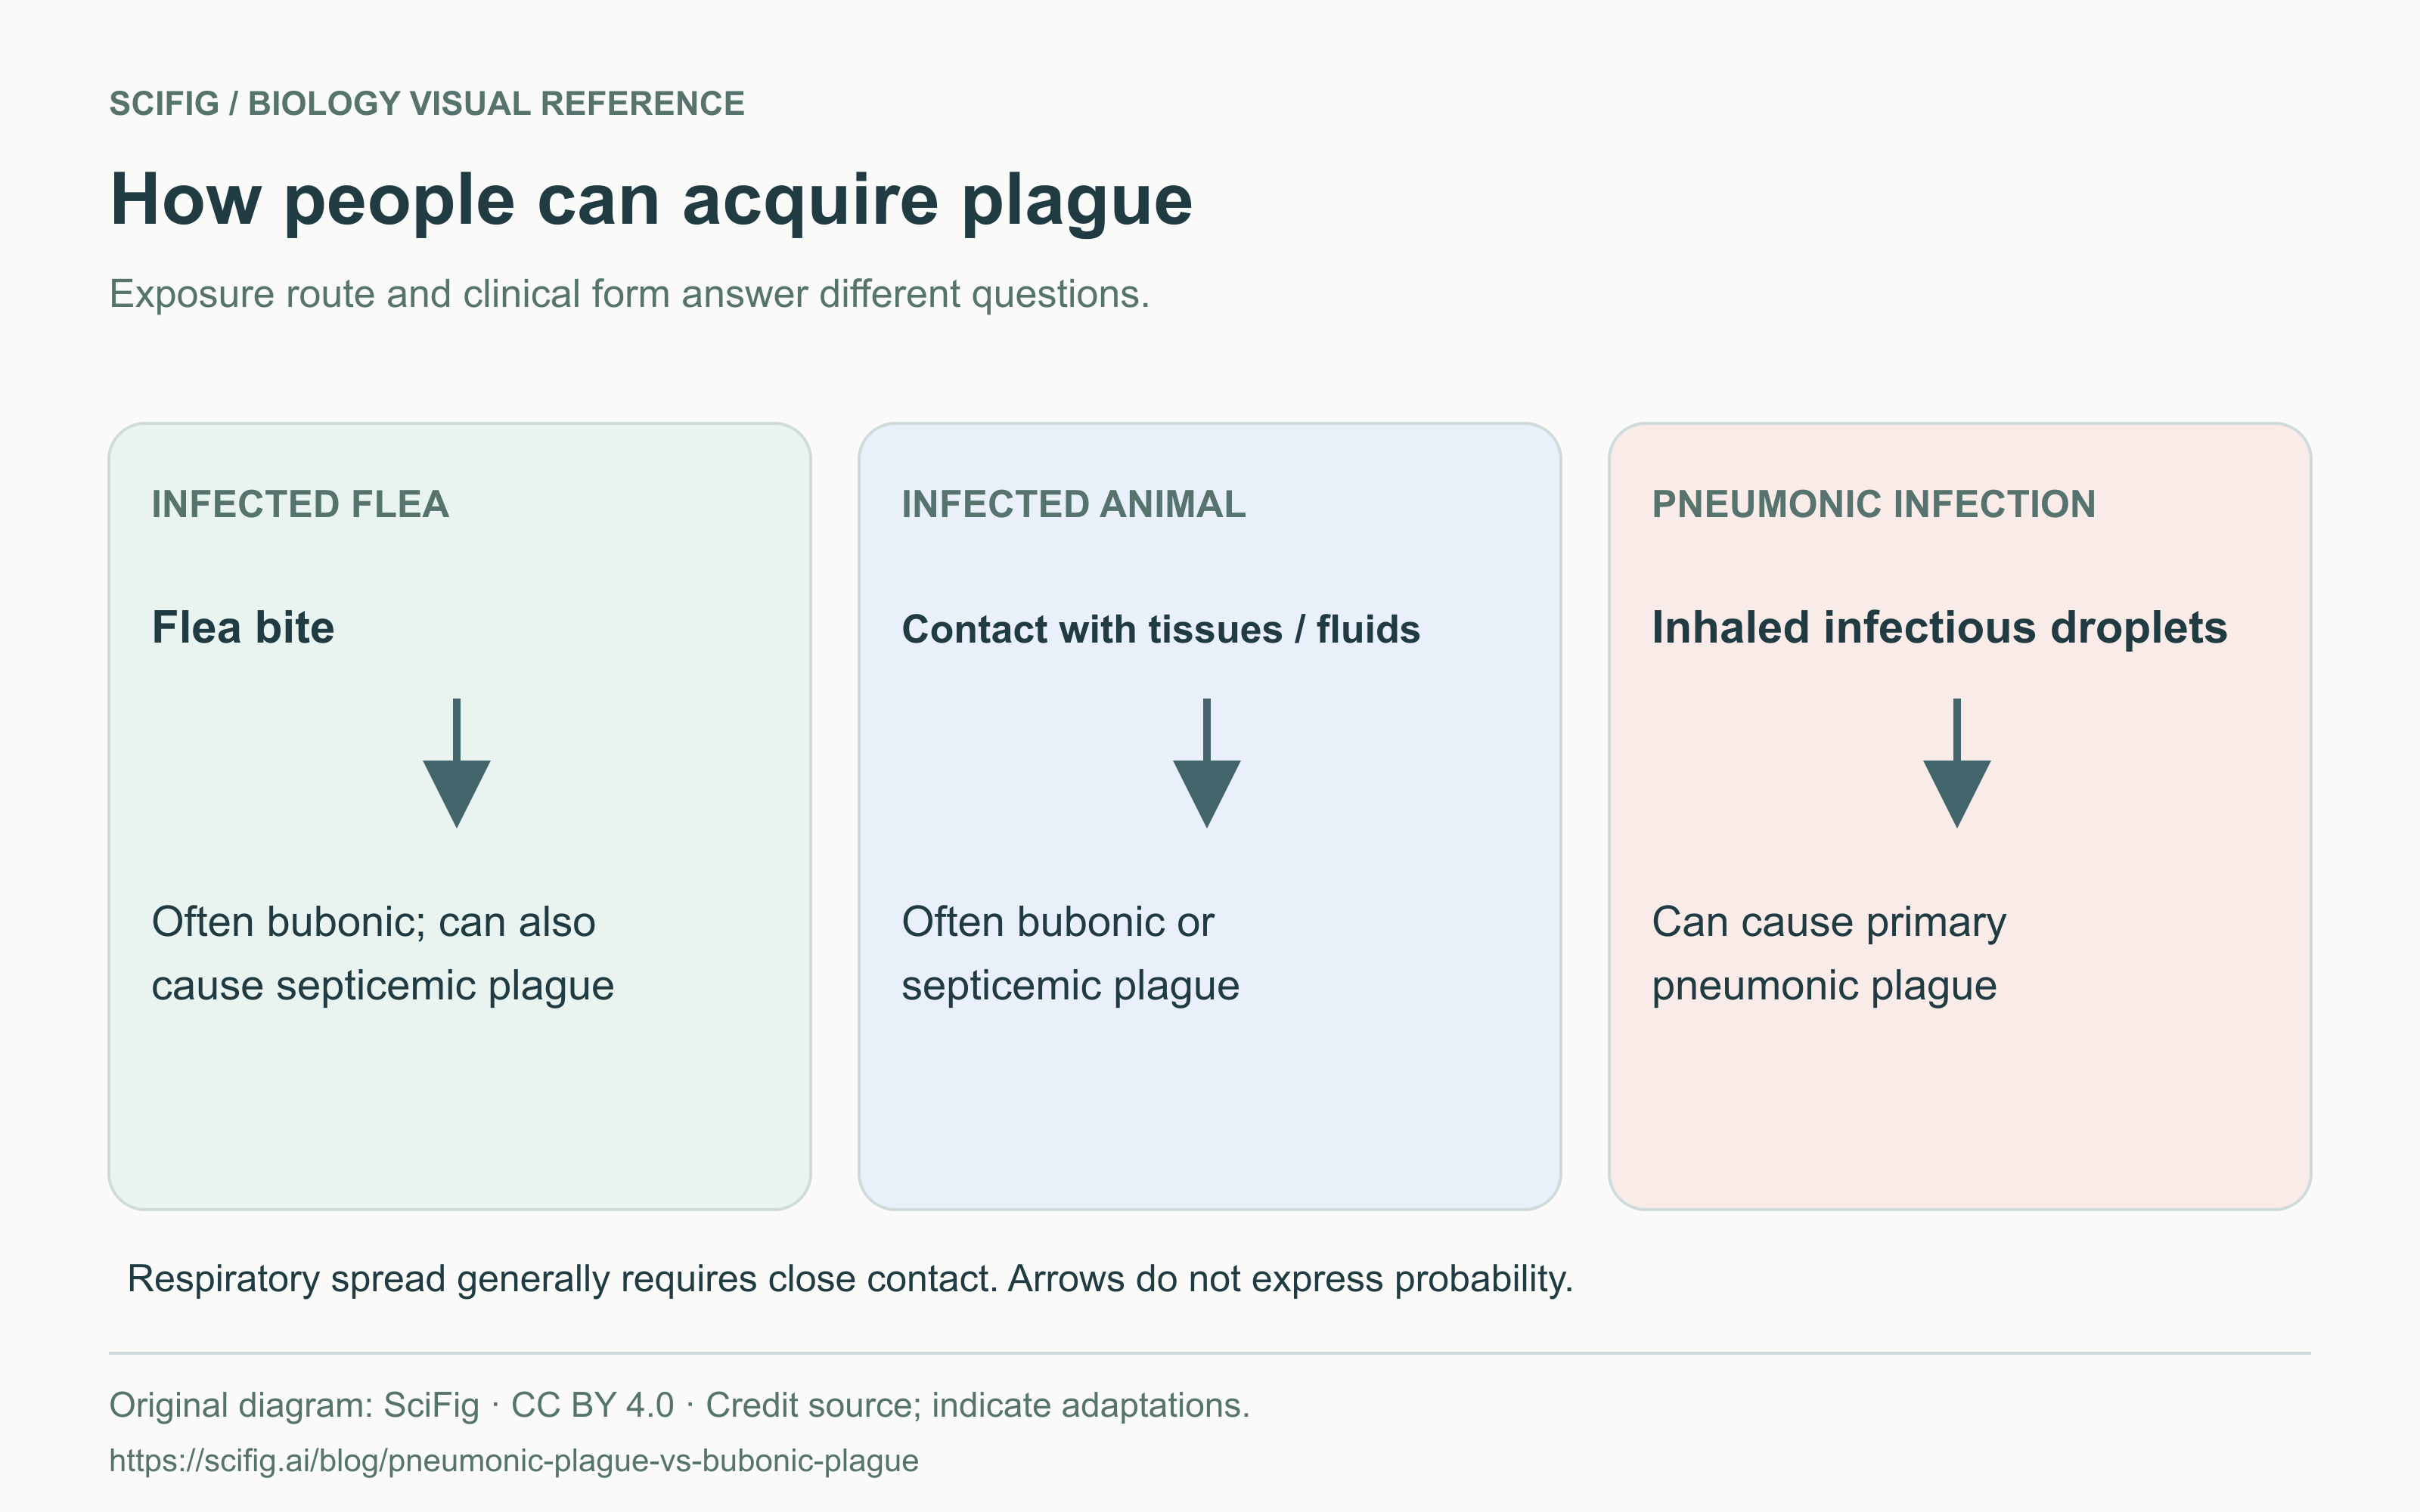
In the CDC transmission guide, flea bites and contact with infected animal fluids or tissues are distinct from respiratory exposure. Pneumonic infection in a person or animal can produce infectious droplets; inhaling them can cause pneumonic plague. CDC describes this as generally requiring direct, close contact.
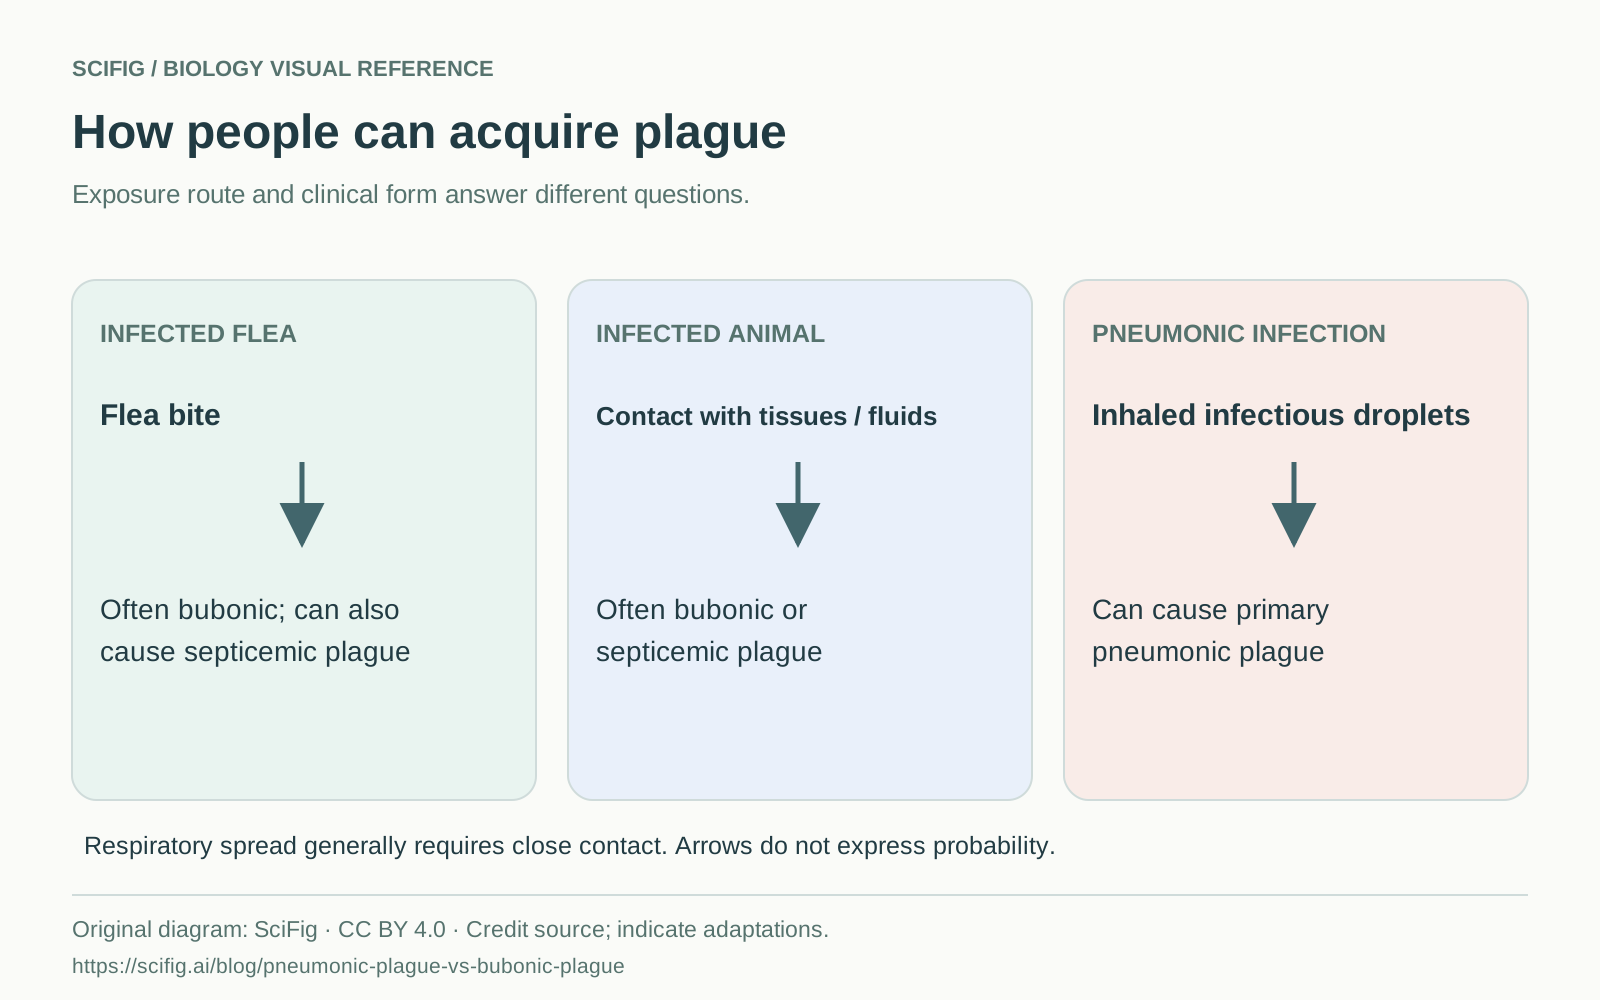
Plague exposure through infected fleas, infected animal tissues and infectious droplets during close contact. Original SciFig diagram; English labels.
A plague transmission diagram should name the exposure on each arrow. An unlabeled arrow from a rodent to a person can suggest that merely seeing a rodent transmits infection. Likewise, an arrow between two people without a lung label can make every clinical form look equally transmissible by breathing.
For a teaching slide, keep the flea route and the respiratory route visually separate. The UK Health Security Agency overview also describes respiratory transmission and exposure to infected cats. The three routes here are a simplified explanation, not a complete ecological network or an outbreak reconstruction. None of the arrows shows a numerical probability.
Can bubonic plague turn into pneumonic plague?
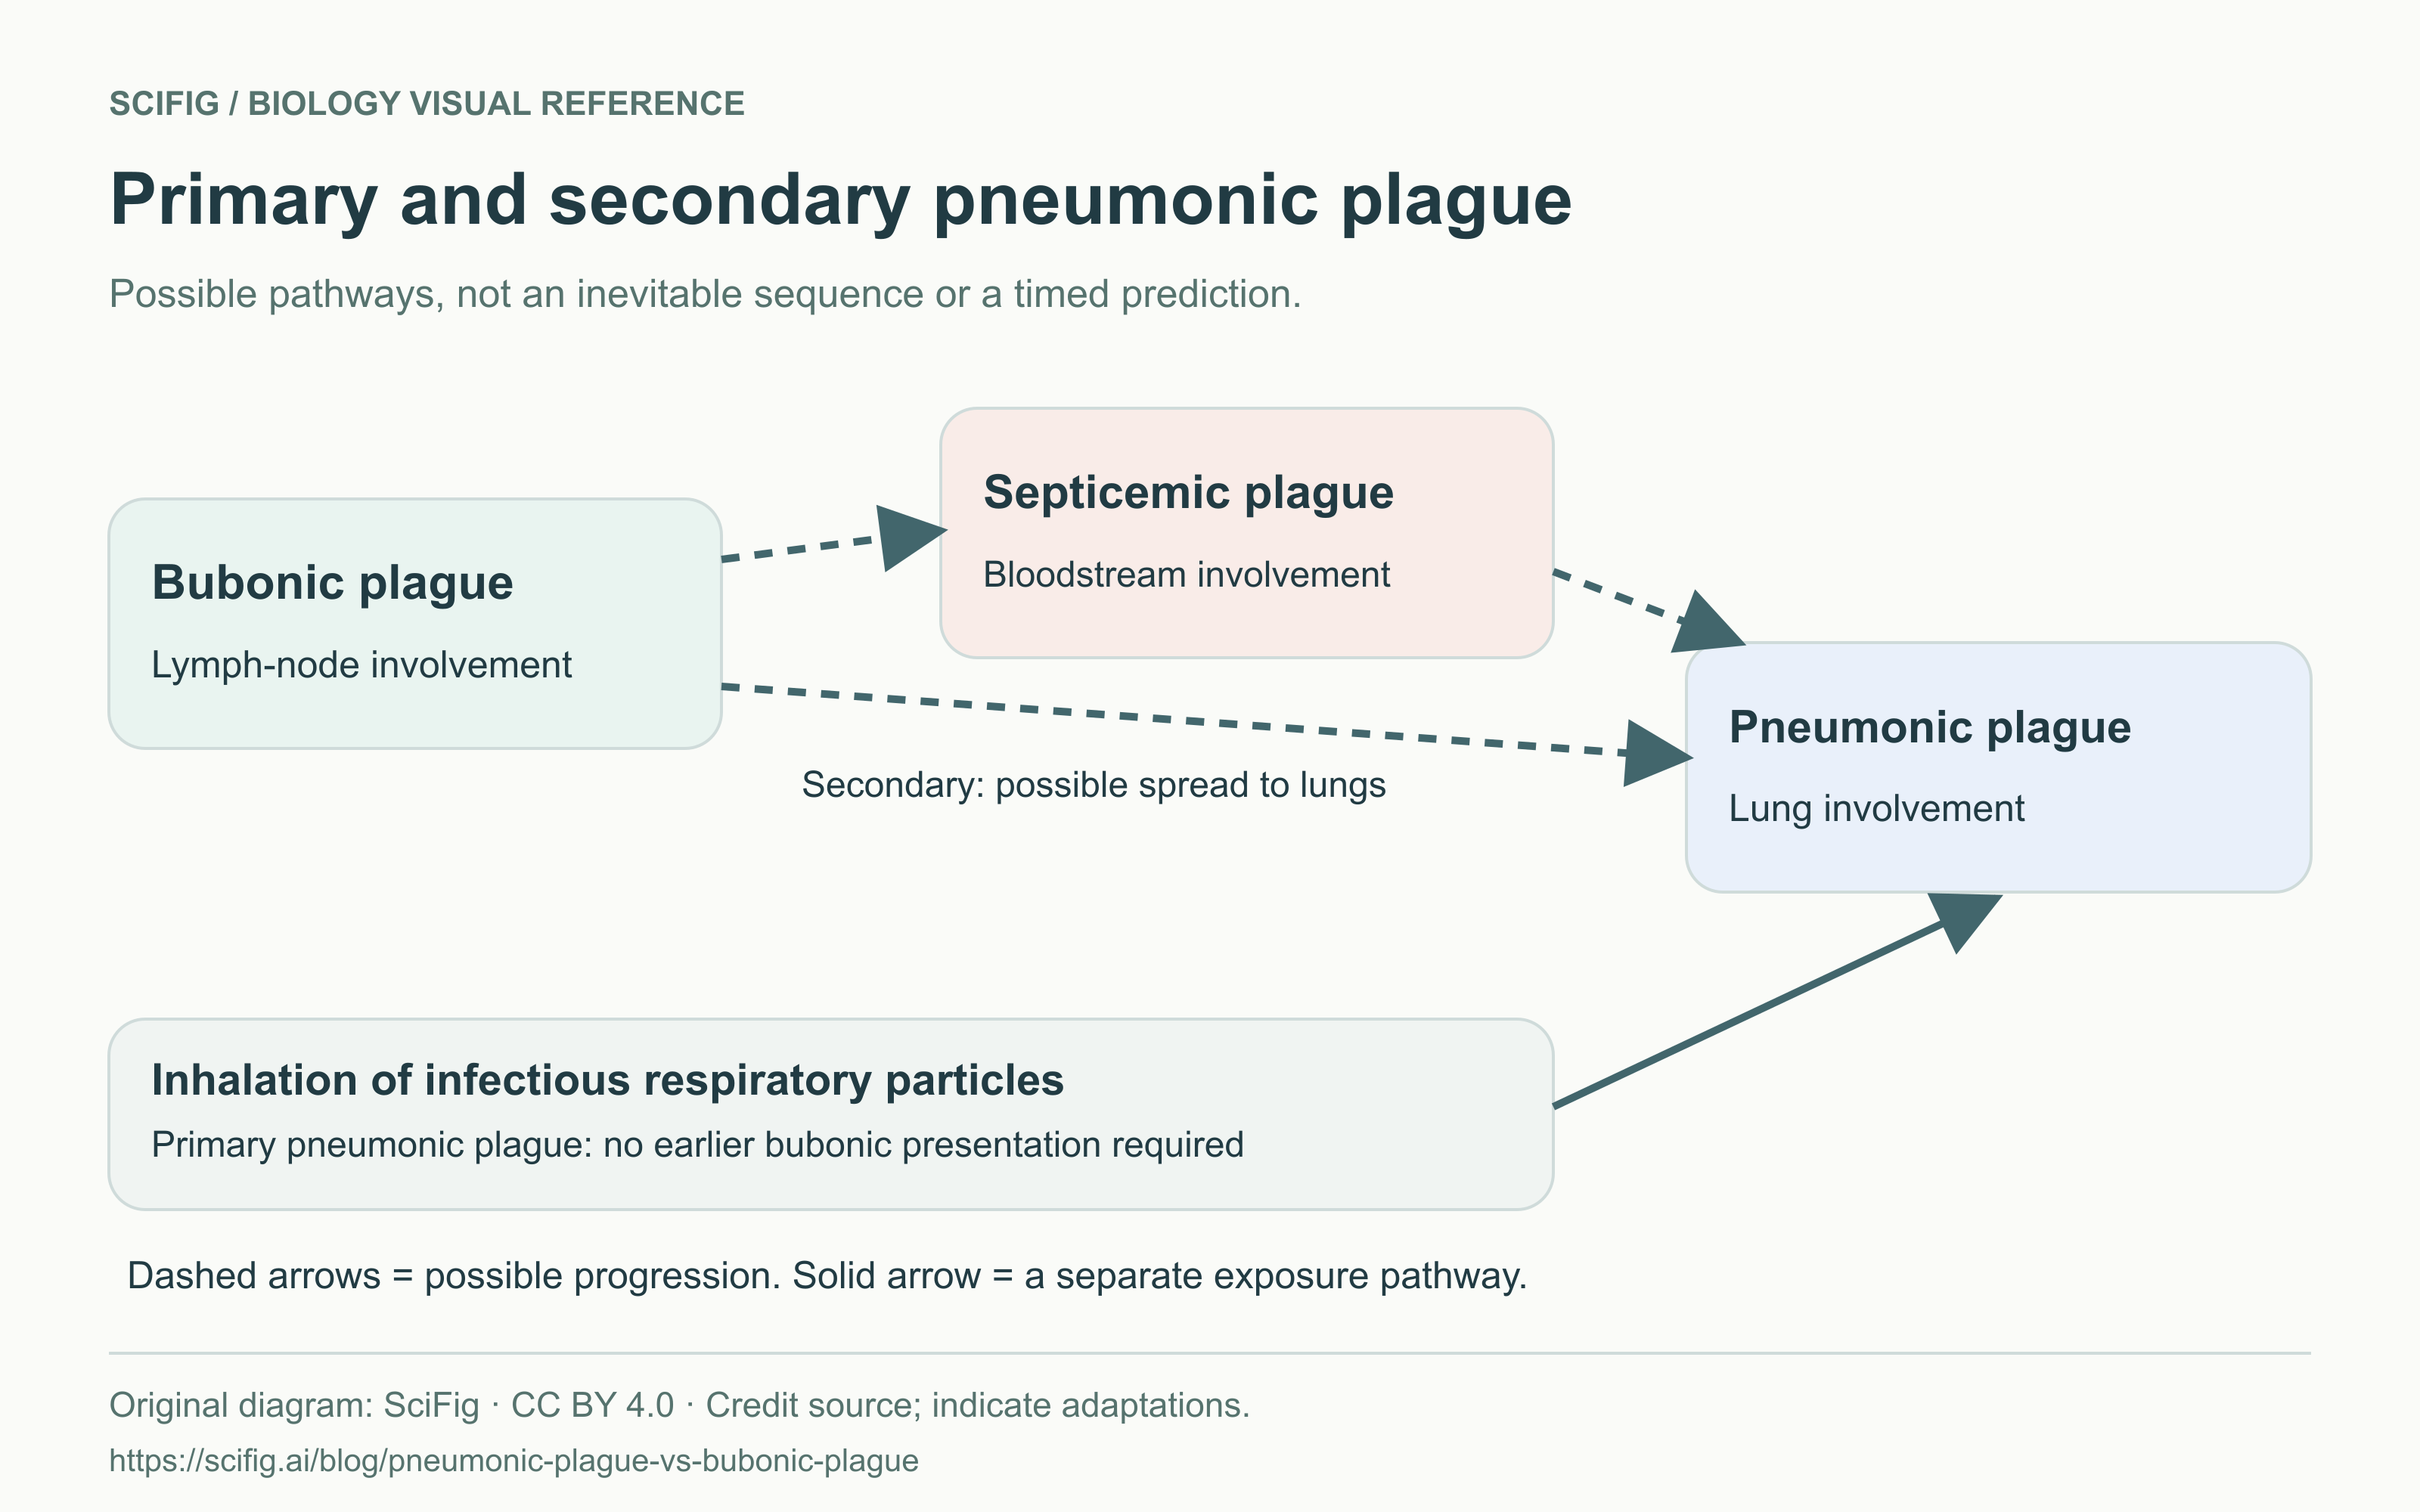
Bubonic plague can progress to pneumonic plague when infection spreads to the lungs.
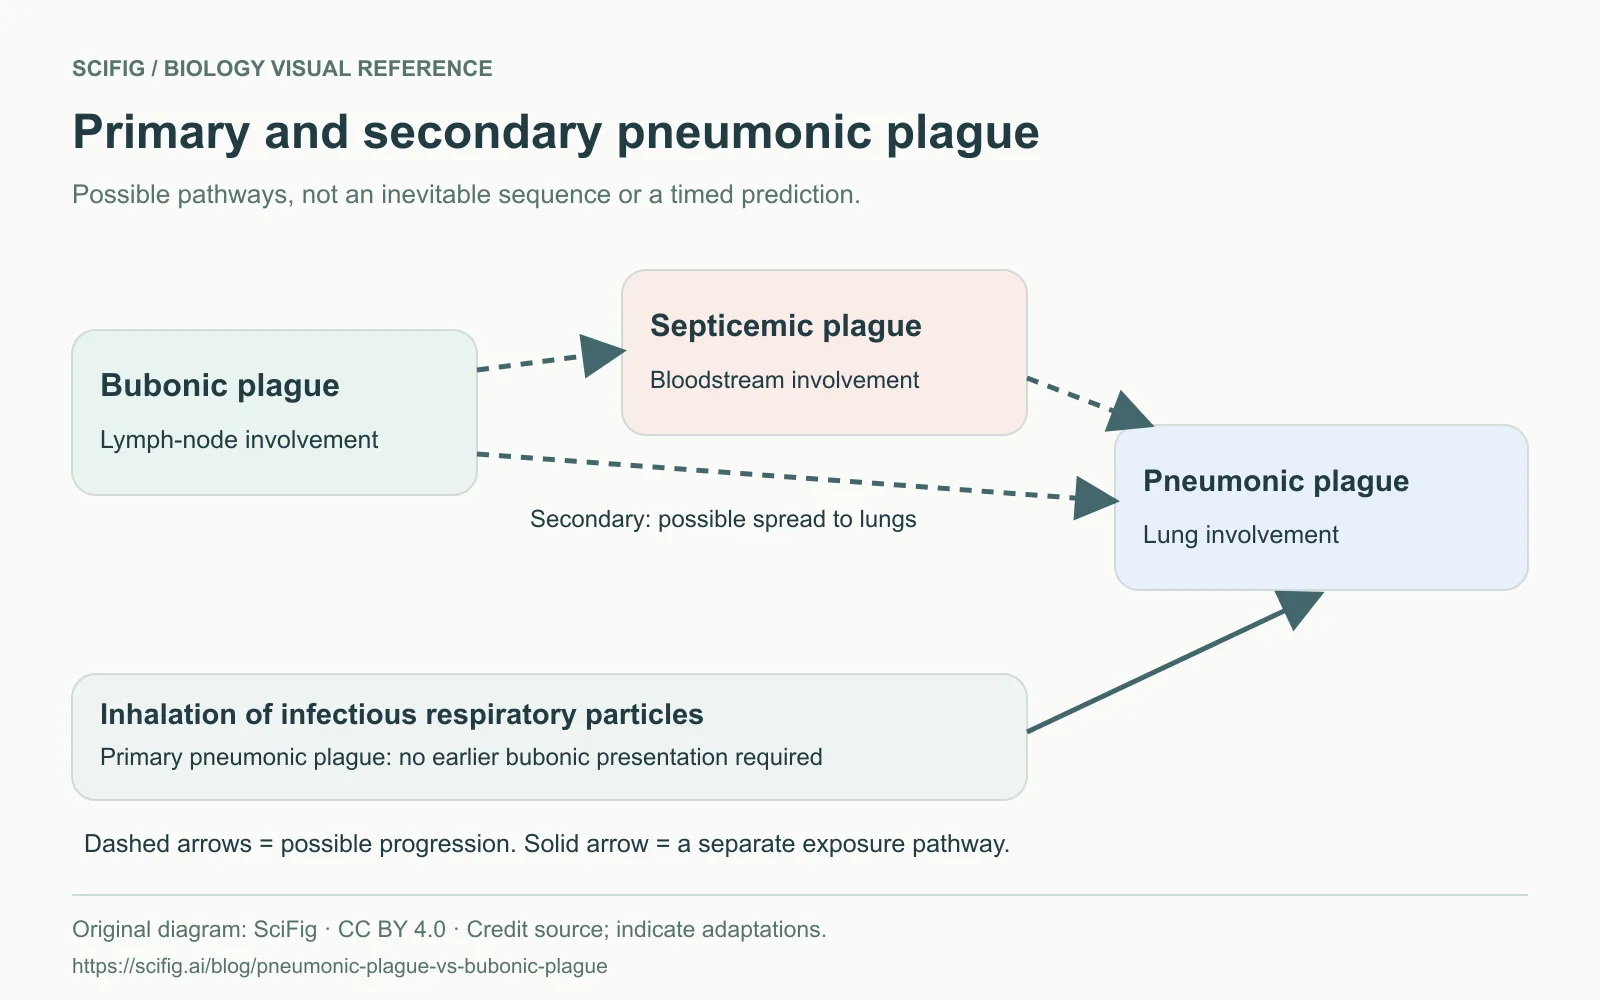
WHO describes spread from bubonic infection to the bloodstream or lungs. Primary pneumonic plague begins after infectious respiratory material is inhaled. Secondary pneumonic plague develops when an infection that began elsewhere reaches the lungs. These pathways explain why the forms should not be drawn as three sealed boxes.
Possible spread from lymph nodes to blood or lungs, alongside primary pneumonic plague after inhalation. Dashed arrows show possible progression. English labels.
Use dashed arrows for possible progression and a separate branch for inhalation. Do not read the figure as an inevitable timeline: it does not say that every bubonic case becomes septicemic and then pneumonic, or that a particular person will follow any displayed route.
If you build your own mechanism figure, SciFig can help develop the illustration or an editable flow diagram. Retain the source references and verify each connector against the explanation you want to teach.
Adapt the diagram for your lesson
Open the downloaded SVG in Vector Canvas to revise labels, colors and layout while preserving the scientific meaning.
Which form is more dangerous, and what do mortality rates mean?
CDC describes pneumonic plague as the most serious form; all forms require prompt medical care.
WHO emphasizes that early antibiotic treatment can save lives and that untreated pneumonic plague can be rapidly fatal. This does not make bubonic or septicemic plague harmless. A broad comparison should explain urgency without turning population statistics into a prediction for an individual.
A mortality percentage needs a named form, treatment status, study population and case definition. A historical estimate for untreated disease and an estimate from treated hospital patients have different denominators. Putting them into identical bars can imply a comparison the underlying evidence does not support. This page therefore uses an anatomical comparison, rather than an unsourced mortality ranking chart.
For a research presentation, cite the underlying study beside any numerical chart, state its time period and treatment context, and distinguish reported cases from all infections. Label “case-fatality ratio” explicitly when that is the measure. A slide caption should preserve these qualifications when the figure is reused outside the original talk.
Download and reuse the figures
These original SciFig PNG and editable SVG figures are free to reuse with attribution under CC BY 4.0.
The figures above are available directly without registration. SVG preserves editable text, shapes and connectors; PNG is a ready-to-place raster image. Their English labels support international slide decks, and the captions explain each diagram. Adapt the SVG text for your audience and keep the meaning of the routes and dashed arrows.
The Creative Commons Attribution 4.0 license allows sharing and adaptation, including commercial use. Credit SciFig, link to this page and the license, and indicate any changes. Attribution does not imply endorsement by SciFig, CDC, WHO or UKHSA. This grant applies to this page's original diagrams, not to material hosted on the source websites.
Suggested credit: “Diagram: SciFig, Pneumonic Plague vs Bubonic Plague, CC BY 4.0; adapted [if changed].” Include the article URL and license link in the slide notes, caption or accompanying credits. The SVG metadata and the figure footer carry the source and license so they stay attached to the editable file.
Sources checked on 6 October 2026: CDC signs and symptoms; CDC transmission; WHO plague fact sheet; UKHSA plague overview. The figures explain general biology and do not confirm the cause, diagnosis or spread of any reported incident.
Frequently asked questions
They are different clinical forms of infection with the same bacterium, Yersinia pestis. Bubonic plague mainly affects lymph nodes; pneumonic plague affects the lungs.
The three main clinical forms are bubonic, pneumonic and septicemic plague. The names refer primarily to lymph-node, lung and bloodstream involvement.
Yes. Infection can spread from the initial site to the lungs, producing secondary pneumonic plague. Inhalation can also cause primary pneumonic plague without an earlier bubonic presentation.
Pneumonic plague can spread through infectious respiratory droplets, generally during close contact. Do not interpret the other forms as having the same respiratory transmission pattern.
Untreated pneumonic plague can be rapidly fatal. Early diagnosis and antibiotic treatment are essential; a percentage without treatment status and a defined population is not a reliable personal risk estimate.
Yes. The original diagrams on this page use CC BY 4.0. Keep attribution to SciFig, link to the source and license, and indicate modifications. Download PNG for slides or SVG to edit text, shapes and connectors.
Keep going
Recommended resources
Templates, tools, and further reading for your research