Spider Chart Maker
Create professional spider charts and spider web graphs for multi-dimensional research comparison — describe your axes, generate a clean spider diagram, and export for papers.
Figure prompt
Core Subject (e.g., Cas9 protein cutting DNA)
Action / Details (e.g., Double strand break, detailed molecular view)
Start with 100 free credits|No credit card required
Get up to 300 free credits on day one when you join through an invite.
Reviewed by SciFig TeamUpdated
Spider Chart Maker— templates & examples
Everything you need to build your spider chart
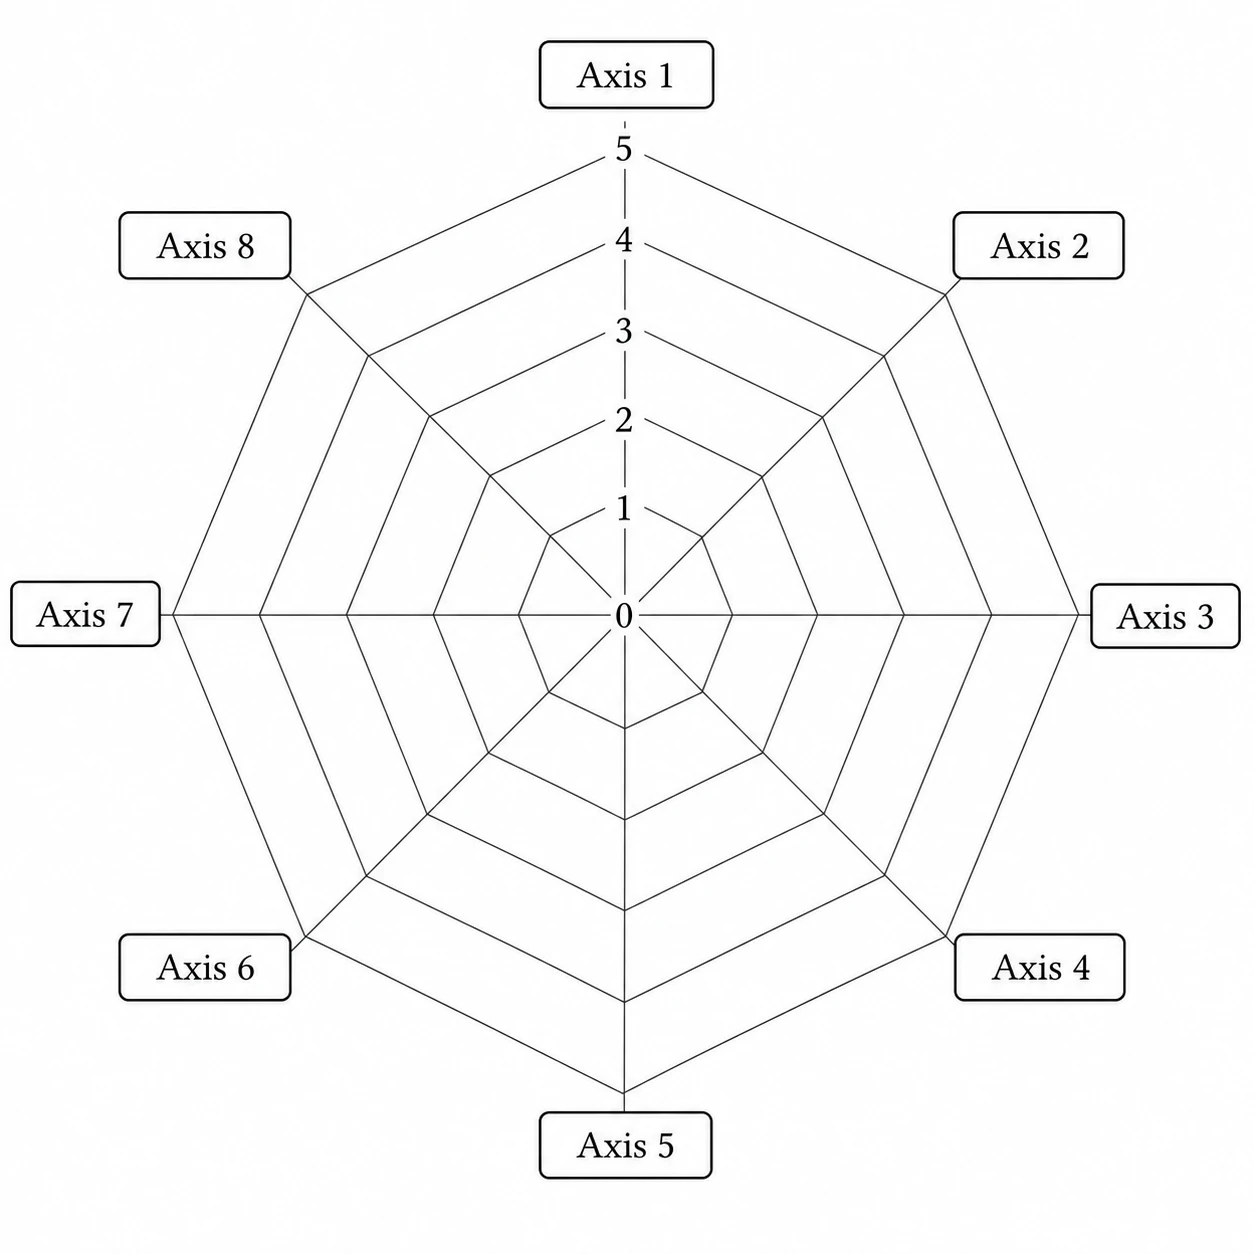
Generate a spider web graph from plain-language descriptions
A good spider chart maker should eliminate manual axis setup and polygon drawing. Describe your attribute names, scale, and group values in plain English, and SciFig renders a spider web graph with correctly spaced spokes, scale rings, and labeled axes — the standard spider diagram layout that journals expect, produced in seconds without spreadsheet software.
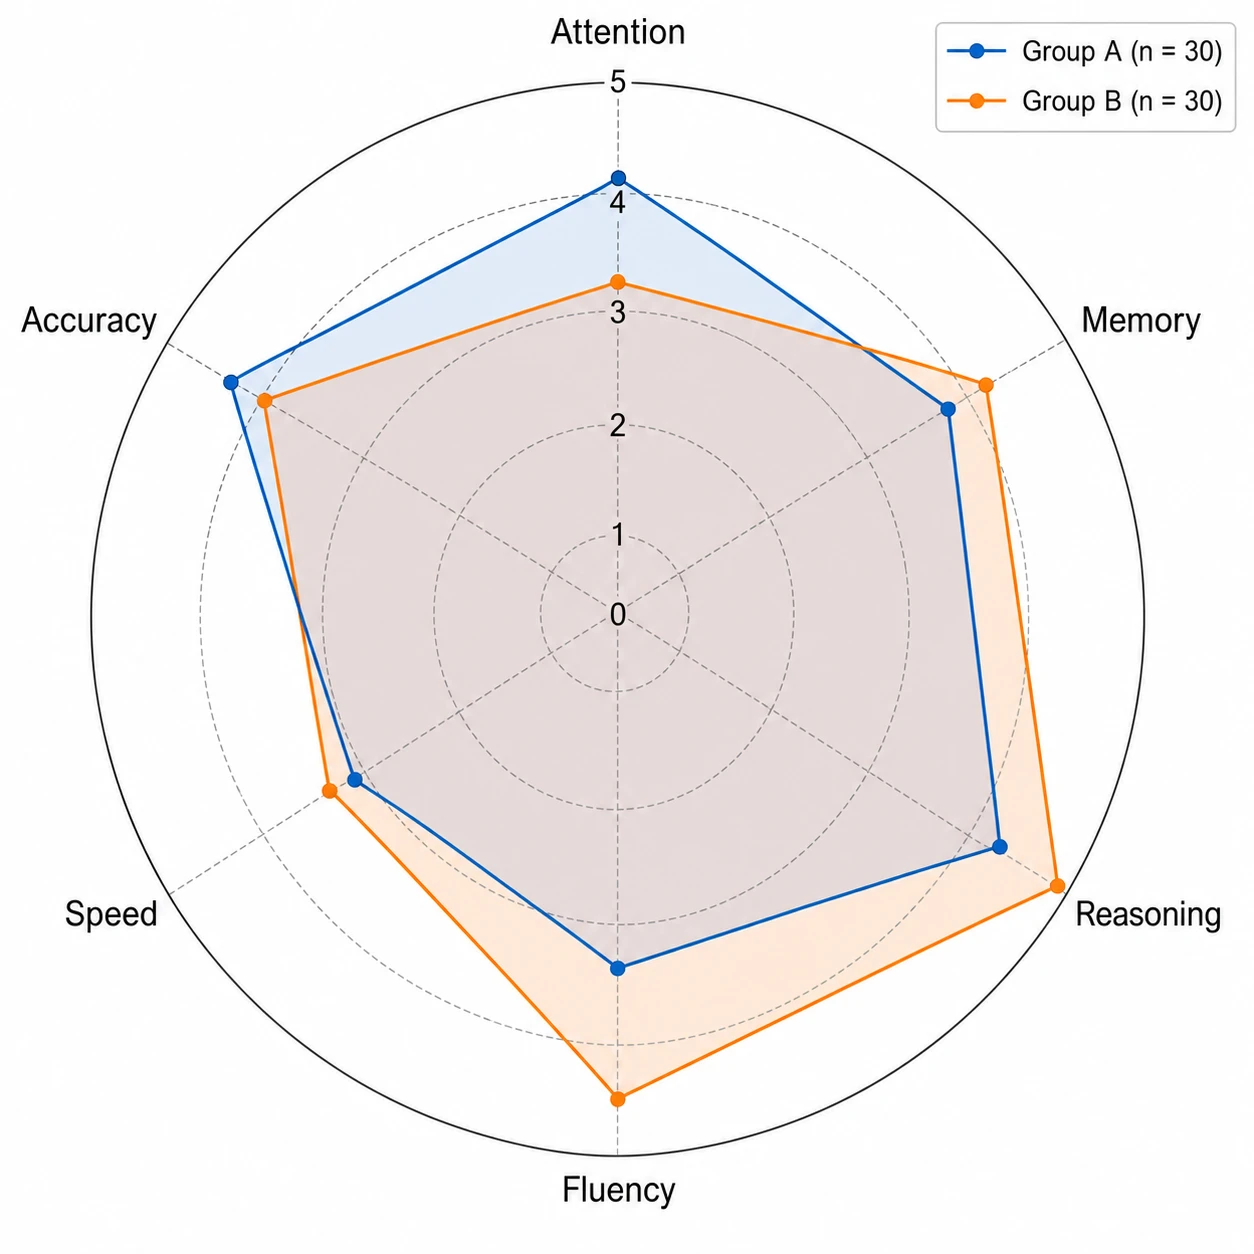
Compare multiple profiles on one spider diagram
Multi-group spider charts are the most common research use case. SciFig's spider chart maker overlays polygons for each group on the same spider web graph, assigns distinct accessible colors, and uses semi-transparent fills so overlapping regions remain clear. The result is a publication-ready spider diagram that makes attribute-level differences immediately visible.
Export and edit your spider chart for any venue
Your spider web graph must meet the figure requirements of your target journal, conference poster, or thesis format. SciFig outputs a fully editable spider chart at any resolution — relabel axes, adjust colors, resize the spider diagram, and export without rebuilding. Perfect for iterative manuscript revision.
What is a spider chart?
A spider chart — also known as a spider web graph or spider diagram — visualizes multivariate data by plotting values along axes from a central hub, forming a polygon that reveals the overall attribute profile of each entity. Researchers use spider charts to compare participants, products, or groups across five or more dimensions. With SciFig's spider chart maker you describe your axes and values and receive a clean, labeled spider web graph ready for journals, theses, or posters.
Why researchers use a spider chart maker
- Reveals the overall shape of a multi-attribute profile in a single glance
- Allows direct visual comparison of groups on every dimension simultaneously
- Spider web graph format is accepted by journals across psychology, medicine, and education
- More compact than a separate bar chart for each attribute
- Highlights which attributes drive between-group differences in a spider diagram
- Scales from four-axis spider charts to eight-axis spider web graphs without redesign
Key components of a spider chart
- Spokes — radial lines from center hub, one per attribute, evenly spaced
- Scale rings — concentric circles at equal scale intervals along all spokes
- Data polygon — a closed shape connecting each spoke's plotted value for one entity
- Group fills — distinct colors or line styles for each overlay polygon
- Spoke labels — attribute names at the outer tip of each spoke in the spider web graph
- Legend — identifies each group when the spider diagram shows multiple overlays
Where spider charts are used in research
- Psychology: ability and personality profiles displayed as spider diagrams for participant groups
- Sports science: athlete performance benchmarks comparing fitness attributes on a spider web graph
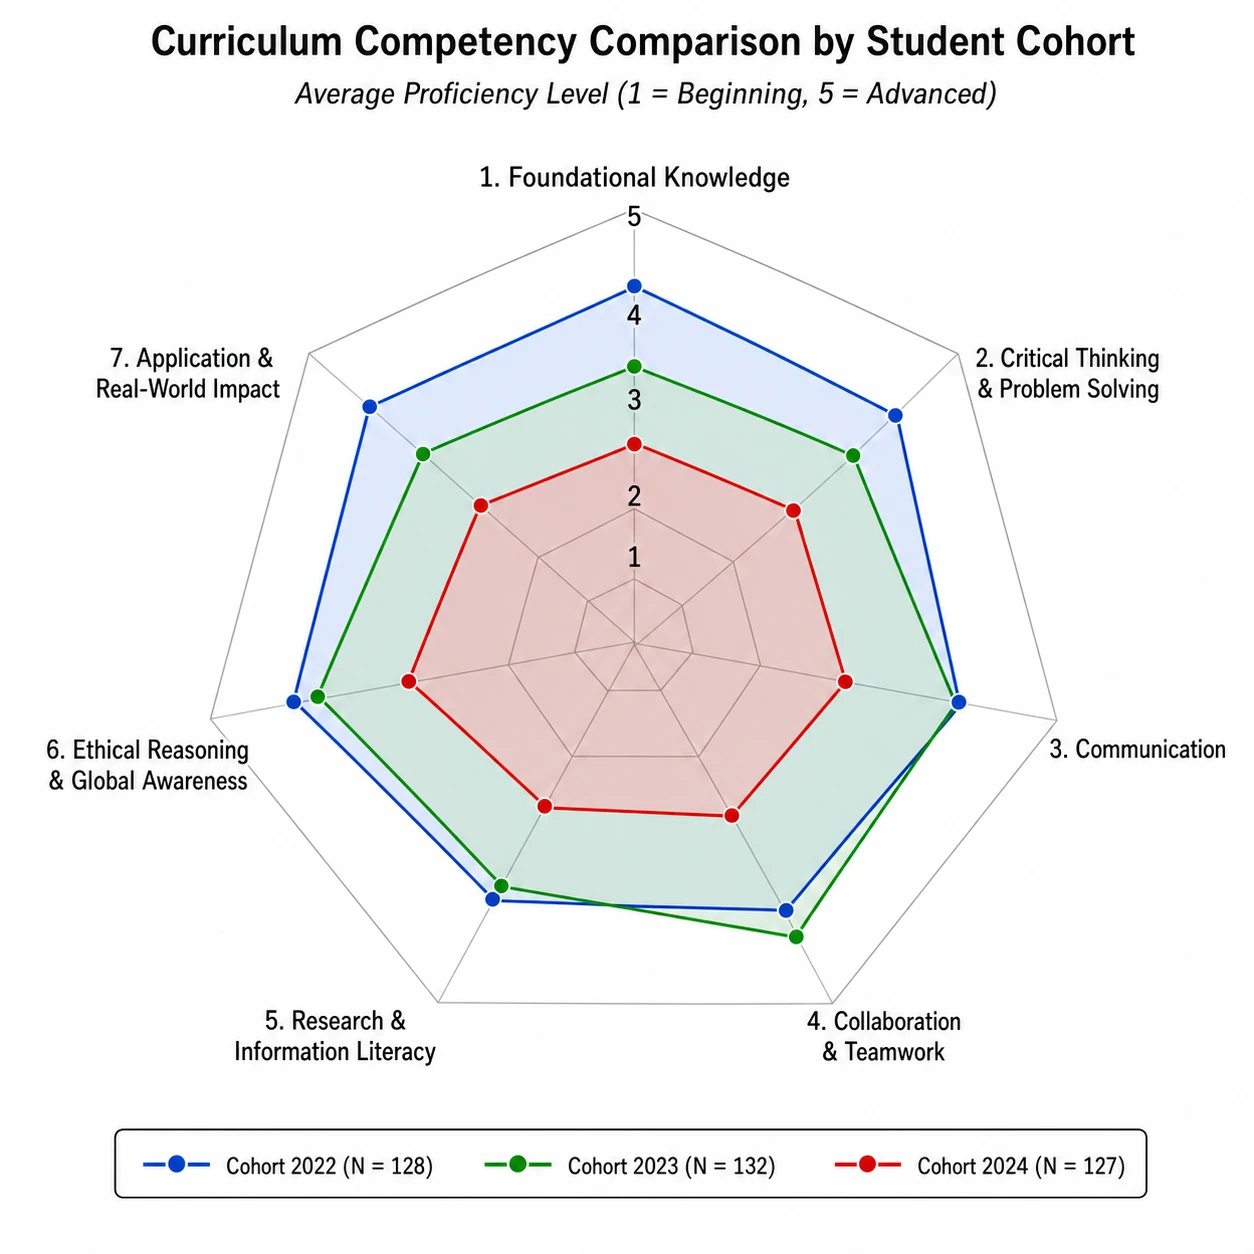
- Education: student competency assessments across curriculum domains using spider charts
- Product research: multi-attribute comparison of prototype designs on a spider chart maker output
- Clinical studies: symptom severity profiles before and after intervention shown as spider diagrams
- Organizational research: team capability radar using a spider web graph for workforce planning
How to make a spider chart
Describe your spider chart
Tell SciFig what to draw in plain language — no design tools required.
Generate with SciFig
Get a clean, publication-ready figure that matches your description in seconds.
Edit & export
Vectorize it into editable SVG, relabel everything, and export for your paper, poster, or slides.
Spider Chart Maker — Frequently Asked Questions
Common questions about Spider Chart Maker.
More tools

Conceptual Framework Generator
Create professional conceptual framework diagrams showing variable relationships, hypotheses, and theoretical models for your research.

Free Body Diagram Generator
Create accurate, publication-ready free body diagrams with labeled force vectors for weight, normal force, friction, and tension in seconds.

Bell Curve Generator
Generate a precise, fully labeled bell curve showing mean, standard deviations, and percentile regions — ready to export for your paper, thesis, or classroom.
Related links
Home
Turn text, sketches, references, PDFs, and photos into Scientific Figures
Text-to-Figure
Generate a figure from a plain-language description
Models
Default to GPT Image 2 for journal papers; switch to Nano Banana Pro for slides and posters; pick Nano Banana 2 for routine figure work
Tutorials
Seven short walkthroughs of the AI scientific figure generator
Blog
Tutorials, tool comparisons, and publication tips for researchers.
Inspiration
Explore publication-ready scientific figure examples, copy the prompts, and use them as starting points for your own work.

Ready to publish?
Make your own spider chart in minutes.
Start for freeFree to start · No credit card required · Built for researchers