Box Plot Generator
Generate clear, accurate box plots showing medians, interquartile ranges, whiskers, and outliers — describe your data groups and SciFig's box plot generator handles the rest.
Figure prompt
Core Subject (e.g., Cas9 protein cutting DNA)
Action / Details (e.g., Double strand break, detailed molecular view)
Start with 100 free credits|No credit card required
Get up to 300 free credits on day one when you join through an invite.
Reviewed by SciFig TeamUpdated
Box Plot Generator— templates & examples
Everything you need to build your box plot
Accurate five-number summary with outliers
A rigorous box plot generator must faithfully represent median, Q1, Q3, whiskers, and outlier points without distortion. Describe your data groups and distributional properties in plain language, and SciFig renders each box plot element according to standard Tukey conventions — the same rules your stats boxplot creator needs to pass peer review in journals across medicine, psychology, and biology.
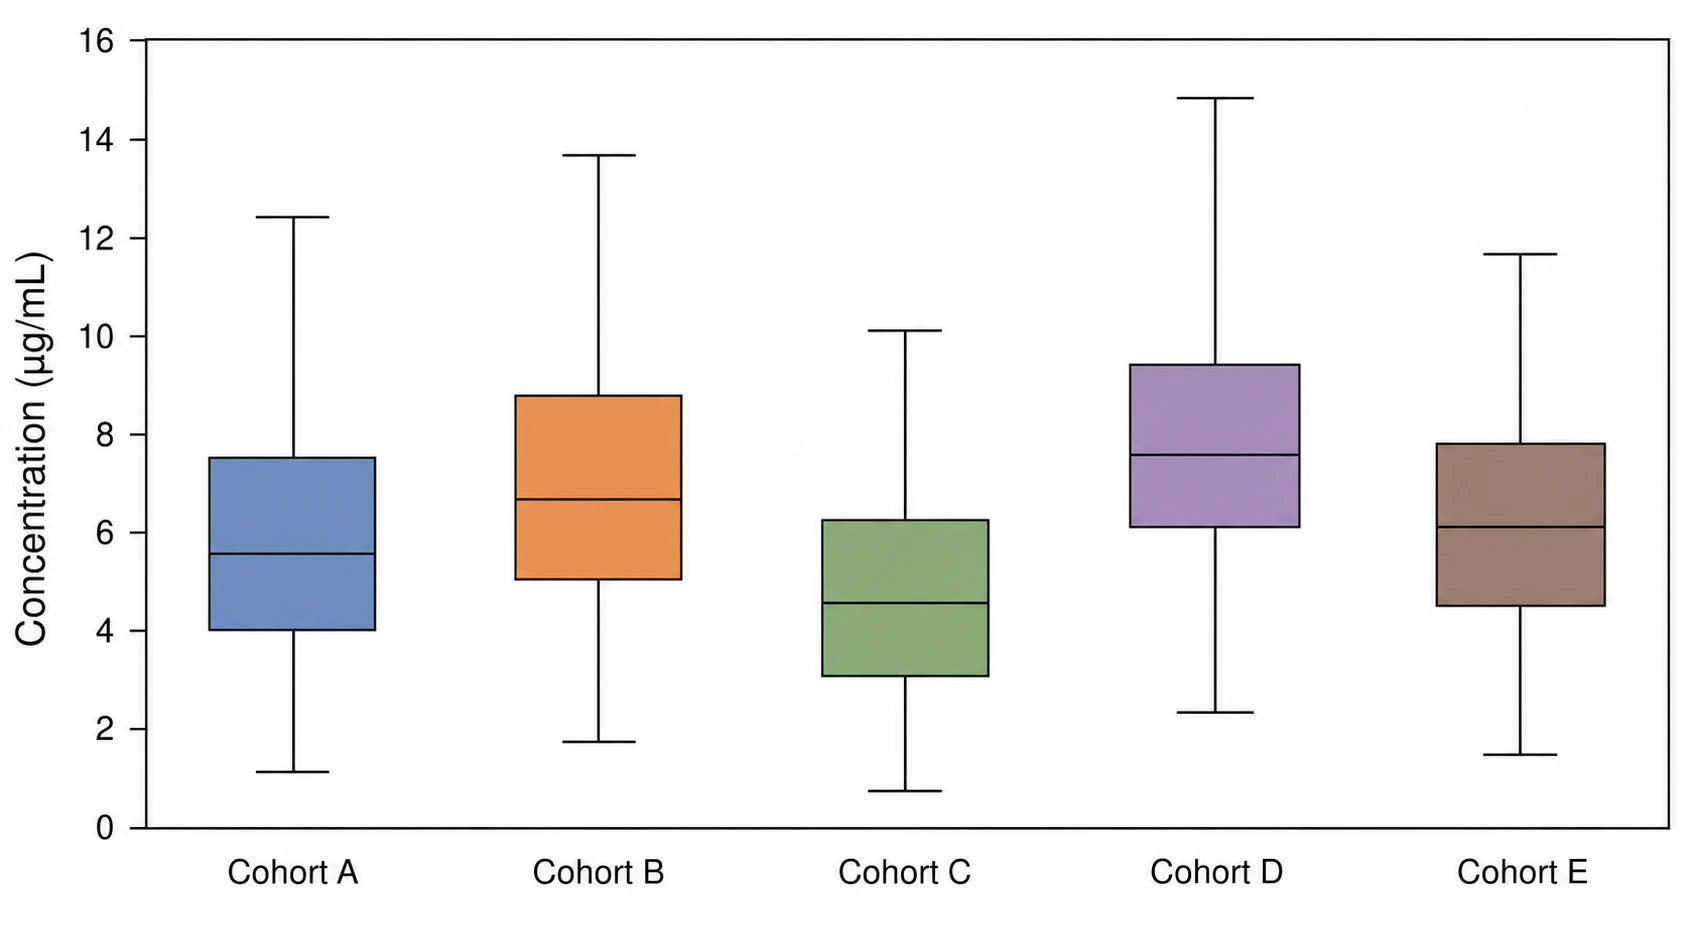
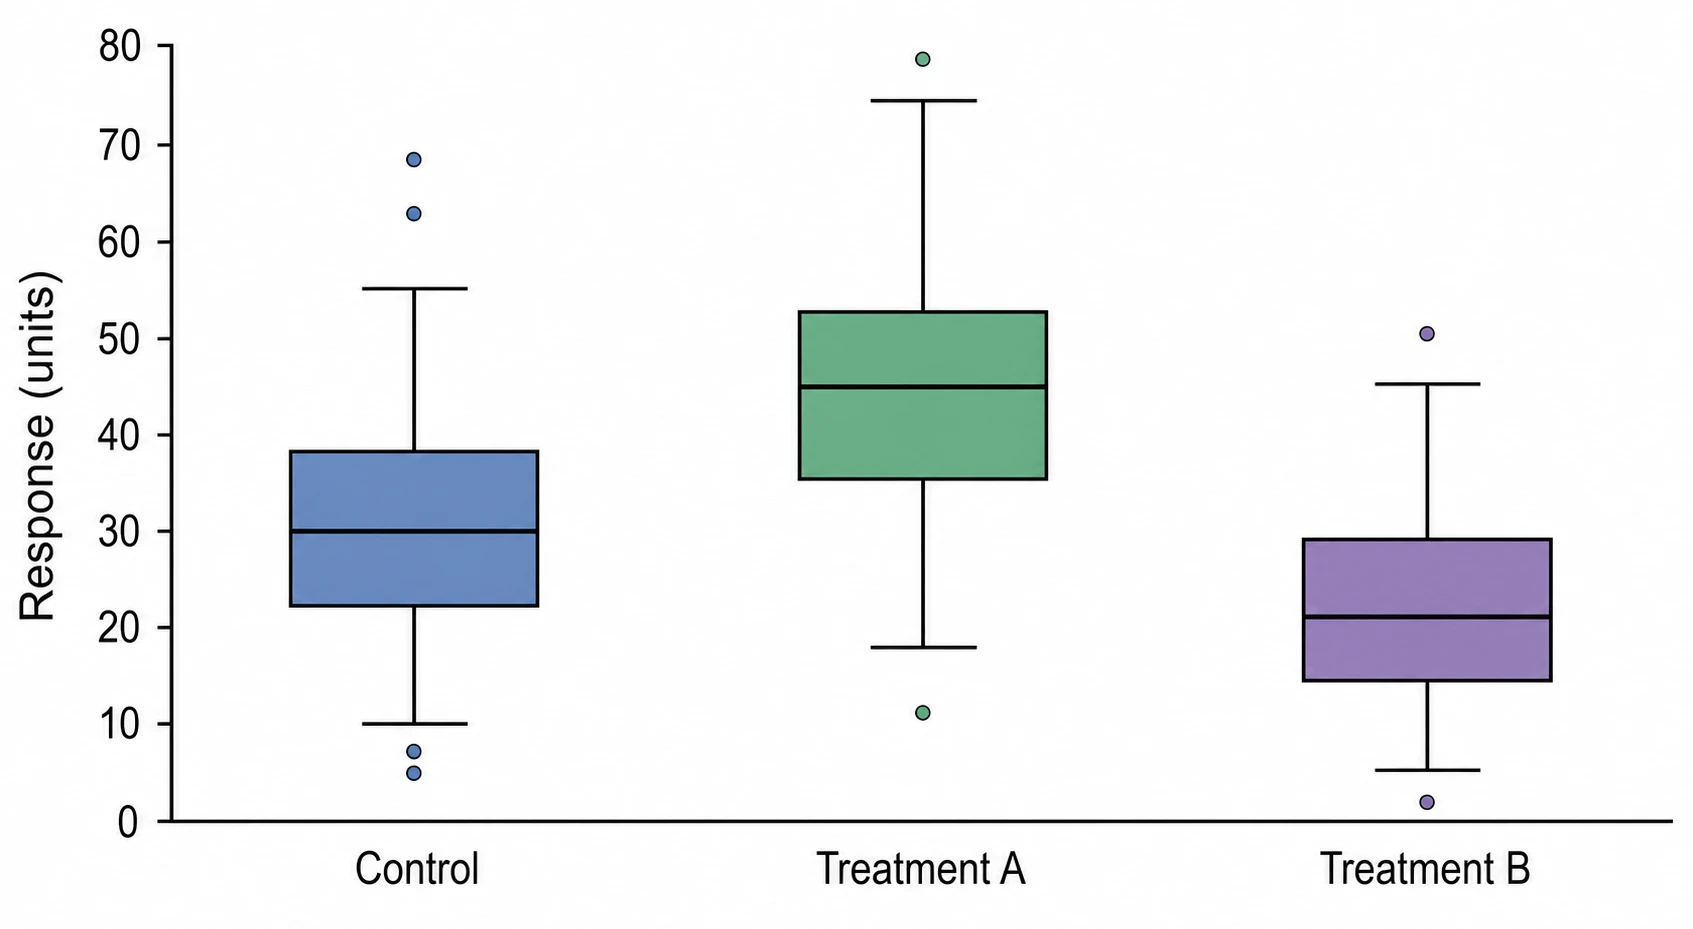
Side-by-side box plot generator for multiple groups
Comparing distributions across treatment arms, time points, or cohorts requires a box plot generator for multiple groups that aligns boxes on a shared axis with consistent scaling. SciFig places each group box side by side, assigns distinct colors, maintains uniform whisker rules, and labels the x-axis clearly — the standard multi-group layout reviewers and this stats boxplot creator are built to produce.
Export-ready box plots for any journal format
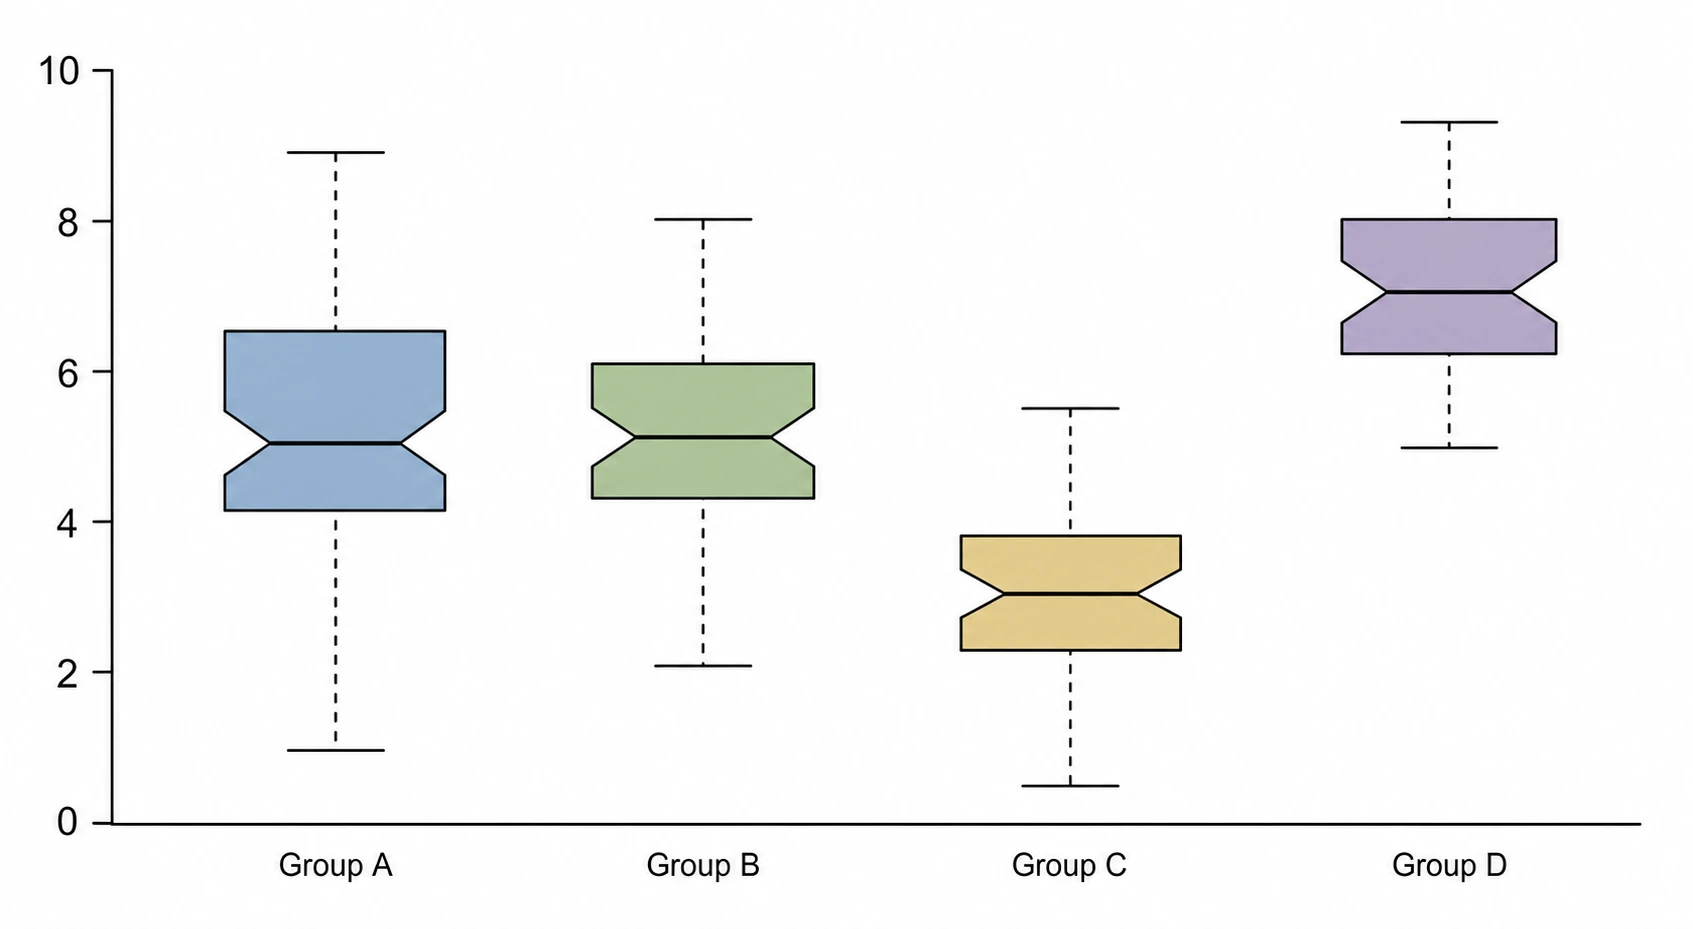
Your box plot must meet journal figure specifications for line weight, font size, and white-background clarity. SciFig's box plot generator outputs fully editable figures at any resolution — adjust axis ranges, relabel groups, switch between standard and notched styles, and export without starting over.
What is a box plot?
A box plot — also called a box-and-whisker plot — summarizes a continuous distribution using five numbers: minimum, Q1, median, Q3, and maximum, while flagging individual outliers beyond the whiskers. Box plots are expected in any study reporting group-level continuous outcomes across biology, psychology, medicine, and education. With SciFig's box plot generator you describe your groups and receive a labeled, publication-ready figure showing medians, quartiles, whiskers, and outliers.
Why researchers use a box plot generator
- Displays distribution shape, spread, and central tendency in one compact figure
- Reveals skewness and outliers that means and standard deviations hide
- Standard in clinical trials, biological assays, and social-science group comparisons
- Side-by-side box plots make between-group differences immediately visible
- Accepted by Nature, Science, JAMA, and all major journals as a primary figure type
- Requires no assumption about normality — valid for any continuous variable
Key components of a box plot
- Box — spans Q1 to Q3, representing the interquartile range (IQR) of the data
- Median line — horizontal line inside the box marking Q2
- Whiskers — lines extending to the last data point within 1.5× IQR from Q1 and Q3
- Outlier points — individual dots for values beyond the whisker tips
- Notch (optional) — v-shaped indent showing the 95% confidence interval around the median
- Group labels — x-axis categories identifying each comparison group
Where box plots are used in research
- Clinical trials comparing biomarker levels across treatment and control arms
- Psychology studies showing reaction-time or score distributions per experimental condition
- Genomics and proteomics comparing expression values across sample groups
- Education research displaying test-score distributions across school or demographic cohorts
- Environmental science comparing pollutant concentrations across sampling sites
- Quality-control analyses showing process measurement distributions per batch or shift
How to make a box plot
Describe your box plot
Tell SciFig what to draw in plain language — no design tools required.
Generate with SciFig
Get a clean, publication-ready figure that matches your description in seconds.
Edit & export
Vectorize it into editable SVG, relabel everything, and export for your paper, poster, or slides.
Box Plot Generator — Frequently Asked Questions
Common questions about Box Plot Generator.
More tools

Conceptual Framework Generator
Create professional conceptual framework diagrams showing variable relationships, hypotheses, and theoretical models for your research.

Free Body Diagram Generator
Create accurate, publication-ready free body diagrams with labeled force vectors for weight, normal force, friction, and tension in seconds.

Bell Curve Generator
Generate a precise, fully labeled bell curve showing mean, standard deviations, and percentile regions — ready to export for your paper, thesis, or classroom.
Related links
Home
Turn text, sketches, references, PDFs, and photos into Scientific Figures
Text-to-Figure
Generate a figure from a plain-language description
Models
Default to GPT Image 2 for journal papers; switch to Nano Banana Pro for slides and posters; pick Nano Banana 2 for routine figure work
Tutorials
Seven short walkthroughs of the AI scientific figure generator
Blog
Tutorials, tool comparisons, and publication tips for researchers.
Inspiration
Explore publication-ready scientific figure examples, copy the prompts, and use them as starting points for your own work.

Ready to publish?
Make your own box plot in minutes.
Start for freeFree to start · No credit card required · Built for researchers