SciFig

Free Timeline Generator to Scale

Make a timeline to scale from your dated events, with horizontal or vertical layouts and SVG or PNG export.

Describe what you need in the box above.

Start with up to 150 free credits|No credit card required

Get up to 350 free credits on day one when you join through an invite.

3 figure engines · 500+ templatesEvery label editable · 60+ color schemesEditable PPTX · Layered SVG · 8K PNG / JPG

Proportional timeline

Enter event labels and years or ISO dates (0001–9999). Positions follow the actual time between events.

Orientation
1
2
3

Free Timeline Generator to Scale— templates & examples

Updated

Dates with meaningful distance

Free Timeline Generator to Scale

Show how long events are apart, with labels that remain readable in your report or presentation.

A proportional timeline places events according to elapsed time rather than evenly spaced cards. Use this timeline generator with years or complete ISO dates to compare research milestones, historical developments or an experiment’s schedule. The tool sorts the dates, keeps simultaneous events at one time position and separates their labels. Switch between horizontal and vertical layouts, save the settings locally and export SVG or PNG for your document. The AI input remains available for illustrated timelines.

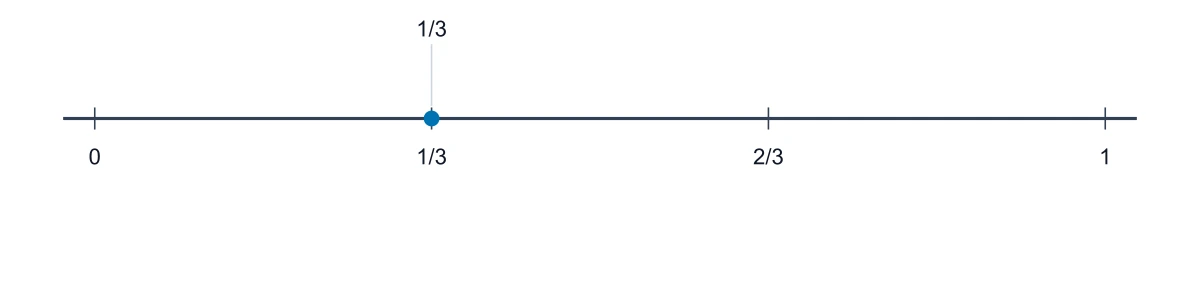
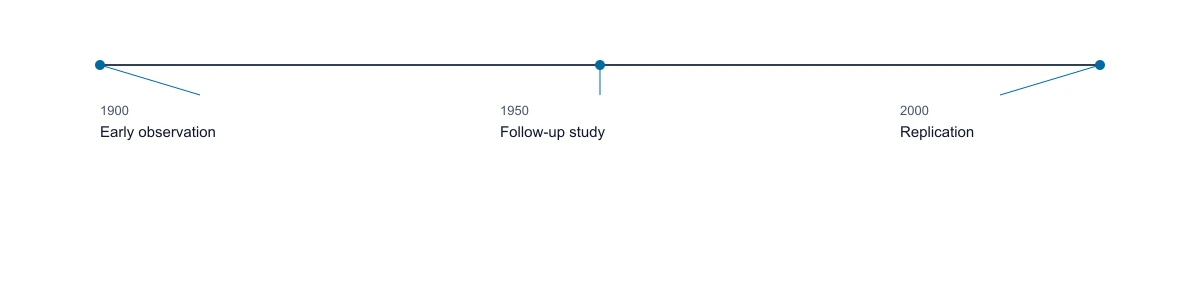
Proportional timeline with 1900, 1950 and 2000 at equal fifty-year intervals
  • Use years or ISO dates
  • Preserve proportional date spacing
  • Choose horizontal or vertical layout
  • Save JSON and export SVG or PNG

Proportional Timeline Generator Features

The proportional timeline generator turns a dated event list into a time-scaled figure with calendar validation, readable labels and local export.

Make the distance between dates meaningful

A milestone list can hide a long gap between two events when every card receives the same space. Use the timeline generator to scale the distance between milestones according to the elapsed time. Each event is positioned between the earliest and latest date. For a year-based example, 1950 lies halfway between 1900 and 2000. Use the result when the duration between milestones is part of the explanation, while retaining the dates as visible labels.

  • Position events by elapsed time
  • Sort dates into chronological order
  • Keep the source date beside each event
Create a proportional timeline

Work with calendar dates and shared milestones

Enter complete ISO dates for a study schedule or use years for a longer history. Calendar validation identifies impossible dates rather than quietly removing a row. When several events happen on the same date, their markers retain the same time coordinate while labels occupy separate positions. That makes a shared milestone readable without inventing an interval between its events.

  • Use years or YYYY-MM-DD dates
  • Identify invalid calendar dates
  • Separate labels for simultaneous events
Create a proportional timeline

Fit the timeline to the document

Choose a horizontal layout for a presentation or a vertical layout for a narrow report column. The orientation changes the presentation while preserving the calculation of time positions. Long labels can be distributed around the axis, helping readers connect each explanation with its dated marker rather than mistaking label spacing for the time scale.

  • Switch horizontal and vertical orientation
  • Retain proportional event positions
  • Read long and simultaneous labels
Create a proportional timeline

Keep inputs and export a reusable figure

Use the proportional timeline generator to save the event list and layout settings in a JSON file before sharing the finished image. Reloading that file restores the inputs for a later revision. Export SVG for vector editing or PNG for documents and slides. These local actions use the proportional tool directly, so a dated timeline can be prepared without starting an AI generation.

  • Save and reload JSON settings
  • Export a vector SVG figure
  • Download a PNG for documents
Create a proportional timeline

How to Make a Timeline to Scale

Prepare dates and labels, review the calculated layout, then keep the inputs and the exported figure together.

  1. Enter dated events

    Write one event per line using the input format shown in the tool. Use a year for broad historical milestones or an ISO date when the day matters. Include a short label that explains what happened.

  2. Review dates and the time scale

    Check validation messages and correct impossible dates before exporting. Inspect the first and last events and a known middle date to confirm the intended span. Events are sorted chronologically rather than kept in an accidental input order.

  3. Choose orientation and inspect labels

    Switch between horizontal and vertical views to fit the destination. Review crowded periods and simultaneous events. Separate label placement keeps the time markers at their calculated positions, preserving the meaning of the gaps.

  4. Save settings and export the figure

    Download JSON settings for future changes, then export SVG or PNG for the report or presentation. Keep the source dates with your project so readers and collaborators can verify the milestone sequence.

Timelines for Research, Teaching and Reports

Choose a proportional layout when the gap between events contributes to the explanation, from a century of discoveries to a study schedule.

Proportional timeline with 1900, 1950 and 2000 at equal fifty-year intervals

Explain the pace of a research field

Place selected discoveries from a literature review on a year-based scale. A long quiet interval stays visually longer than a cluster of nearby publications, helping the reader discuss the pace of development without inferring it from evenly spaced cards.

Explore this example
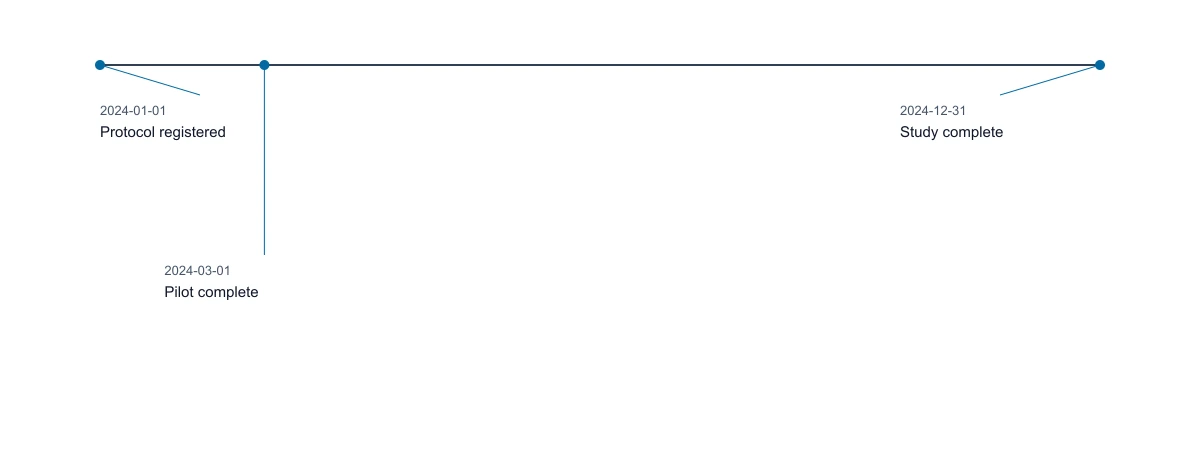
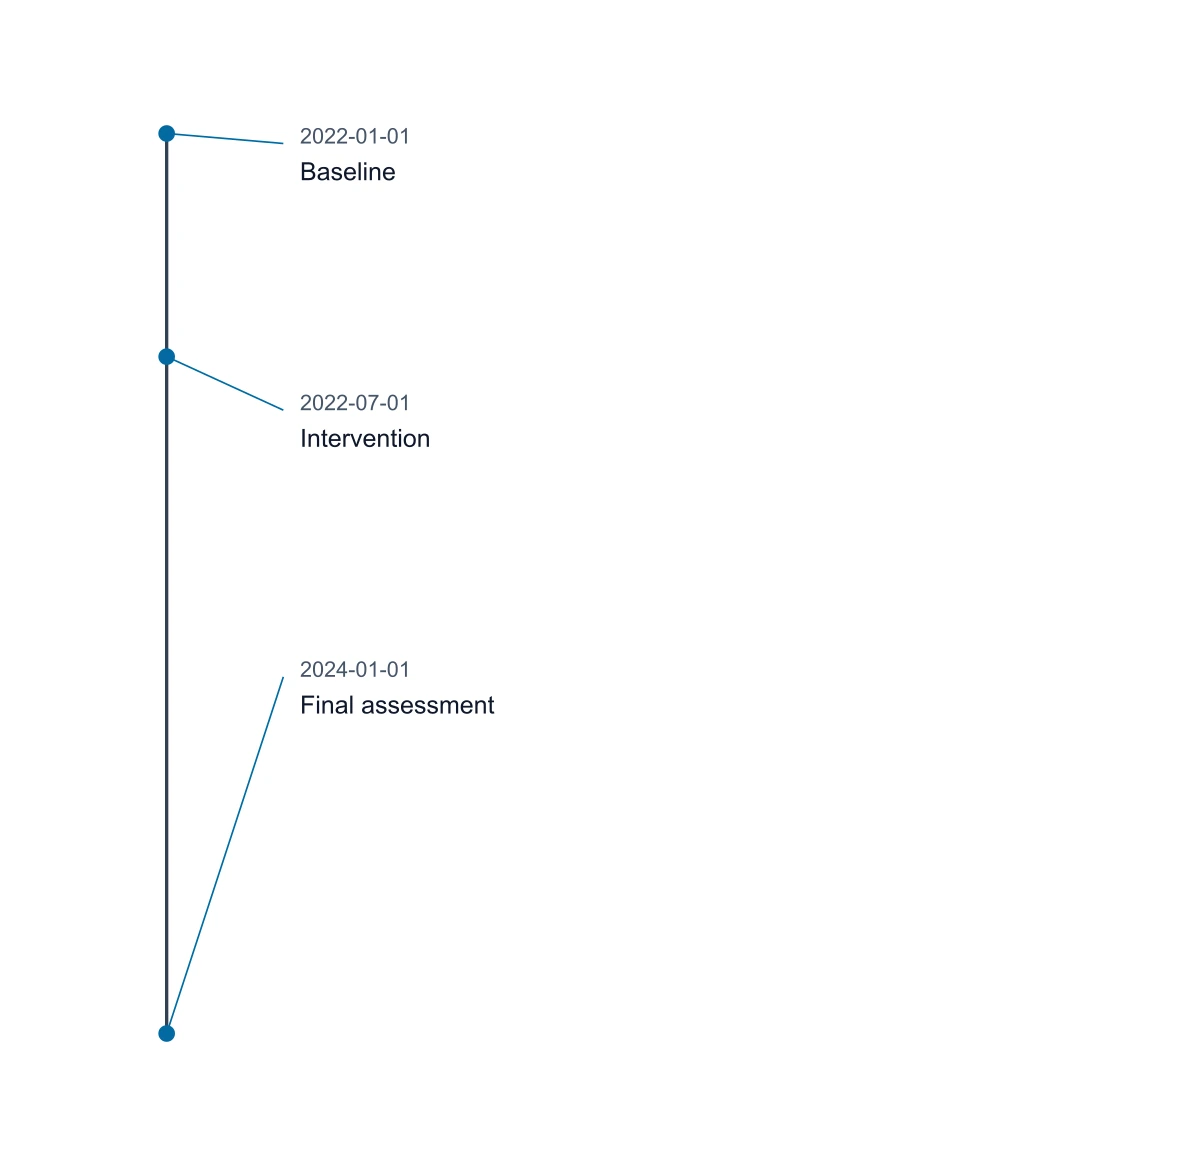
Research milestones positioned by their calendar dates

Prepare a study milestone overview

Use approved calendar dates for protocol review, recruitment, data collection and analysis. A proportional overview shows where the scheduled gaps fall. Keep it beside the detailed plan when discussing timing with collaborators; this figure does not assign resources or track task completion.

Explore this example
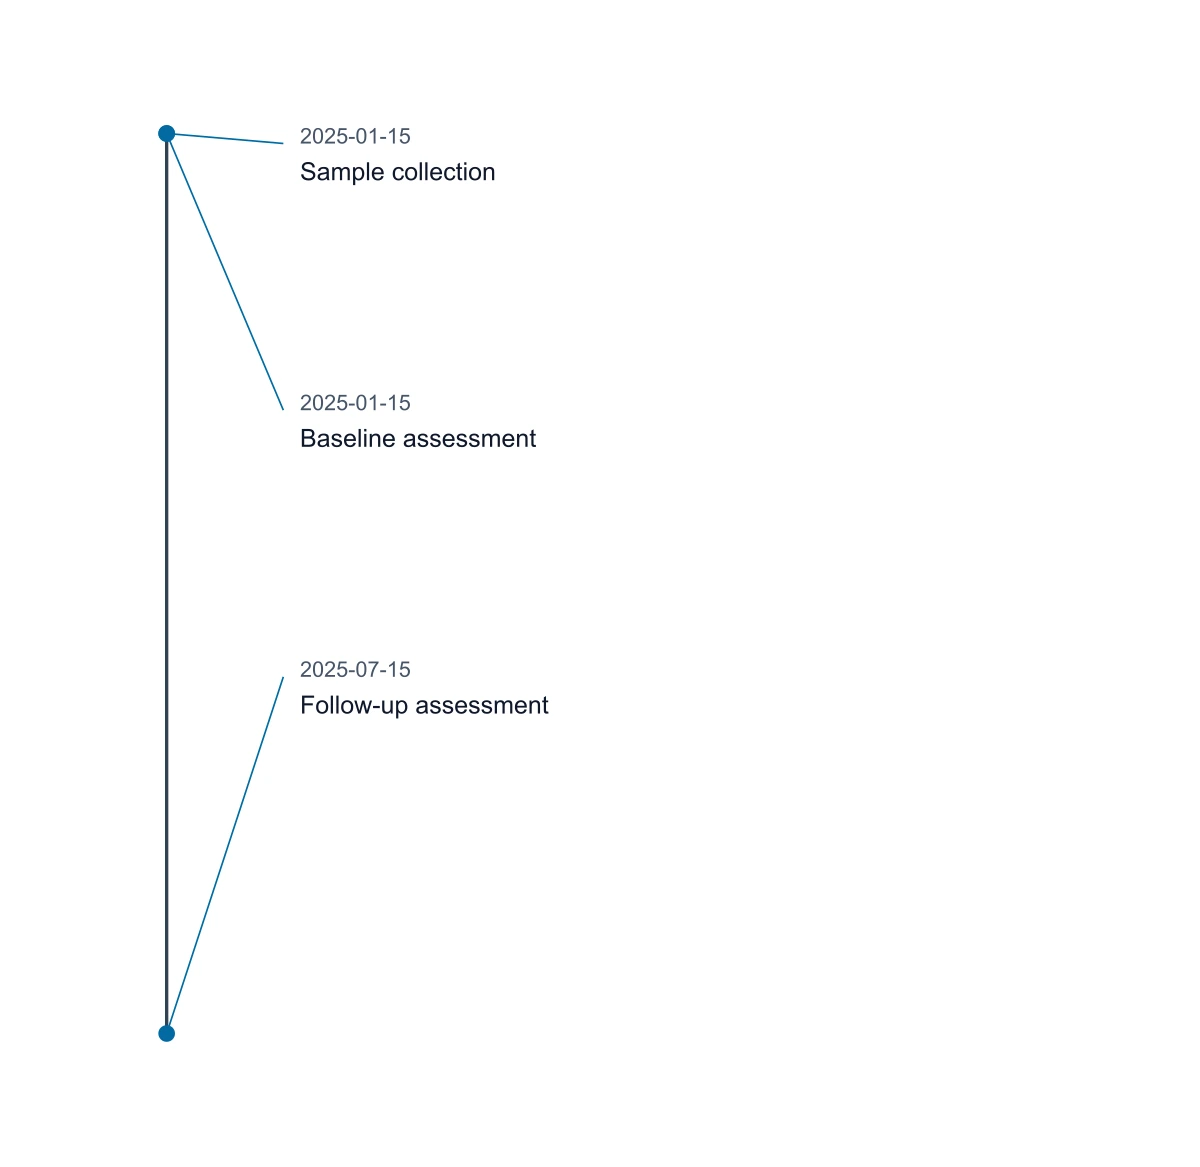
Vertical proportional timeline from baseline in 2022 to final assessment in 2024

Compare stages of a laboratory experiment

Plot planned dates for preparation, measurement and follow-up. The date gaps provide a quick view of the sequence for a lab meeting. Events that share a day can retain separate labels without being moved to different dates for visual convenience.

Explore this example
Proportional timeline with 1900, 1950 and 2000 at equal fifty-year intervals

Teach chronology with meaningful gaps

Enter historical events whose intervals differ substantially. Compare the displayed distances with the dates to explain what a time scale encodes. The 1900, 1950 and 2000 example offers a simple check before introducing a less regular sequence.

Explore this example
Events sharing a date retain the same time position with separate labels

Present milestones that occurred together

Show a release, report and meeting recorded on one date as separate labeled events at the same time position. The figure communicates coincidence while keeping every entry visible, useful when preparing a project history from several records.

Explore this example
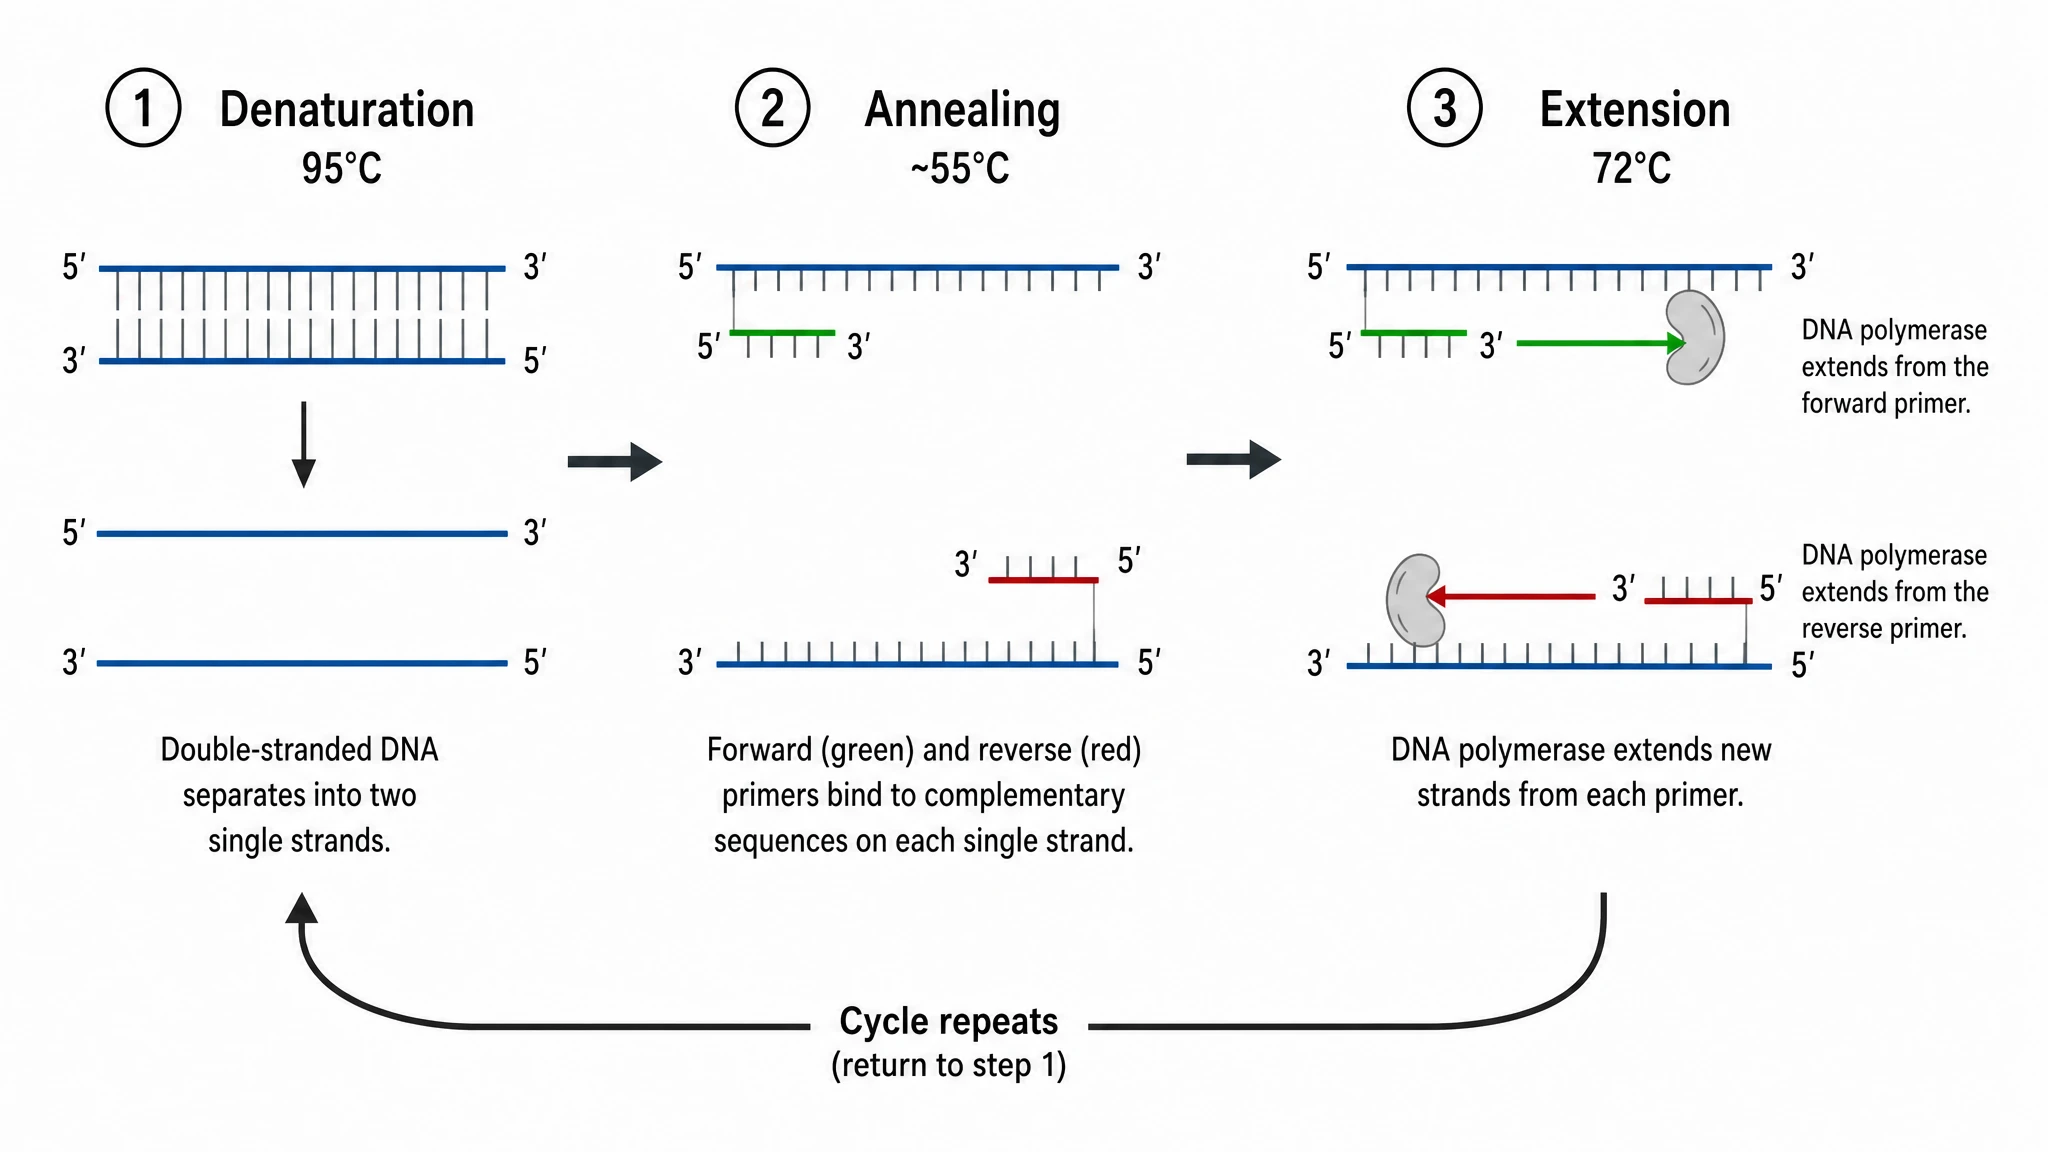
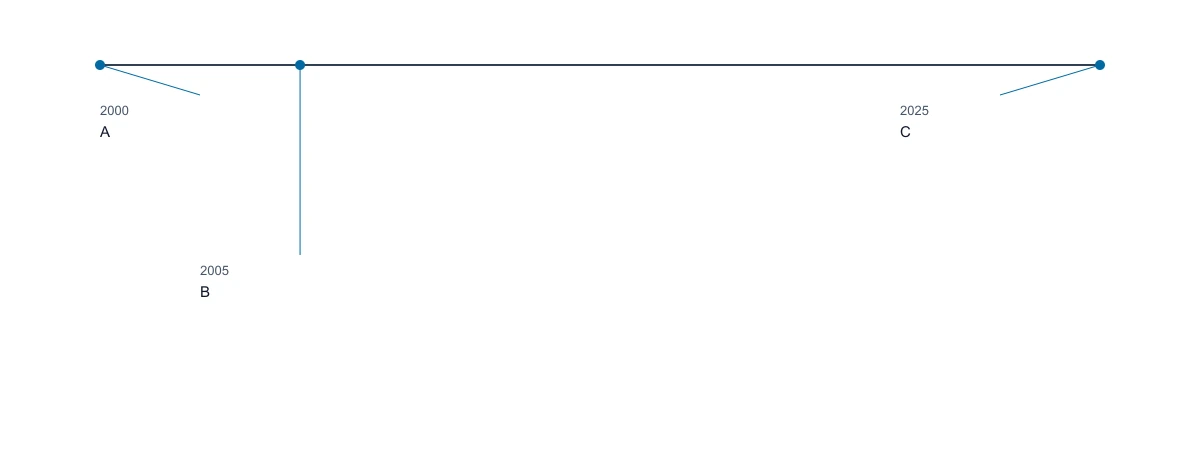
Year timeline with 2000, 2005 and 2025 showing a short and a long gap

Revise a timeline for a later report

Reload saved JSON settings, add a newly confirmed date and inspect the updated range. Export a fresh vector figure for the report. Keeping the inputs alongside the exported image makes subsequent revisions easier to reproduce.

Explore this example
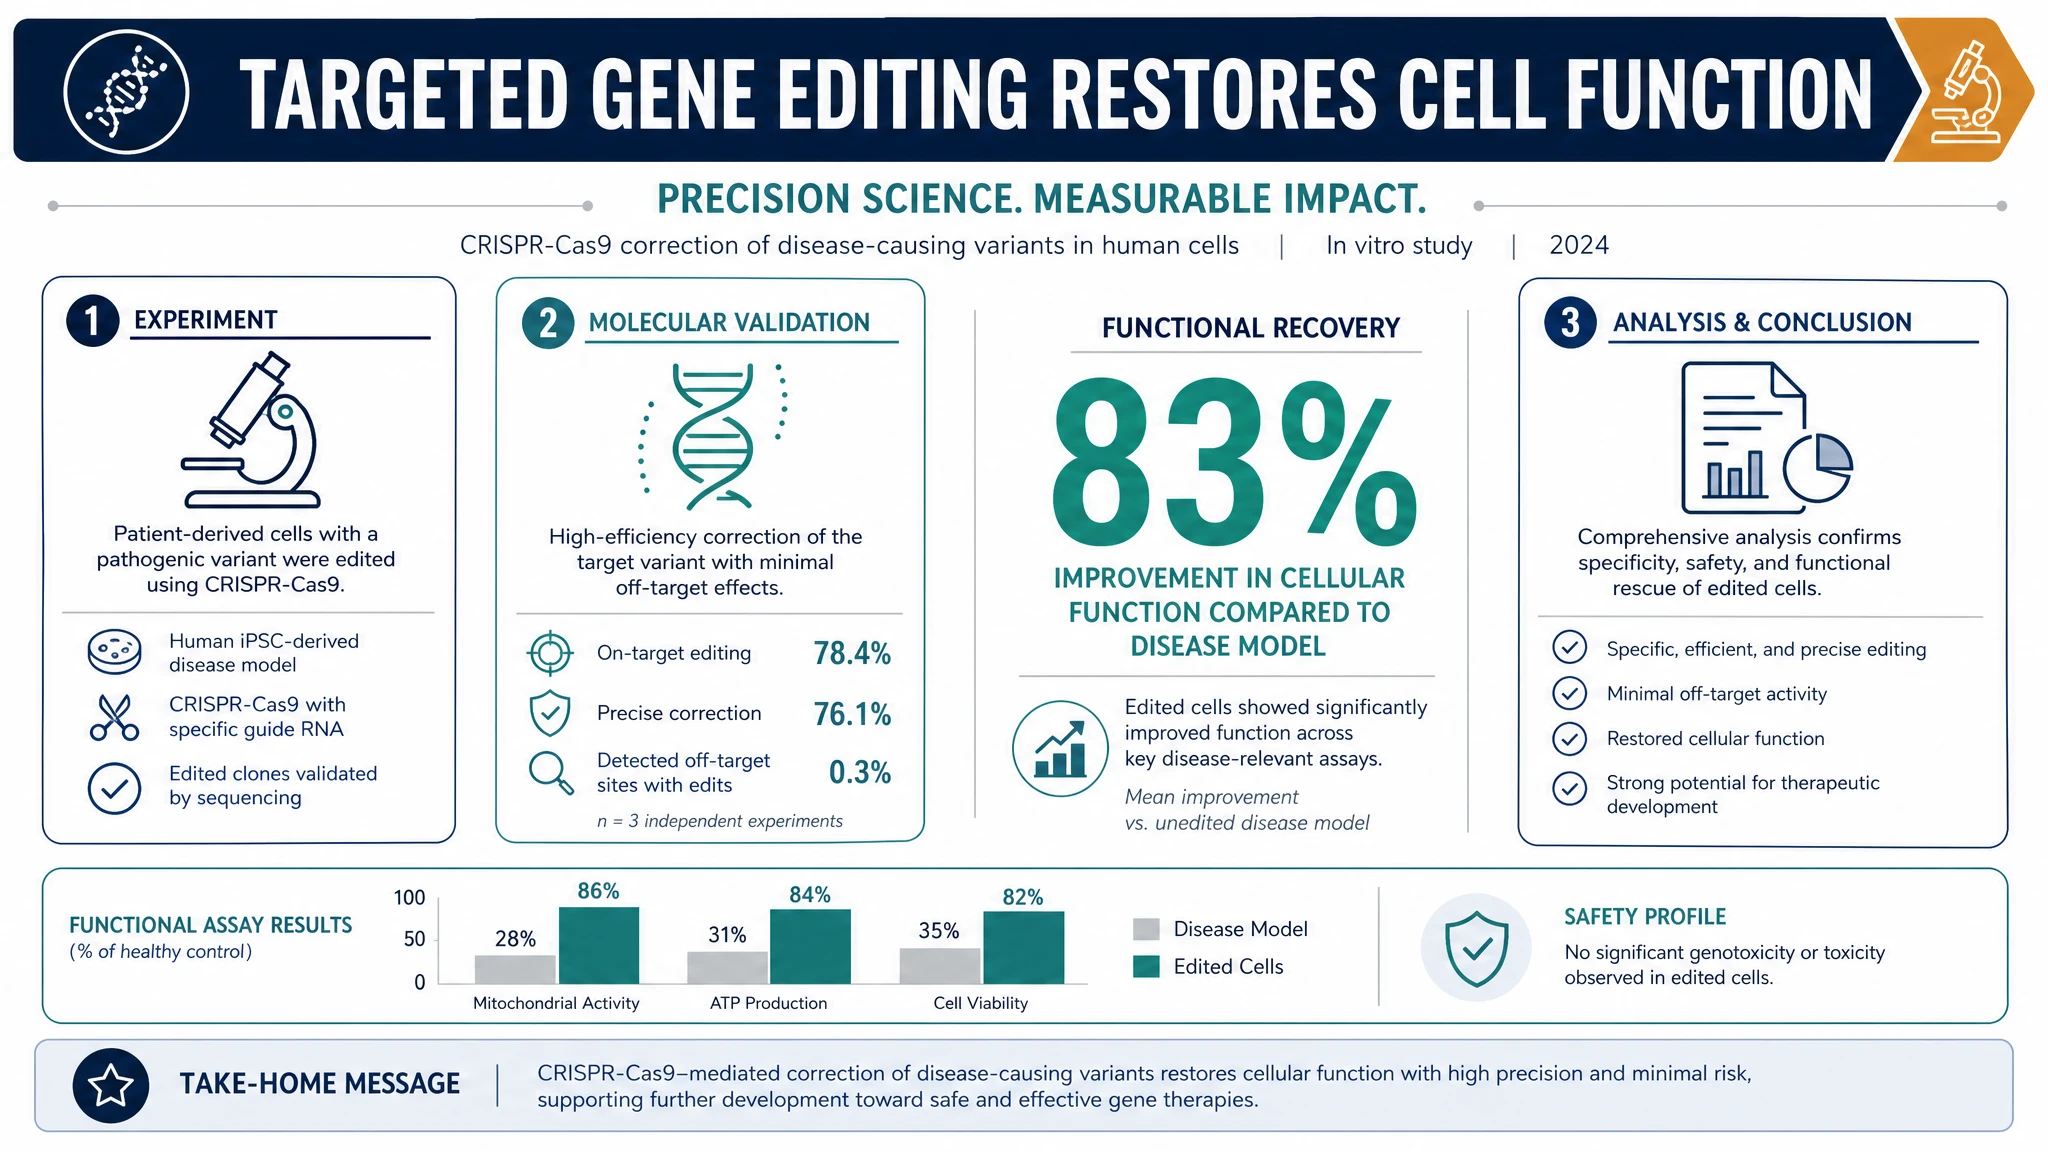
How Researchers Use the Timeline Generator

My seminar compared discoveries separated by very different intervals. I used the timeline generator to scale the spacing between discoveries to the elapsed time, then checked where the middle dates fell. The exported SVG gave the class a clear reference for discussing the long gaps as well as the crowded periods.

Eleanor Hughes

History of science lecturer, University of Leeds

Free tools

A tool for every scientific figure

110 focused generators for the scientific figure you need — each opens in the right workspace with a matching example.

Proportional Timeline Questions

1.

2.

3.

4.

5.

6.

Call to action background

Dates to a figure

Create a Timeline with Proportional Spacing

Build your timeline

Free to start · No credit card required · Built for researchers