SciFig

Free Phospholipid Diagram Generator

Draw a phospholipid molecule or bilayer with hydrophilic heads and hydrophobic tails. Choose labels and tail shapes, then export SVG or PNG.

Describe what you need in the box above.

Start with up to 150 free credits|No credit card required

Get up to 350 free credits on day one when you join through an invite.

3 figure engines · 500+ templatesEvery label editable · 60+ color schemesEditable PPTX · Layered SVG · 8K PNG / JPG

Build a phospholipid diagram

Choose a molecule or bilayer, set the tail shape and label display, and download your diagram.

Diagram view
Tail shape

Free Phospholipid Diagram Generator— templates & examples

Updated

Phospholipid structure diagrams

Free Phospholipid Diagram Generator

Explain phospholipid heads, tails and bilayers with a diagram you can edit and download.

SciFig’s phospholipid diagram generator helps you draw a single phospholipid and see how the same head-and-tail structure forms a bilayer. Choose one molecule or two opposing rows, change the tail shape and set the number of molecules in each layer. The heads face the water on either side while the tails point inward. Keep labels visible for explanation or hide them for practice, then export SVG or PNG and save the settings for another lesson or revision.

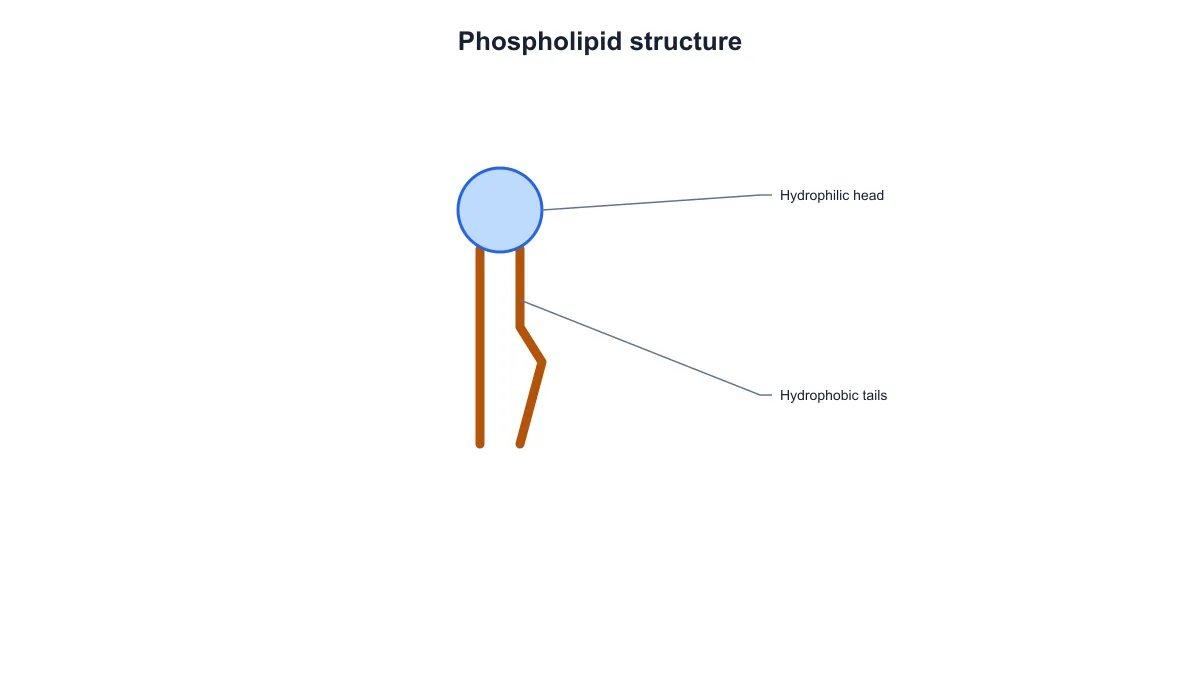
Labeled phospholipid schematic with one hydrophilic head and two hydrophobic tails, including one kinked tail
  • Choose one molecule or a bilayer
  • Set the tail shape and molecule count
  • Show labels or make an exercise
  • Export SVG, PNG and saved settings

Phospholipid Diagram Generator Features

Build a focused molecule or bilayer figure from controls that match the structure you want to explain.

Start with one phospholipid

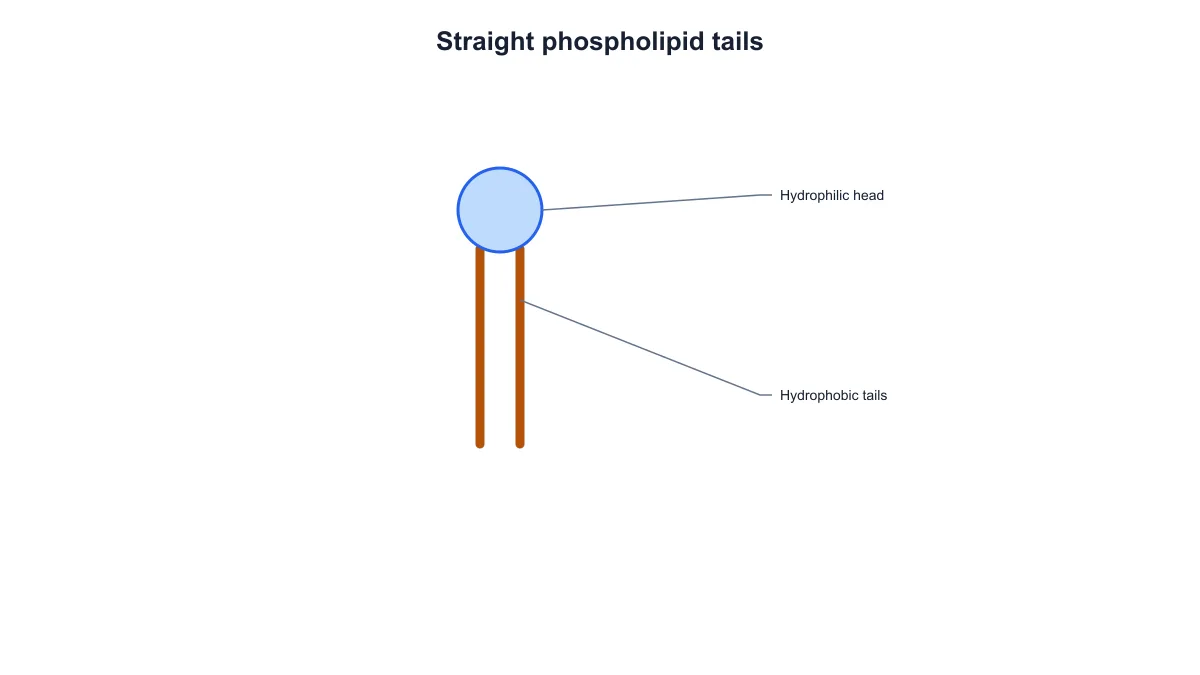
SciFig’s phospholipid diagram generator starts with the familiar head-and-two-tails schematic. The round head represents the hydrophilic region, while the two tails represent the hydrophobic region. Use the single-molecule view when you want students or an audience to identify those parts before looking at a membrane. Set a title that connects the drawing to the topic of your lesson, handout or research presentation.

  • Show one head and two tails
  • Keep the two regions distinct
  • Set a task-specific title
Try this in SciFig

Arrange two opposing lipid layers

Switch to the bilayer view to show two rows of phospholipids. SciFig places the heads toward the water on both sides and directs the tails toward the middle. Choose three to ten molecules in each layer to match the amount of detail you need. The paired rows make it easier to explain how the structure of an individual phospholipid relates to the arrangement of a lipid bilayer.

  • Show two opposing rows
  • Choose molecules per layer
  • Keep heads out and tails in
Try this in SciFig

Choose tail shapes and labels

Compare a diagram with two straight tails against one with a kinked tail. The bent-tail schematic is useful when introducing the shape of a cis-unsaturated fatty acid tail. Keep the head and tail labels visible while explaining the drawing, or hide them to prepare a labeling exercise. SciFig retains the structure and leader lines when the text is hidden, so the exercise can use the same figure as its reference.

  • Compare straight and kinked tails
  • Show or hide structure labels
  • Keep leader lines for practice
Try this in SciFig

Download figures and keep settings

Download your phospholipid diagram as SVG for further vector editing or PNG for a worksheet, document or slide. Save JSON settings to keep the selected view, molecule count, tail shape, title and label display together. Reopen that file when preparing another version of the same figure. SciFig AI Illustration (AI scientific illustration) also helps you create larger biological scenes when the phospholipids need to appear alongside other membrane components.

  • Export SVG or PNG
  • Save and restore diagram settings
  • Continue a larger scientific illustration
Try this in SciFig

How to Make a Phospholipid Diagram

Choose the view, adjust the structure and export a diagram that fits your explanation.

  1. Choose a molecule or bilayer

    Start with a single phospholipid to explain the head and tails, or switch to a bilayer to show their arrangement in two layers. The preview updates when you change the view.

  2. Set the tail shape and molecule count

    Choose two straight tails or one kinked tail. In bilayer view, select three to ten molecules for each layer. Check that the density and tail shape support the concept you want to show.

  3. Add the title and choose labels

    Enter a title for the figure. Keep the hydrophilic-head and hydrophobic-tail labels visible for explanation, or turn them off to prepare a labeling exercise with the same drawing and leader lines.

  4. Download and save your diagram

    Export SVG or PNG for your lesson, report or presentation. Save the JSON settings beside the figure so you can reopen and revise the same view, title, labels and structure choices later.

Phospholipid Diagrams for Teaching and Research

Use a clear head-and-tail schematic when the explanation needs a focused view of a molecule or bilayer.

Labeled phospholipid schematic with one hydrophilic head and two hydrophobic tails, including one kinked tail

Introduce the parts of a phospholipid

Show a single phospholipid before introducing the complete membrane. Use the head and tail labels to connect the drawing with hydrophilic and hydrophobic behavior. The phospholipid diagram generator provides a focused figure for a biology lesson, a revision handout or the opening slide of a membrane-related presentation.

Explore this example
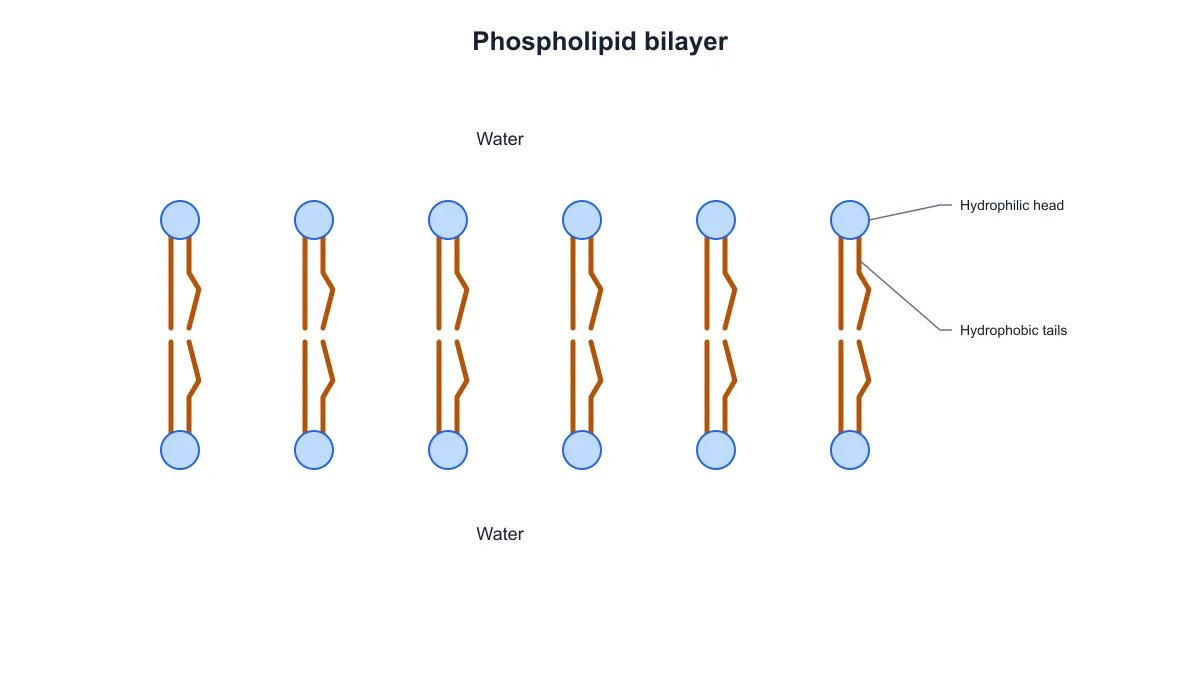
Phospholipid bilayer with twelve molecules, heads facing water and tails pointing toward the center

Explain the arrangement of a bilayer

Switch to two opposing layers to show why the head groups face the watery environments on both sides. Follow the tails toward the central region of the drawing. Choose the number of molecules per row so the exported phospholipid bilayer diagram has the detail your explanation needs.

Explore this example
Single phospholipid schematic with two straight hydrophobic tails and a labeled hydrophilic head

Compare straight and kinked tails

Prepare two figures with the same view and title, then change the tail shape in one of them. Use the pair when introducing straight saturated tails and the bend associated with a cis-unsaturated tail. The diagrams give the audience a visible shape comparison while you explain the underlying chemistry.

Explore this example
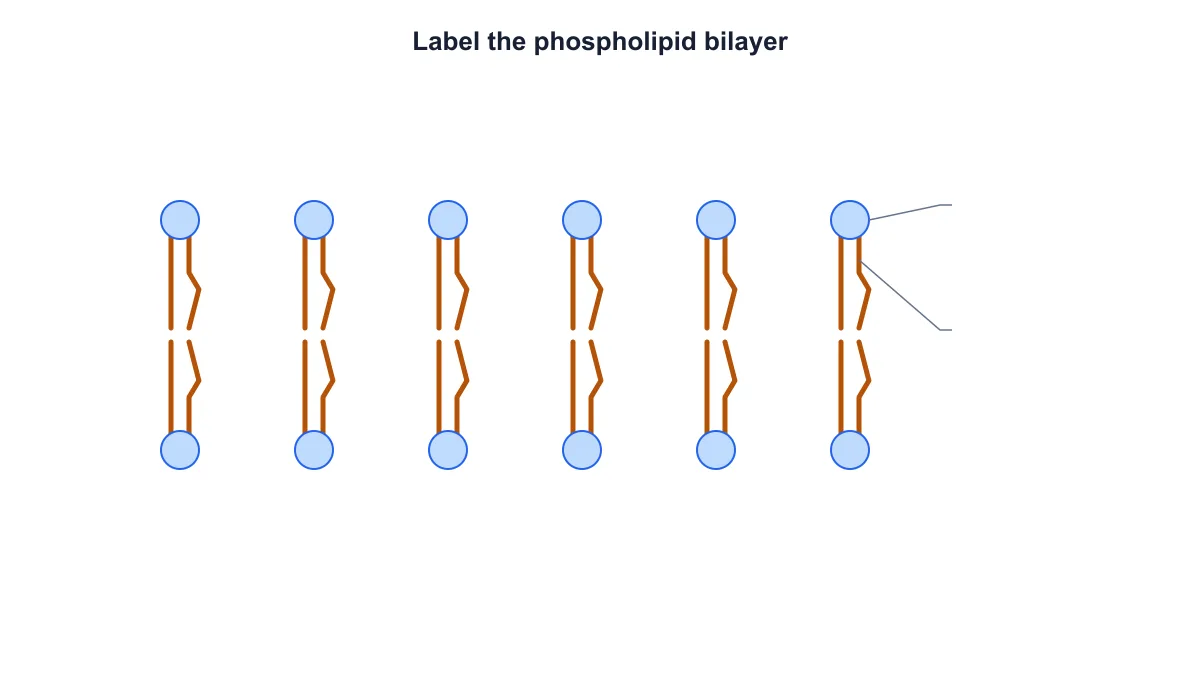
Unlabeled phospholipid bilayer preserving the head shapes, paired tails and leader lines for a worksheet

Create a membrane labeling exercise

Hide the labels to prepare a bilayer figure for a student exercise. The drawing keeps the head shapes, paired tails and leader lines, so students can identify the regions themselves. Save the settings and turn labels back on when preparing the answer sheet from the same structure.

Explore this example
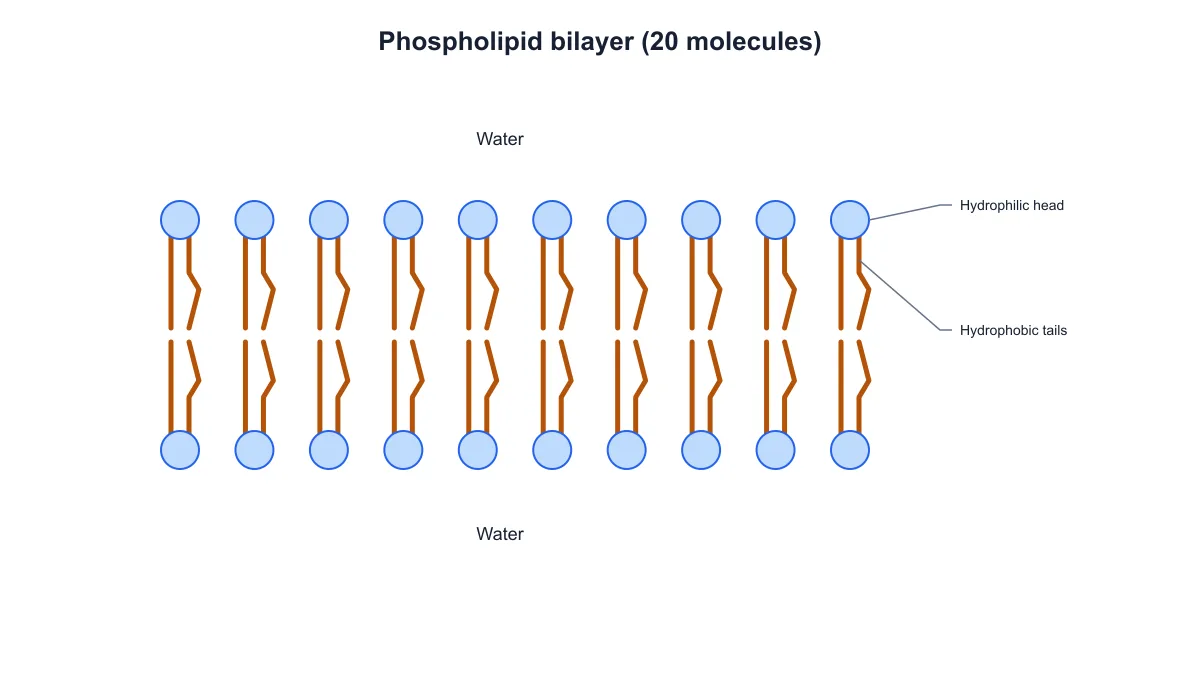
Phospholipid bilayer containing twenty molecules arranged in two opposing rows with head and tail labels

Match the detail to your lesson

Use a smaller number of molecules for an introductory slide and more molecules when discussing the repeated arrangement across a membrane. The phospholipid diagram generator keeps the opposing directions consistent as you change the count. Export the version that fits the space and teaching focus of your material.

Explore this example
Labeled phospholipid schematic with one hydrophilic head and two hydrophobic tails, including one kinked tail

Prepare an editable figure for a report

Create a phospholipid schematic for a report, research overview or seminar about membranes. Choose SVG when you want to continue editing the figure in a vector editor, or PNG when you want to place it directly in a document. Keep the settings file with the report for later revisions.

Explore this example
How Researchers Use SciFig
I wanted to explain one phospholipid before showing a full membrane diagram. The phospholipid diagram generator let me start with the head and tails, then switch to the bilayer without changing the visual style. I exported both figures for the lesson and saved the settings with my teaching materials.
Amelia S.

Biology teacher, St Paul’s Girls’ School

Free tools

A tool for every scientific figure

110 focused generators for the scientific figure you need — each opens in the right workspace with a matching example.

Phospholipid Diagram Questions

1.

2.

3.

4.

5.

6.

Call to action background

Phospholipid structure diagrams

Create your phospholipid diagram

Create a phospholipid diagram

Free to start · No credit card required · Built for researchers