Scientific Color Palette Generator
Generate scientific color palettes that are colorblind-friendly, journal-approved, and ready to apply — with hex codes for every color in your chart or diagram.
Figure prompt
Core Subject (e.g., Cas9 protein cutting DNA)
Action / Details (e.g., Double strand break, detailed molecular view)
Start with 100 free credits|No credit card required
Get up to 300 free credits on day one when you join through an invite.
Reviewed by SciFig TeamUpdated
Scientific Color Palette Generator— templates & examples
Everything you need to choose the right scientific color palette
Generate a palette matched to your figure type and data structure
Describe your figure — bar chart, line plot, scatter plot, heatmap, or diagram — the number of categories or data series, and whether the data is categorical, sequential, or diverging. SciFig's scientific color palette generator selects the appropriate palette type and produces hex codes for each color, calibrated for perceptual distinctness and journal figure standards.
Built-in colorblind and daltonic-friendly verification
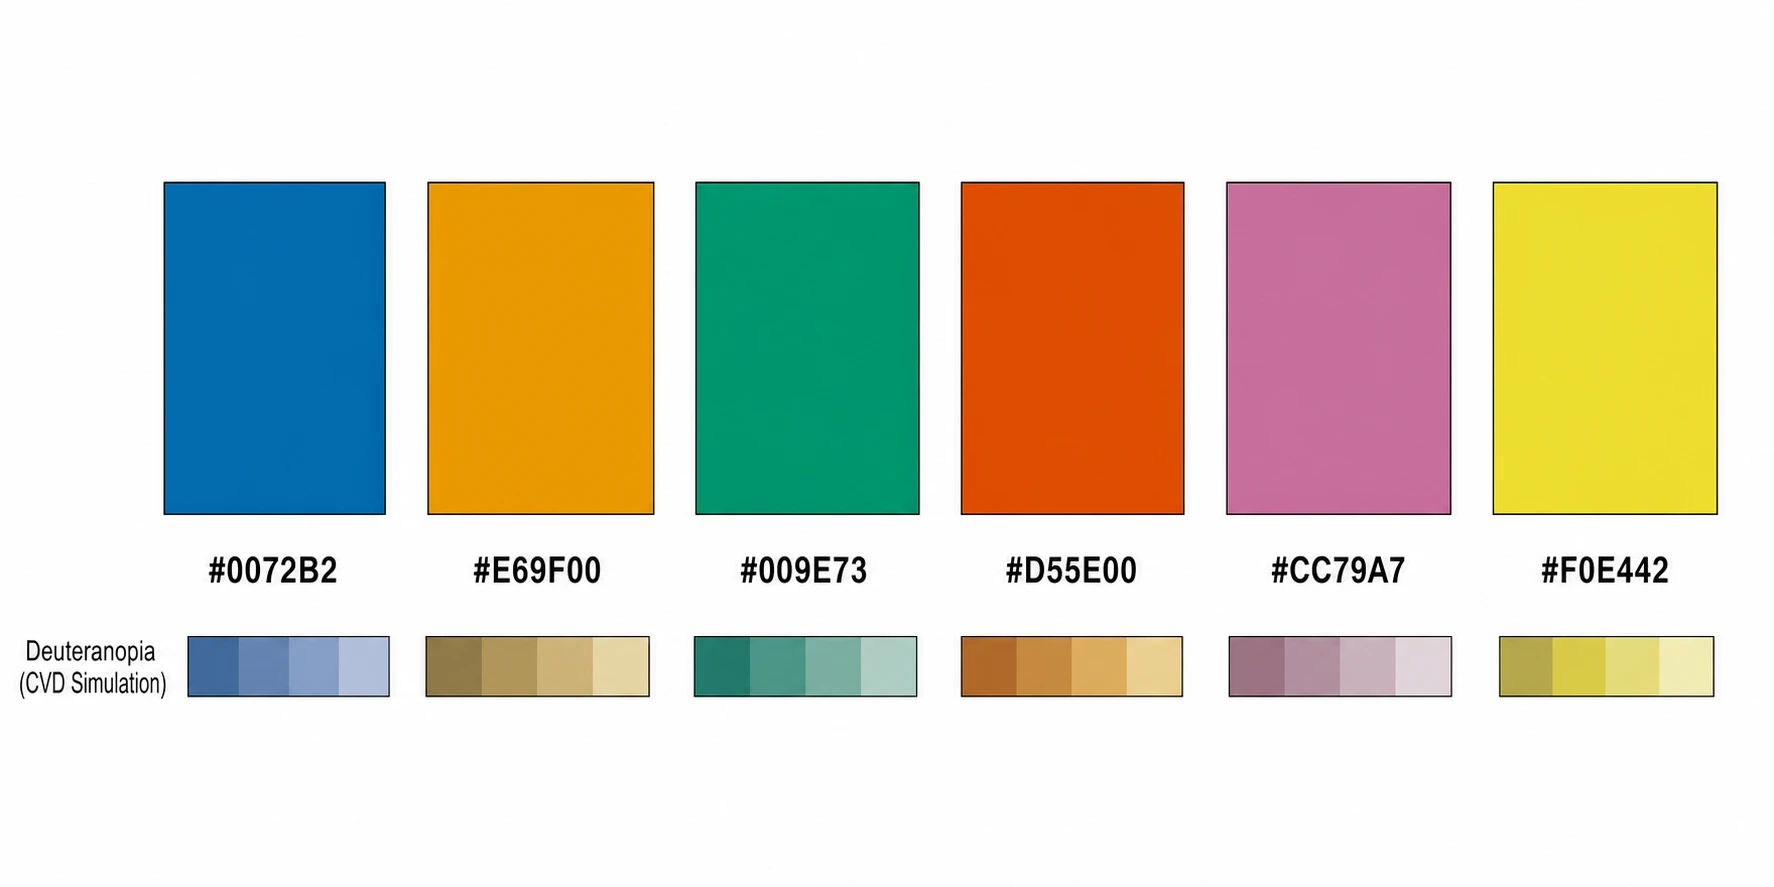
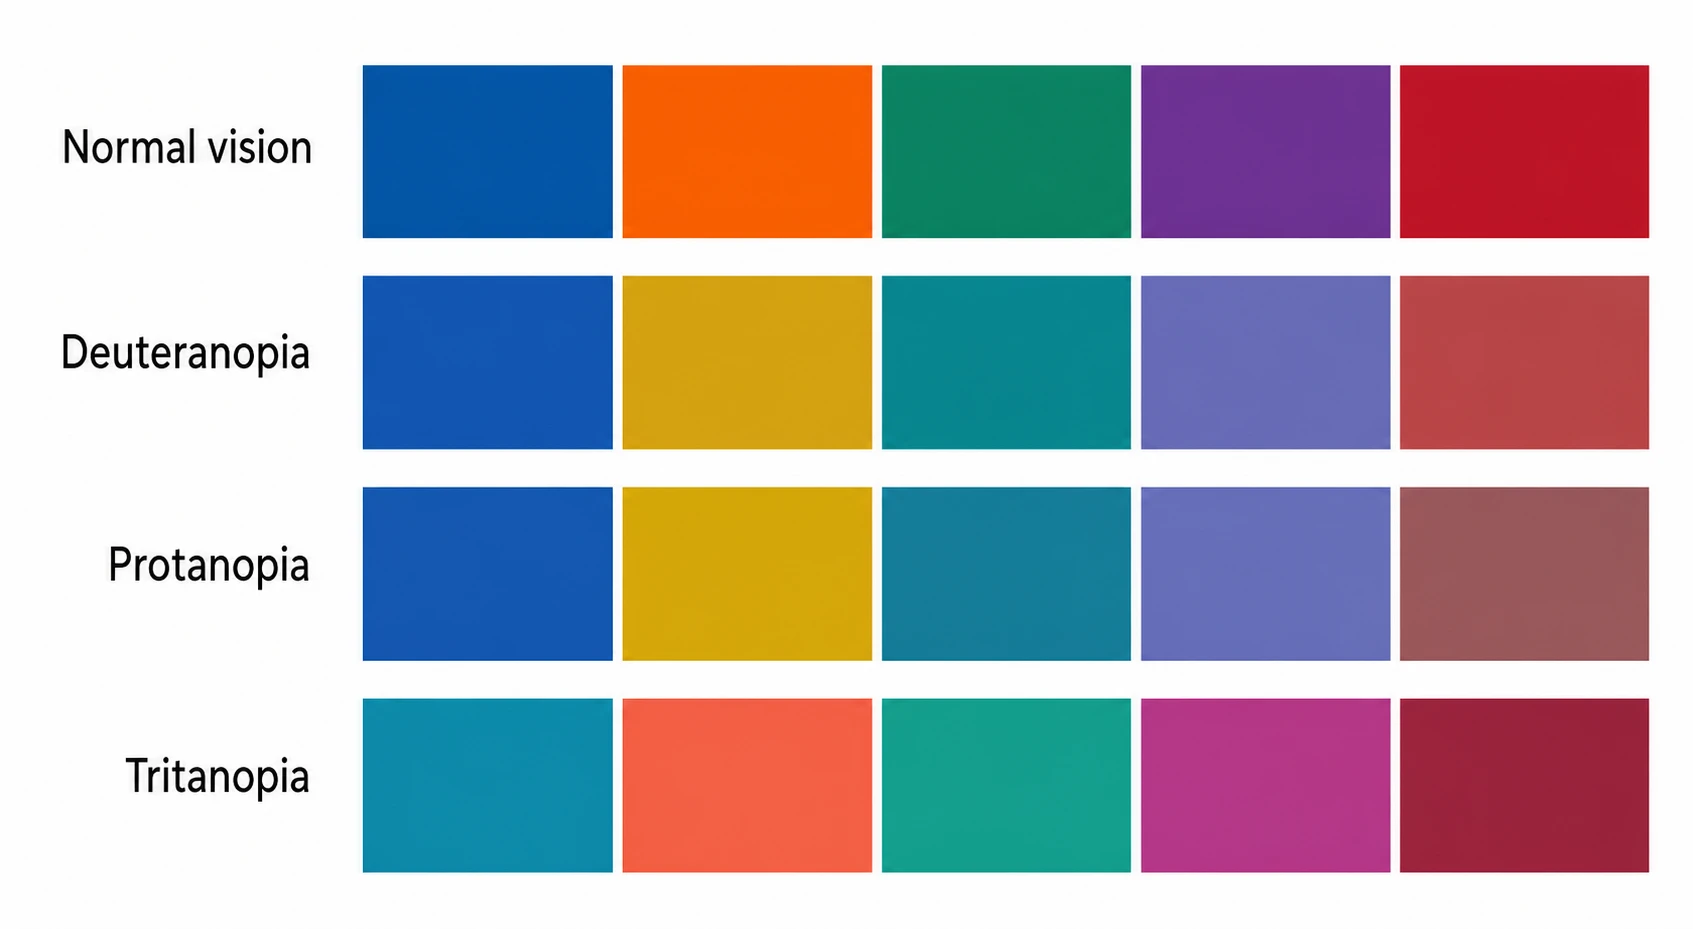
Every scientific palette generated by SciFig is tested against deuteranopia, protanopia, and tritanopia simulations before it is delivered. If any colors are indistinguishable under a common color vision deficiency, the generator adjusts the palette automatically — so you always receive a colorblind-friendly palette for science that is ready to use without further testing.
Nature journal palettes and publication-standard hex codes
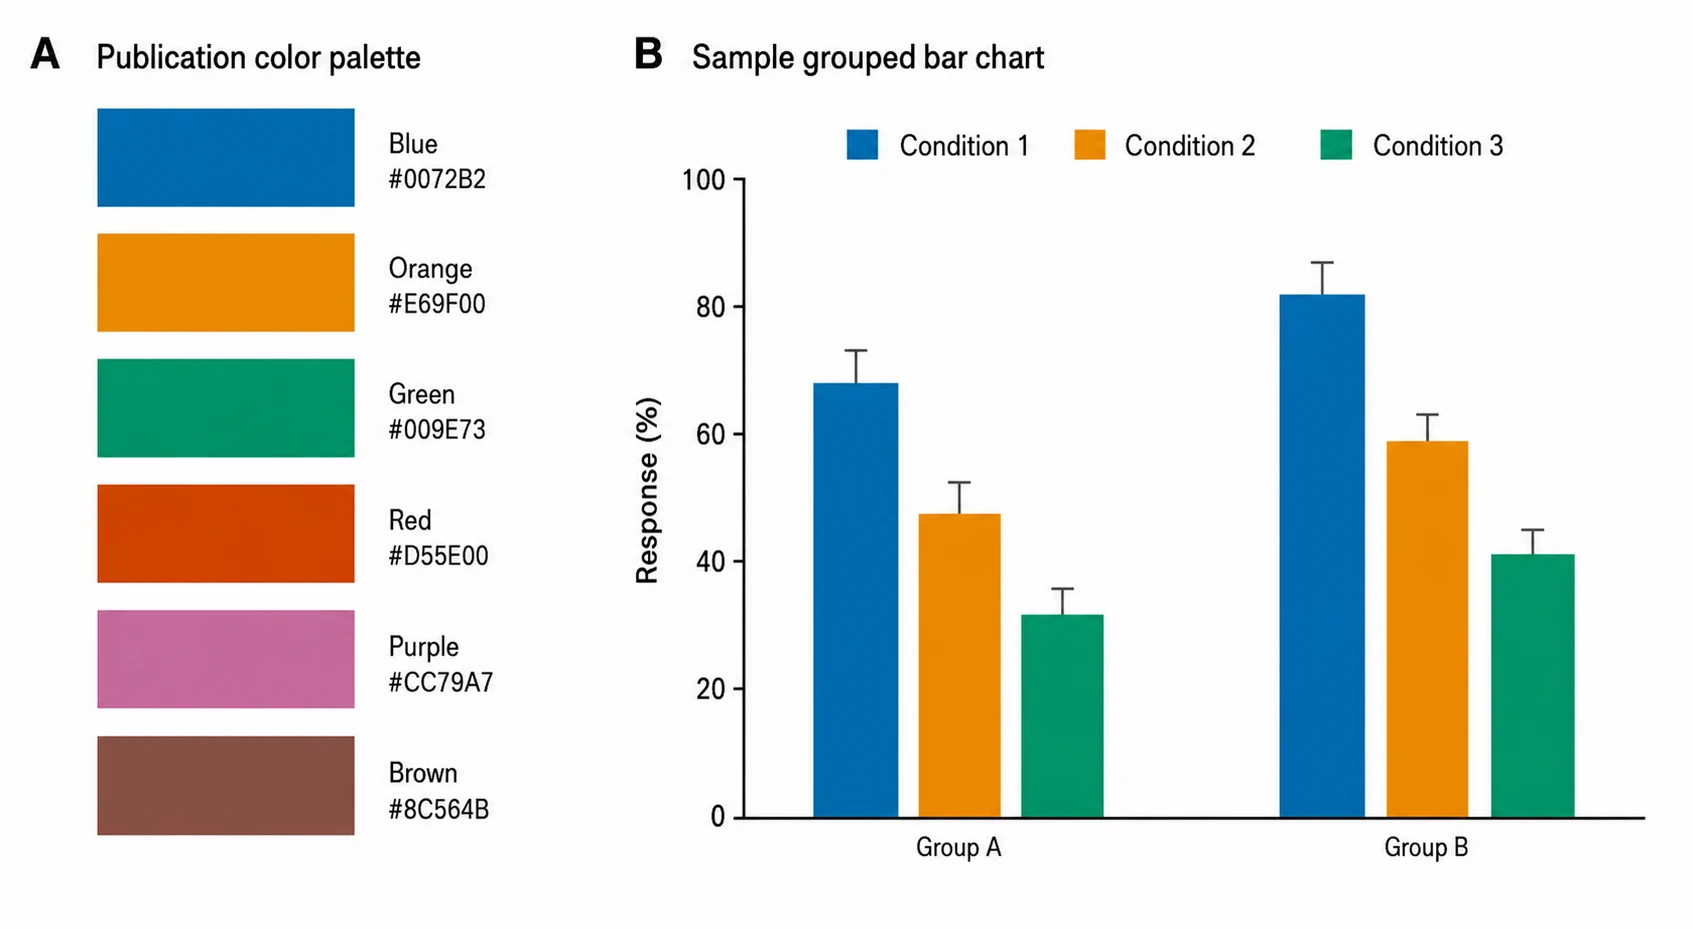
Access scientific palettes aligned with Nature journal color standards and other leading publication guidelines, complete with hex codes ready to paste into any figure creation tool. Apply the same palette for scientific diagrams across all figures in your manuscript to maintain visual consistency, or generate a custom palette that matches your institution's style guide.
What is a scientific color palette?
A scientific color palette is a curated set of colors chosen to be perceptually distinct, accessible to color-vision-deficient readers, and consistent with publication standards — poor choices cause misinterpretation and are flagged by reviewers. Palettes span qualitative, sequential, and diverging types for categorical, ordered, and bipolar data. With SciFig's scientific color palette generator you describe your figure type and receive hex codes verified for colorblind safety.
Why choosing the right scientific color palette matters
- Colorblind-inaccessible figures are increasingly flagged by journal reviewers and editors
- An estimated 8% of male readers cannot distinguish red-green color combinations
- Perceptually non-uniform palettes introduce visual bias — some categories appear more important than others
- Figures that rely on color alone fail when printed in grayscale or viewed on low-contrast screens
- Consistent scientific palettes across figures in a manuscript improve readability and professional presentation
- Nature, Science, and PLOS journals explicitly recommend colorblind-accessible palettes in their figure guidelines
Key properties of a good scientific color palette
- Perceptual distinctness — all colors in the palette are easily told apart under normal vision
- Colorblind safety — colors remain distinguishable under deuteranopia, protanopia, and tritanopia
- Grayscale legibility — the palette retains sufficient luminance contrast when printed without color
- Palette type match — qualitative for categories, sequential for ordered data, diverging for bipolar data
- Hex code precision — exact color values reproducible across any figure creation software
- Appropriate palette size — enough colors for your data series without overcrowding the visual field
Where scientific color palettes are used in research figures
- Multi-series line plots and scatter plots distinguishing experimental conditions or groups
- Bar and grouped bar charts comparing categorical outcomes across conditions
- Heatmap color scales for expression data, correlation matrices, and spatial maps
- Network and pathway diagrams color-coding node categories or edge types
- Flow diagrams and Sankey charts distinguishing material or energy stream types
- Scientific illustration and diagram color schemes for publication figures and posters
How to make a scientific color palette
Describe your scientific color palette
Tell SciFig what to draw in plain language — no design tools required.
Generate with SciFig
Get a clean, publication-ready figure that matches your description in seconds.
Edit & export
Vectorize it into editable SVG, relabel everything, and export for your paper, poster, or slides.
Scientific Color Palette Generator — Frequently Asked Questions
Common questions about Scientific Color Palette Generator.
More tools

Conceptual Framework Generator
Create professional conceptual framework diagrams showing variable relationships, hypotheses, and theoretical models for your research.

Free Body Diagram Generator
Create accurate, publication-ready free body diagrams with labeled force vectors for weight, normal force, friction, and tension in seconds.

Bell Curve Generator
Generate a precise, fully labeled bell curve showing mean, standard deviations, and percentile regions — ready to export for your paper, thesis, or classroom.
Related links
Home
Turn text, sketches, references, PDFs, and photos into Scientific Figures
Text-to-Figure
Generate a figure from a plain-language description
Models
Default to GPT Image 2 for journal papers; switch to Nano Banana Pro for slides and posters; pick Nano Banana 2 for routine figure work
Tutorials
Seven short walkthroughs of the AI scientific figure generator
Blog
Tutorials, tool comparisons, and publication tips for researchers.
Inspiration
Explore publication-ready scientific figure examples, copy the prompts, and use them as starting points for your own work.

Ready to publish?
Make your own scientific color palette in minutes.
Start for freeFree to start · No credit card required · Built for researchers