State Diagram Generator
Create clear state diagrams showing states, transitions, guards, and initial and final states with SciFig's AI state diagram maker.
Figure prompt
Core Subject (e.g., Cas9 protein cutting DNA)
Action / Details (e.g., Double strand break, detailed molecular view)
Start with 100 free credits|No credit card required
Get up to 300 free credits on day one when you join through an invite.
Reviewed by SciFig TeamUpdated
State Diagram Generator— templates & examples
Everything you need to create a publication-ready state diagram
States, transitions, and guards from plain language
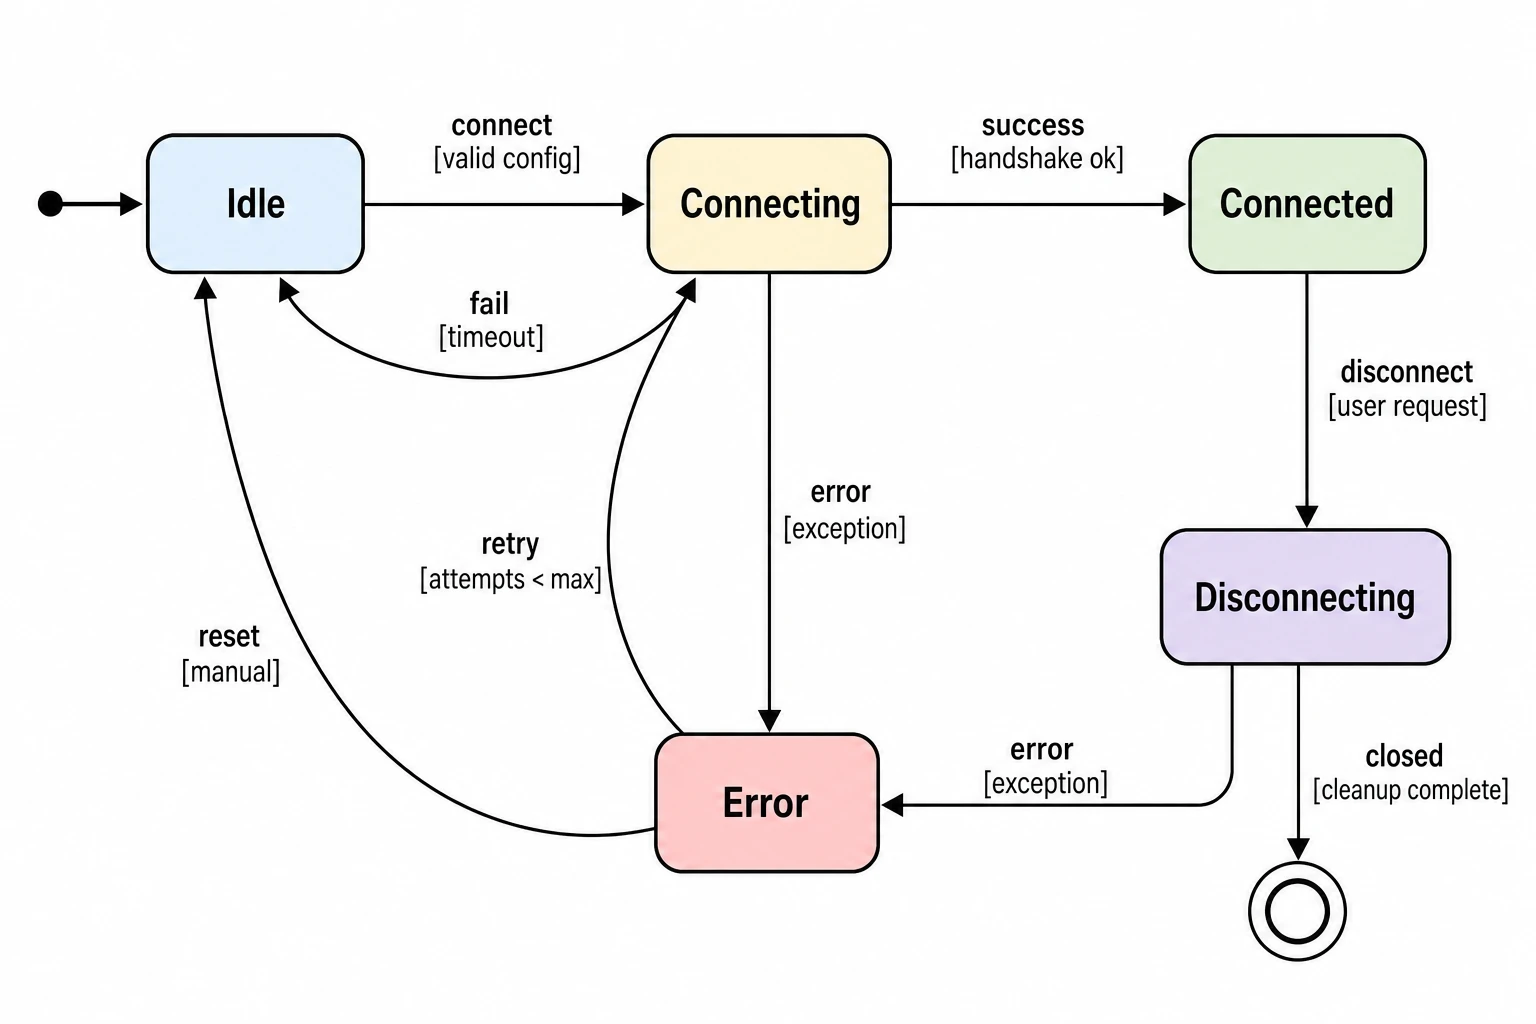
Describe your system's states and the events that trigger transitions between them in natural language, and SciFig's state diagram maker renders a complete finite state machine diagram with labeled circles, directed arrows, and correctly formatted event-guard-action labels. Initial states are marked with an entry arrow, final states with double circles, and all transitions carry the notation that computer science and software engineering publications expect.
Full editing support for complex state machines
SciFig's state chart maker keeps every generated state diagram fully editable. Add states, modify transition labels, introduce guard conditions, or restructure the layout after generation. The state diagram generator is built for iterative design — refine your finite state machine model through multiple cycles as your protocol specification or system design evolves, then export a final figure at publication resolution.
Built for computer science and engineering research papers
From protocol behavior documentation in networking papers to UML statechart figures in software engineering theses to automaton diagrams in formal methods research, SciFig's state diagram maker produces figures to the visual standard that IEEE, ACM, and Springer reviewers expect. Export high-resolution state diagrams for journal articles, conference papers, or technical reports — with clean line weights, readable state labels, and clearly curved self-loop transitions.
What is a state diagram?
A state diagram is a formal visual model of a system's possible states and the transitions between them — also called a finite state machine (FSM) diagram — showing named states as labeled circles connected by directed transition arrows with triggering event and guard labels. With SciFig's state diagram maker you describe your states and transitions in plain language and receive a clean, labeled state diagram you can edit and export for computer science, protocol, and embedded systems research.
Why state diagrams are essential technical figures
- Precisely document system behavior without requiring readers to trace source code
- Required in computer science and software engineering papers describing reactive systems
- Communicate protocol specifications and firmware lifecycle models unambiguously
- Make all possible system states and the events that cause transitions immediately visible
- Serve as the authoritative behavioral specification in formal methods and verification research
- Enable peer reproducibility by providing a complete model of system state transitions
Key elements of a state diagram
- States — labeled circles or rounded rectangles representing distinct modes or conditions the system occupies
- Initial state — marked by an incoming unlabeled arrow, indicating the state the system starts in
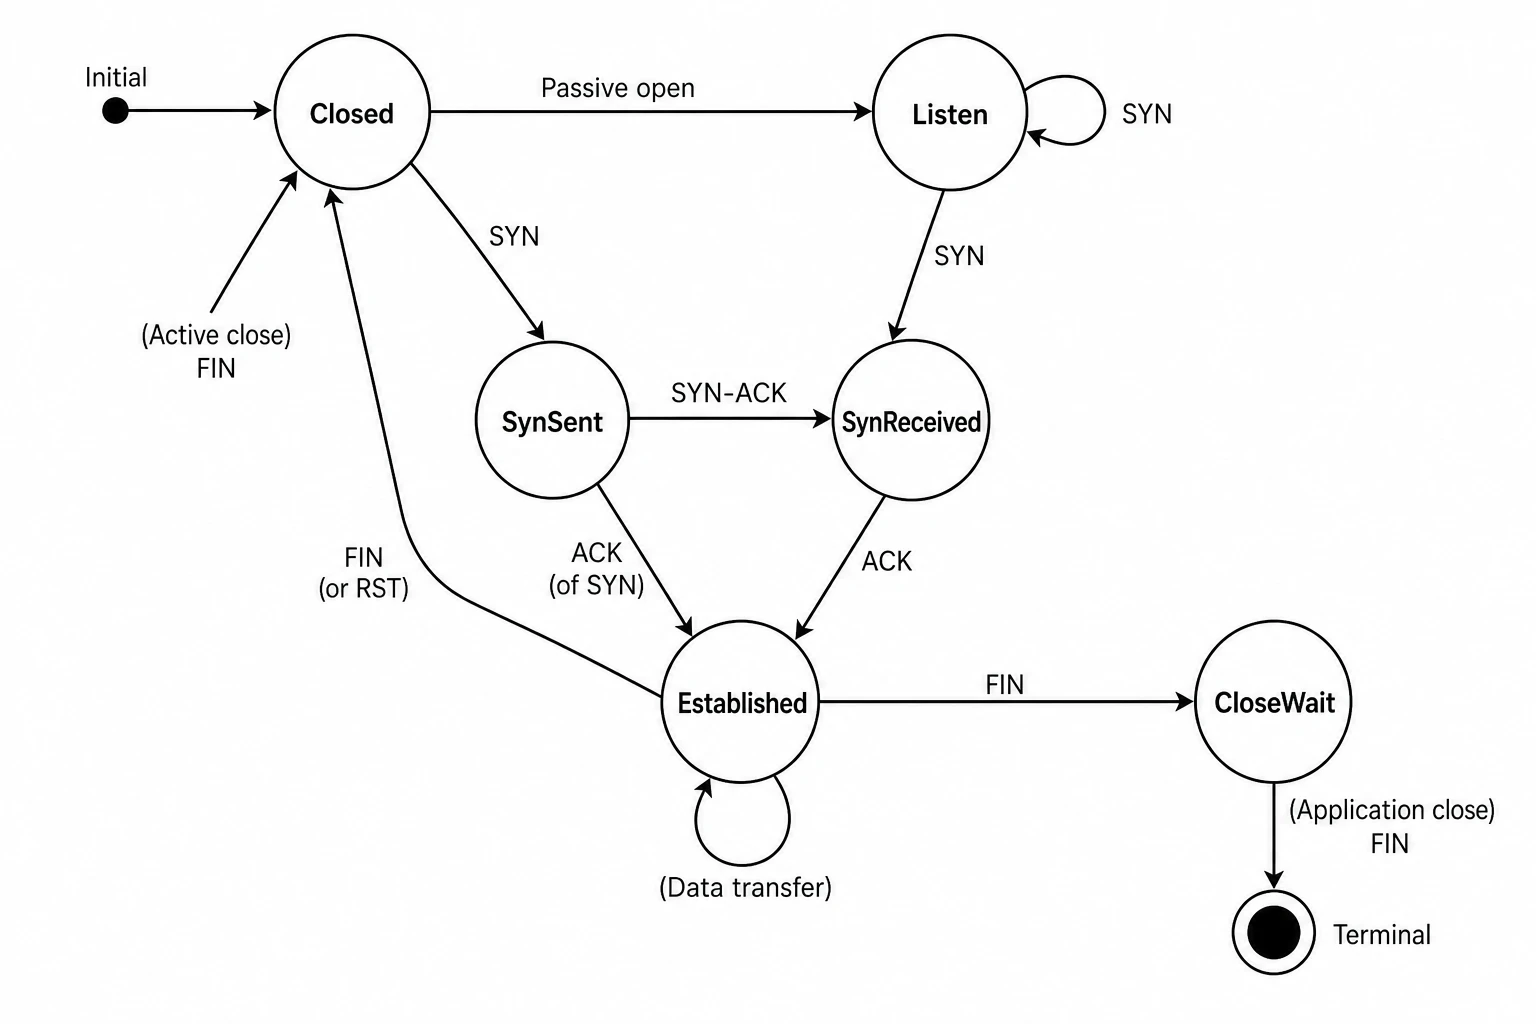
- Final states — drawn as double circles, indicating terminal or accepting states in finite automata
- Transitions — directed arrows between states labeled with triggering event, optional guard condition, and optional action
- Self-loops — transitions where source and target are the same state, shown as curved arrows returning to the same node
- Guard conditions — Boolean expressions in square brackets on transition labels that must be true for the transition to fire
Where state diagrams appear in research and documentation
- Network protocol papers documenting TCP, UDP, HTTP, and custom communication state machines
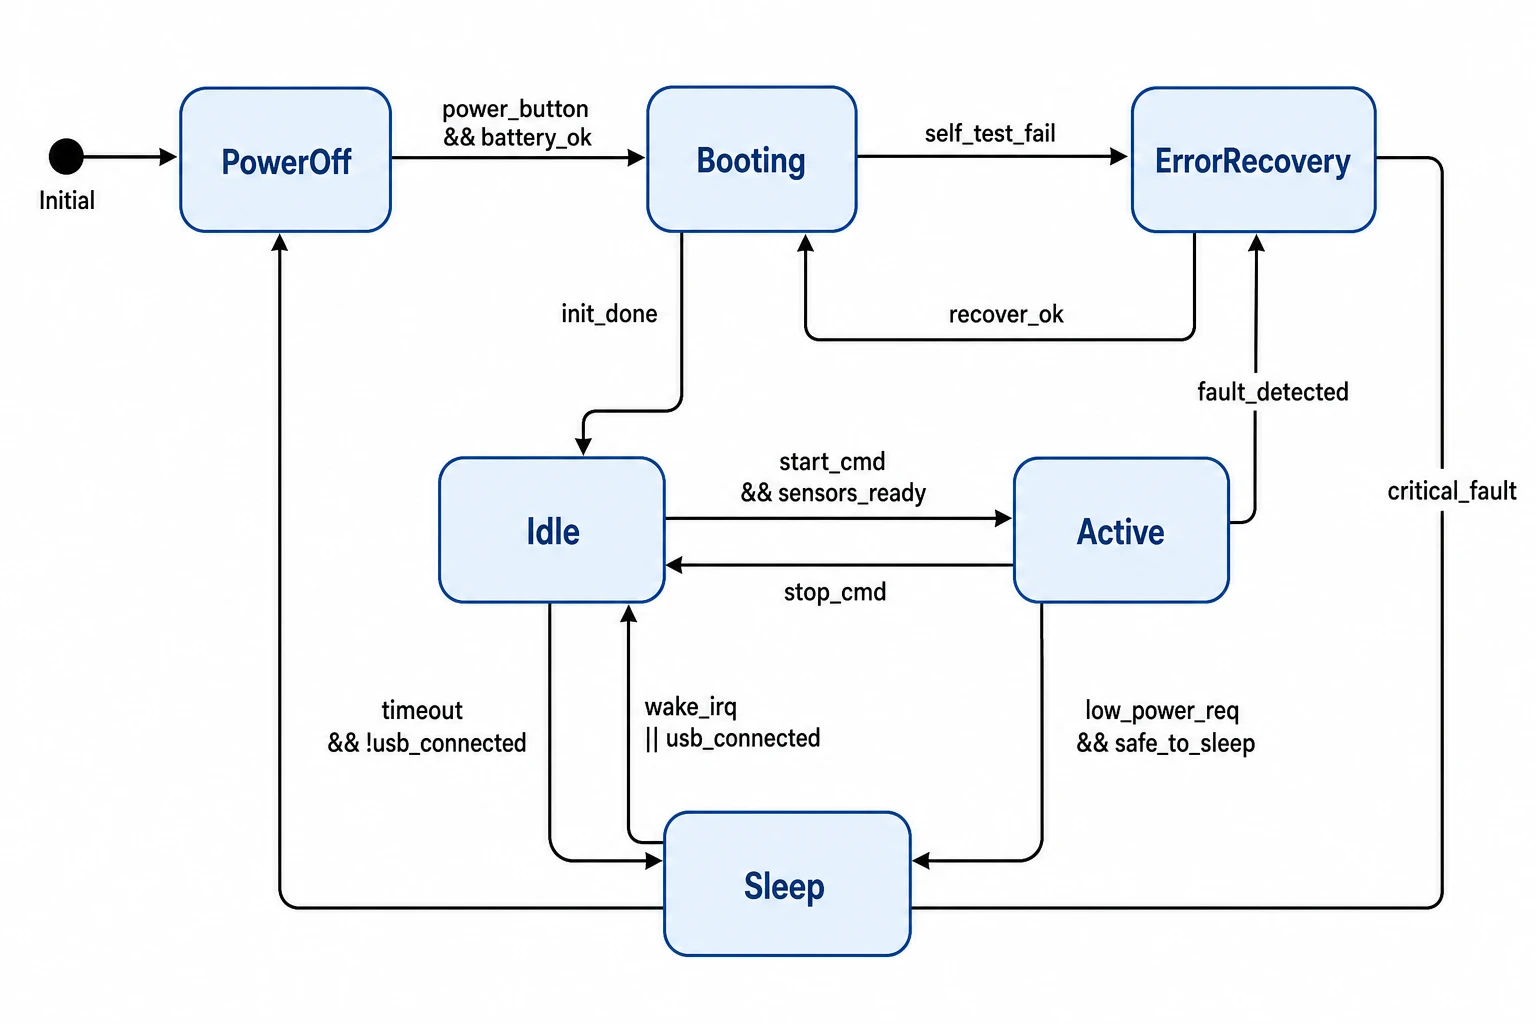
- Embedded systems and firmware research showing device operating modes and power state transitions
- Software engineering papers using UML statechart notation to specify object or component behavior
- Formal methods research specifying and verifying concurrent and reactive system behavior
- Natural language processing papers illustrating finite automata for tokenization and pattern recognition
- Human-computer interaction papers modeling user interface state transitions and navigation flows
How to make a state diagram
Describe your state diagram
Tell SciFig what to draw in plain language — no design tools required.
Generate with SciFig
Get a clean, publication-ready figure that matches your description in seconds.
Edit & export
Vectorize it into editable SVG, relabel everything, and export for your paper, poster, or slides.
State Diagram Generator — Frequently Asked Questions
Common questions about State Diagram Generator.
More tools

Conceptual Framework Generator
Create professional conceptual framework diagrams showing variable relationships, hypotheses, and theoretical models for your research.

Free Body Diagram Generator
Create accurate, publication-ready free body diagrams with labeled force vectors for weight, normal force, friction, and tension in seconds.

Bell Curve Generator
Generate a precise, fully labeled bell curve showing mean, standard deviations, and percentile regions — ready to export for your paper, thesis, or classroom.
Related links
Home
Turn text, sketches, references, PDFs, and photos into Scientific Figures
Text-to-Figure
Generate a figure from a plain-language description
Models
Default to GPT Image 2 for journal papers; switch to Nano Banana Pro for slides and posters; pick Nano Banana 2 for routine figure work
Tutorials
Seven short walkthroughs of the AI scientific figure generator
Blog
Tutorials, tool comparisons, and publication tips for researchers.
Inspiration
Explore publication-ready scientific figure examples, copy the prompts, and use them as starting points for your own work.

Ready to publish?
Make your own state diagram in minutes.
Start for freeFree to start · No credit card required · Built for researchers