SciFig

Turn your process into a flowchart

Describe your methods or upload a PDF, Word file, or image — edit every node and arrow, export to SVG or PPTX.

Describe what you need in the box above.

Start with up to 150 free credits|No credit card required

Get up to 350 free credits on day one when you join through an invite.

3 figure engines · 500+ templatesEvery label editable · 60+ color schemesEditable PPTX · Layered SVG · 8K PNG / JPG

Free Context Diagram Generator for System Boundaries— templates & examples

Updated

system context diagram

Free Context Diagram Generator for System Boundaries

Make the system boundary and its external exchanges clear.

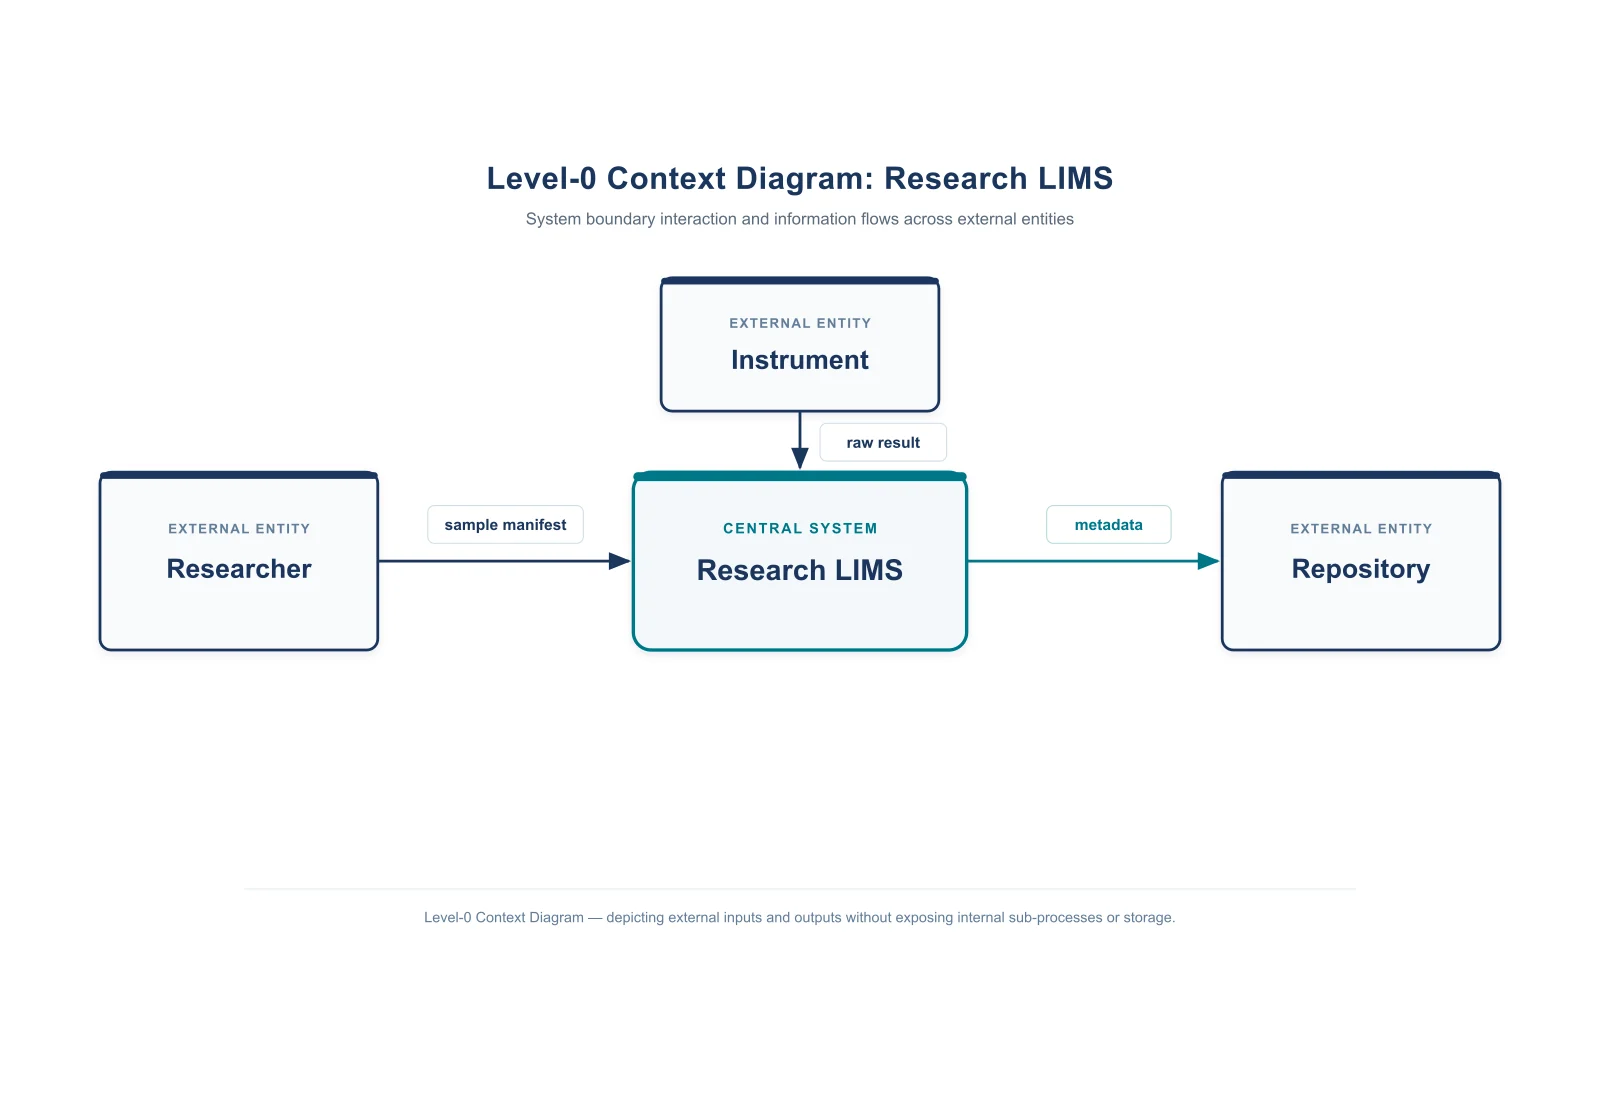
A context diagram generator shows the boundary of a system and the information it exchanges with external people, organizations or applications. SciFig uses FlowChart to turn your supplied system, external entities and labeled flows into an editable SVG. Keep the system as one central object, place the external roles around it and name what moves in each direction. A context diagram is useful before a detailed data flow diagram: it answers what belongs inside the boundary and what connects to the outside, without describing the internal processing steps.

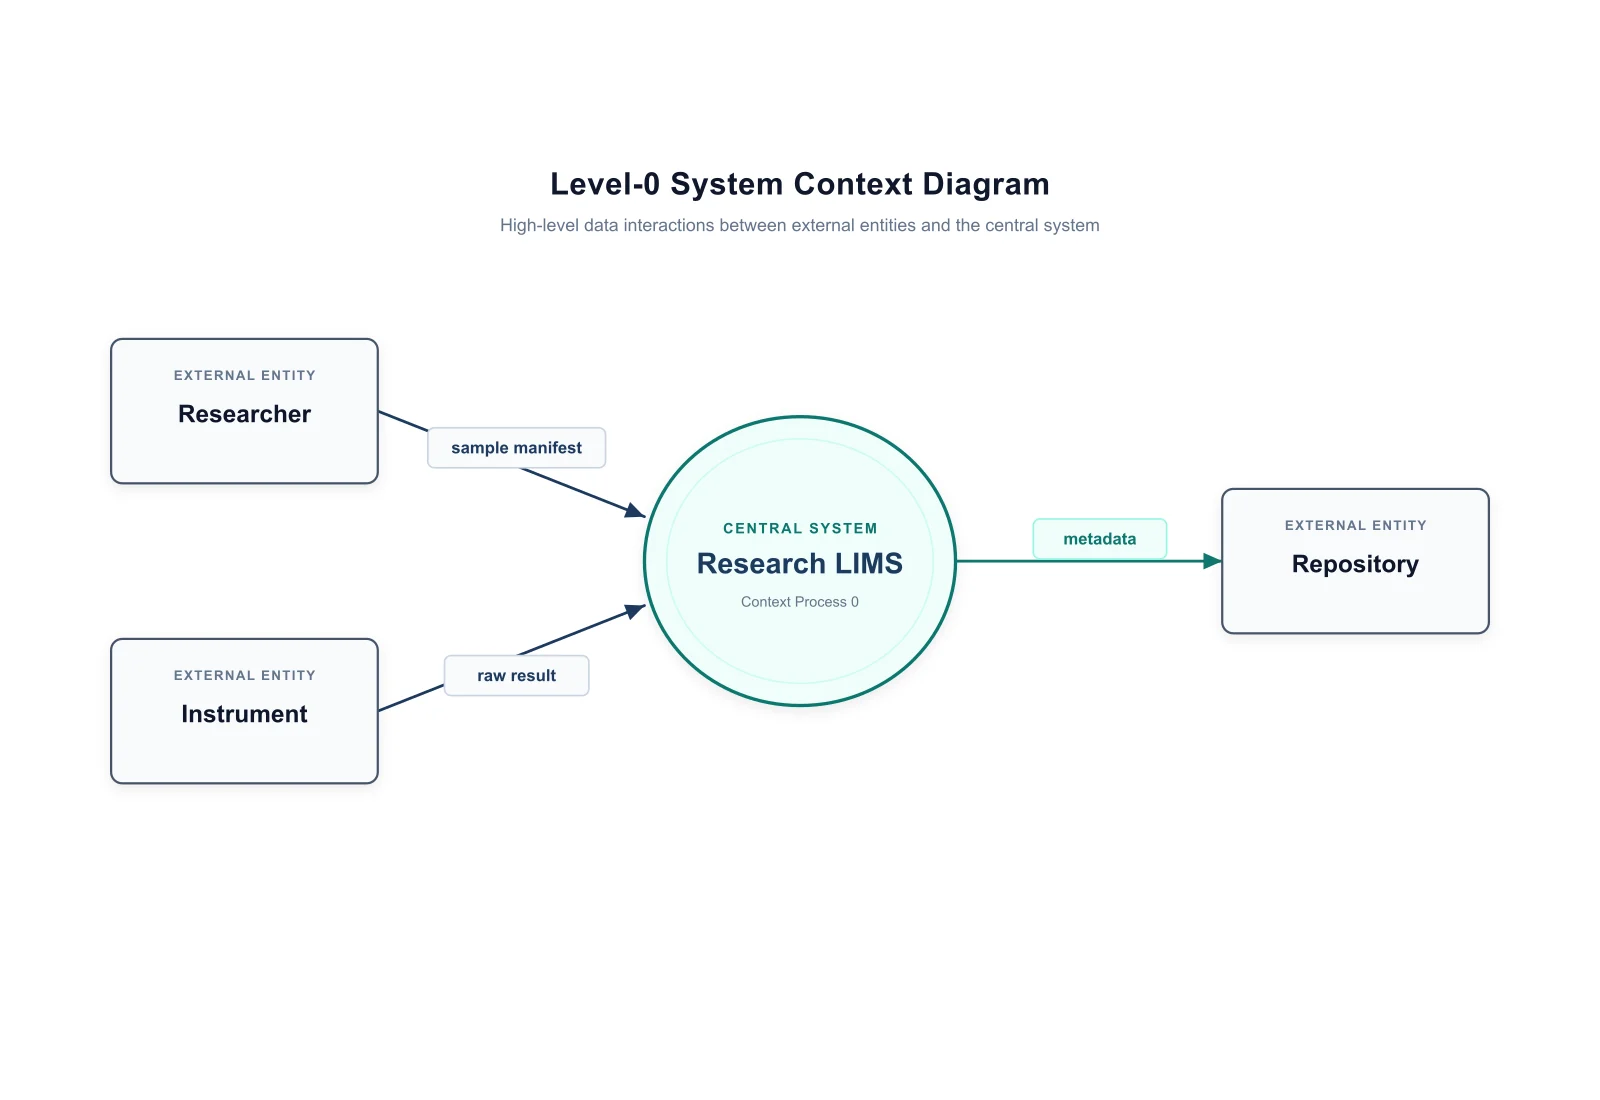
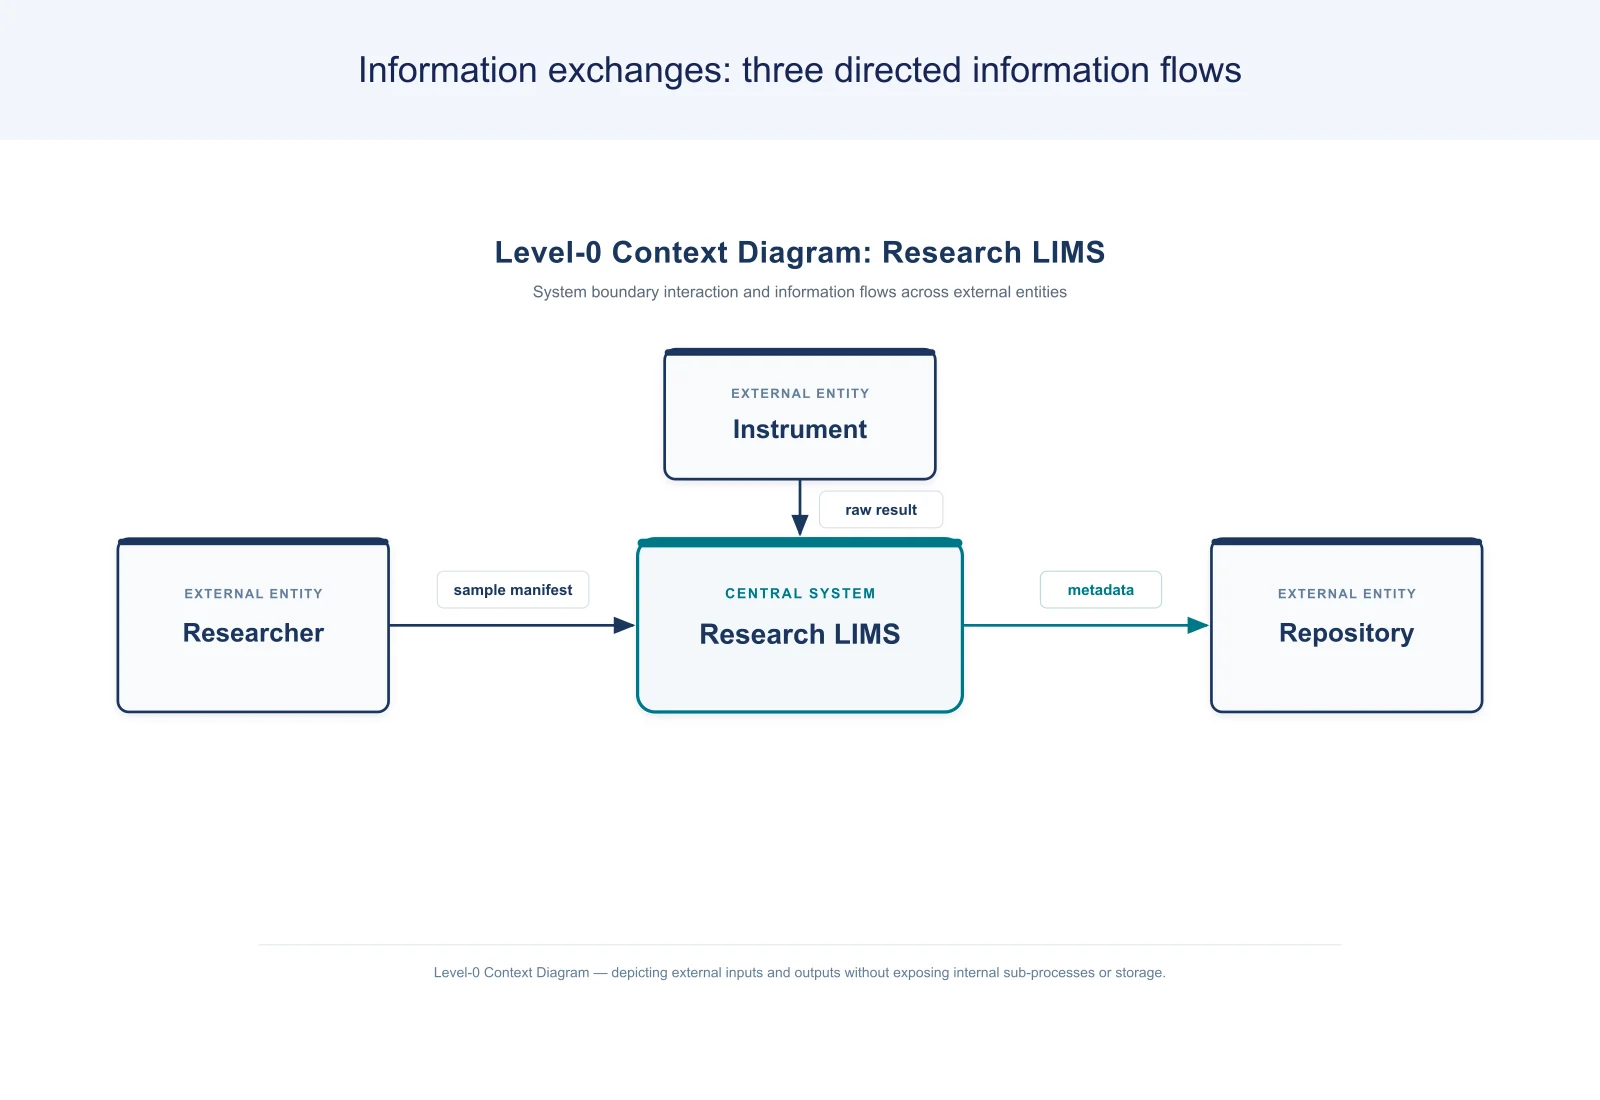
Research LIMS context diagram with one central system, three external entities and three directed information exchanges
  • Keep one system at the center
  • Name the external people and systems
  • Label every information exchange
  • Edit the SVG and export the diagram

System Context Diagram Features

Choose a structure that serves your explanation, with the labels and relationships supplied in your prompt.

Keep one system at the center

A context diagram generator represents the system as one central boundary. Give that system a concise name and state what it covers. This keeps the discussion focused on what is inside the system and what remains outside, without mixing the high-level view with an internal process diagram. Use the context diagram creator to make the central system boundary clear.

  • Name the system boundary
  • Use one central system object
  • Keep internal processing for a detailed DFD
Try this example

Name the external people and systems

List the people, services or organizations that send information to the system or receive information from it. The context diagram maker can arrange them around the boundary with short, distinct labels. For a research service, those roles might include researchers, instruments and a repository, as in the supplied LIMS example.

  • Preserve supplied role names
  • Separate people from external applications
  • Place entities around the boundary
Try this example

Label every information exchange

Describe each flow as a source, destination and information label. An arrow labeled sample metadata means something different from an arrow labeled analysis results. The context diagram generator can show the direction of each supplied exchange, helping a team discuss which interfaces are needed and who depends on them.

  • Specify source and destination
  • Use data labels on the arrows
  • Distinguish incoming and outgoing exchanges
Try this example

Edit the SVG and export the diagram

FlowChart supports text, shape and connection editing, SVG source editing and version history. You can refine role names, move entities and adjust flow labels for a requirements discussion. Export SVG, PNG, JPG or PPTX; use the detailed DFD page when you need to show processes and data stores inside the system.

  • Edit labels and connections
  • Save successive versions
  • Export for requirements reports and slides
Try this example

System Context Diagram: How to Create One

Start from a specific explanation, supply the details and refine the result for your document.

  1. Define the boundary

    Name the system and list what belongs inside it. A context diagram maker starts from this single boundary, rather than a sequence of internal actions. Identify the research service as one system and distinguish the external roles from its internal components, giving the diagram a clear scope for the discussion.

  2. List external entities and exchanges

    For each external role or service, state what information it sends and receives. Use a clear source, destination and label for every flow. For the supplied LIMS scenario, identify the sample manifest, raw result and metadata exchanges explicitly so each arrow connects the appropriate external entity with the system.

  3. Generate through FlowChart

    Describe the layout and generate an editable SVG. The context diagram generator uses your supplied entities and exchanges to form the high-level diagram. You can choose a surrounding or left-to-right arrangement, then use the same system and flow labels so the layout presents the intended boundary consistently.

  4. Refine and export

    Adjust labels, connections and positions for the discussion or report. Export the diagram and keep the project if the system interfaces may change. You can retain the same scenario while changing label spacing or arrow placement, making the external exchanges easier to follow in a presentation or requirements document.

System Context Diagram Uses

These tasks connect a concrete input with the figure you want to explain or share.

Research LIMS context diagram with one central system, three external entities and three directed information exchanges

Discuss a research information system

Use a system context diagram to explain which research roles and external services interact with a LIMS. The supplied example keeps those exchanges around one system. Name the Researcher, Instrument and Repository roles, then use the sample manifest, raw result and metadata labels to discuss what crosses the research-system boundary.

Explore this example
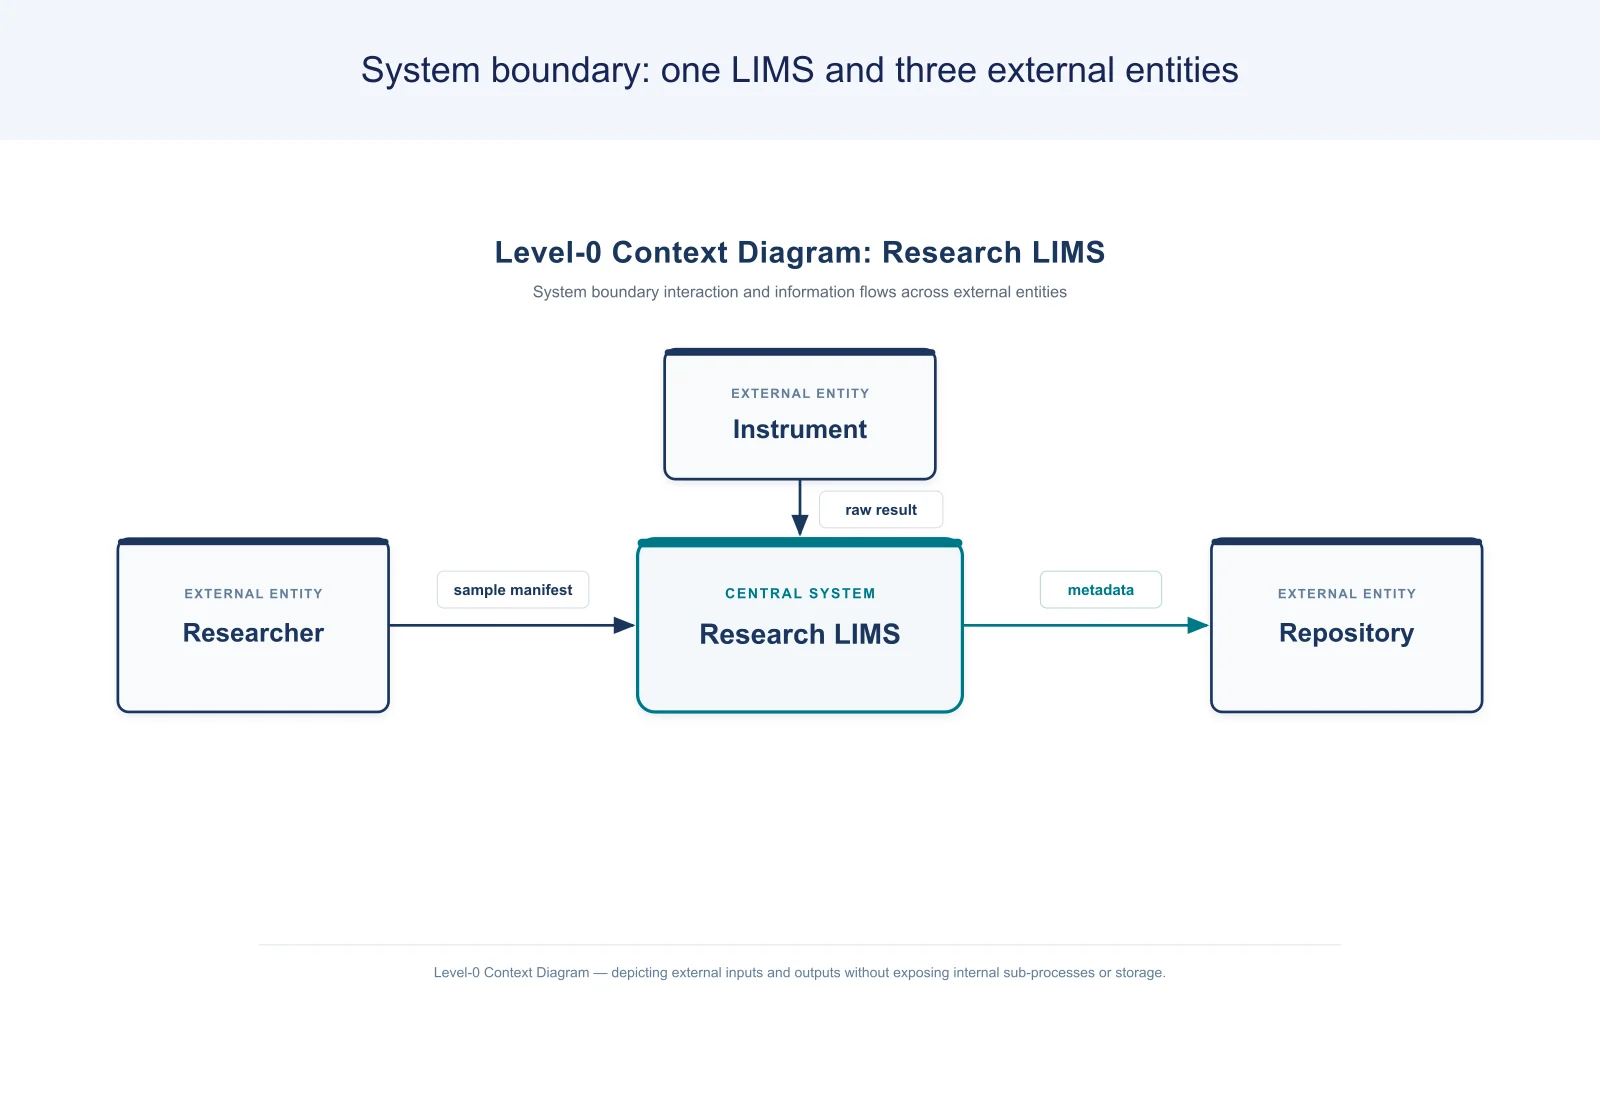
Accepted LIMS context diagram with an added explanatory heading identifying one system boundary and three external entities

Agree the scope of a new service

Show the proposed boundary before discussing internal implementation. External entities make the dependencies visible to stakeholders. List the people and external services that exchange information with the proposed system, and use the boundary view to explain which interactions belong in the project scope.

Explore this example
Accepted LIMS context diagram with an explanatory heading identifying three directed information exchanges

Document interface requirements

Label what each interface sends or receives so that an integration discussion stays focused on information rather than unnamed arrows. Specify the source, destination and data label for each exchange, then use the context view as a shared reference when discussing what an external service provides or needs.

Explore this example
Second accepted SVG layout for the same supplied research LIMS system and three external entities

Prepare a high-level project report

Place a readable context view in the introduction to a requirements or research-system document, then use later figures for internal detail. Keep the system name and external role labels consistent with the report, so readers can connect this overview with the more detailed figures and descriptions that follow.

Explore this example
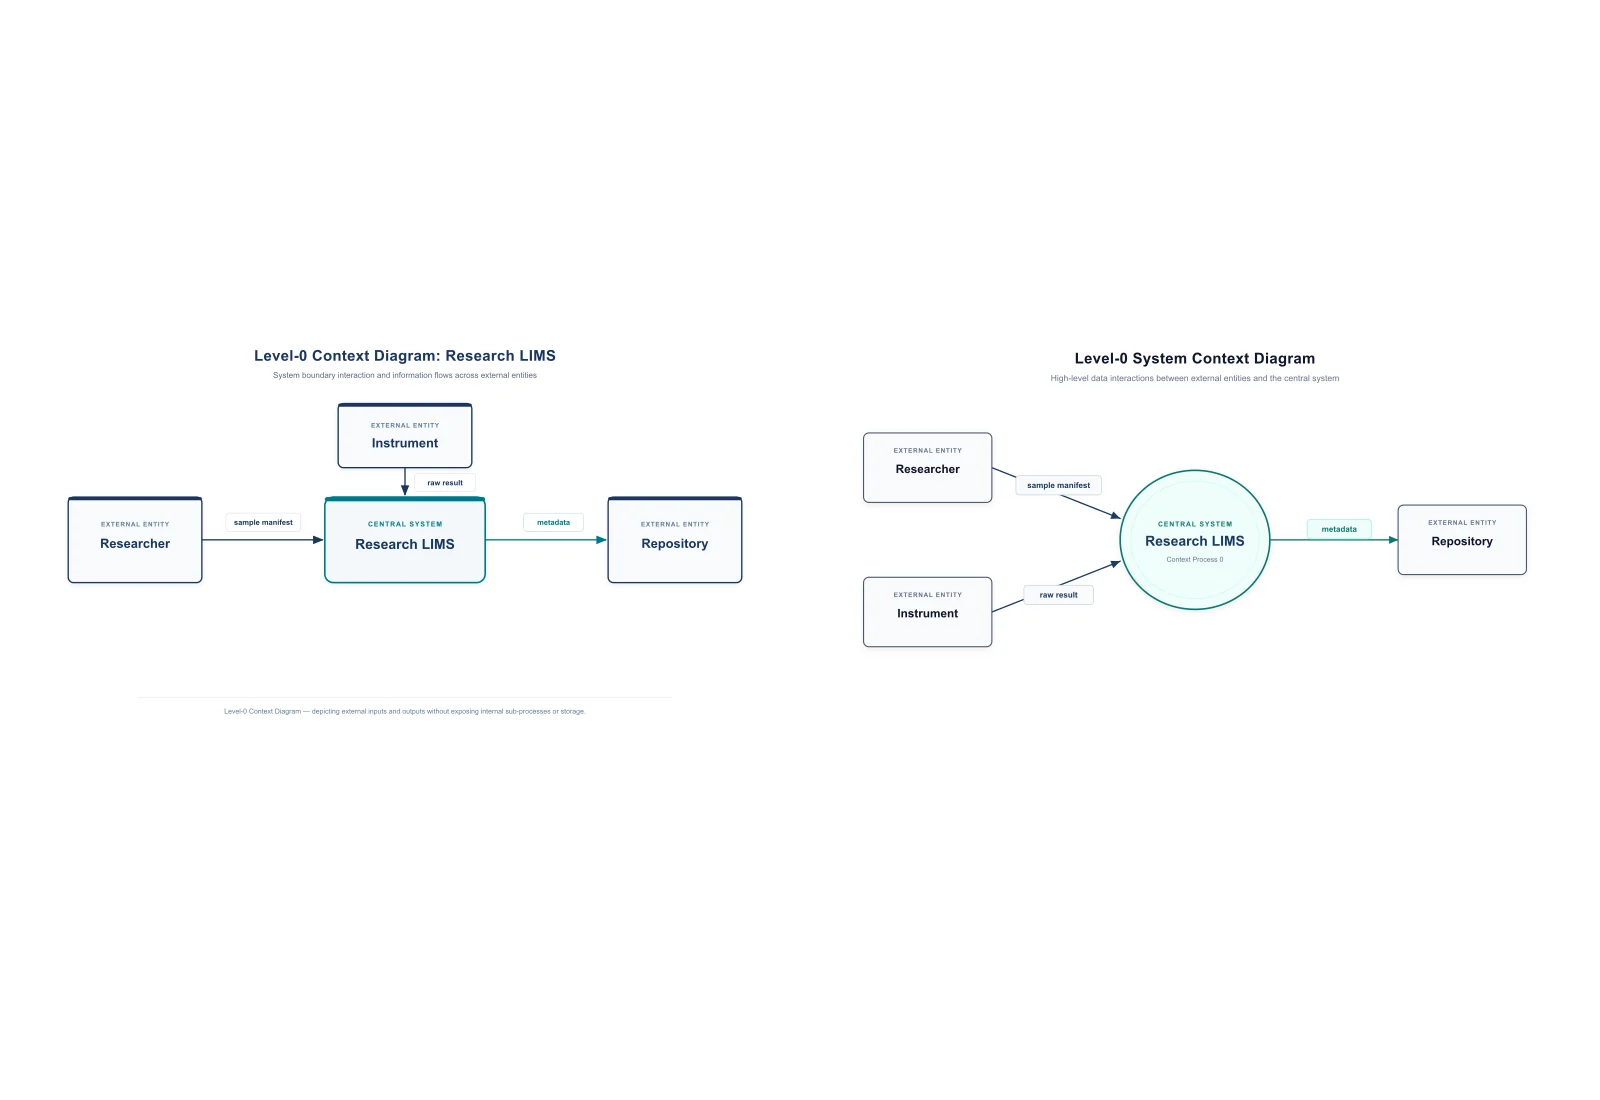
Comparison montage of two accepted layouts of the same research LIMS context diagram

Compare diagram layouts

Review two arrangements of the same supplied scenario and choose the one that makes the role names and flow directions easiest to follow. The supplied views retain the same Researcher, Instrument and Repository exchanges, allowing you to compare layout choices while keeping the system boundary and scenario unchanged.

Explore this example
Research LIMS context diagram with one central system, three external entities and three directed information exchanges

Start a detailed data flow diagram

Use the context view to establish external entities, then move to the DFD generator to explain internal processes and data stores. Carry the established external roles into that next figure, then add the internal processing and storage details that belong in a data flow diagram rather than the context view.

Explore this example
System Context Diagram Scenarios

Illustrative ways to use the tool in a lesson, report or research discussion.
I would agree the LIMS boundary with the team before describing the internal processing steps in a separate DFD.

Alex R.

Research systems analyst

These are illustrative use scenarios with fictional names, not verified customer reviews.

Free tools

A tool for every scientific figure

94 focused generators for the scientific figure you need — each opens in the right workspace with a matching example.

System Context Diagram Questions

1.

2.

3.

4.

5.

6.

Call to action background

Turn your explanation into a figure

System Context Diagram: Create Your Figure

Create your figure

Free to start · No credit card required · Built for researchers