SciFig

Turn your process into a flowchart

Describe your methods or upload a PDF, Word file, or image — edit every node and arrow, export to SVG or PPTX.

Describe what you need in the box above.

Start with up to 150 free credits|No credit card required

Get up to 350 free credits on day one when you join through an invite.

3 figure engines · 500+ templatesEvery label editable · 60+ color schemesEditable PPTX · Layered SVG · 8K PNG / JPG

Free Graphic Organizer Generator for Study Notes— templates & examples

Updated

graphic organizer

Free Graphic Organizer Generator for Study Notes

Turn notes into a clear structure you can explain and edit.

A graphic organizer generator arranges ideas into a visual structure that makes relationships easier to see. SciFig uses FlowChart to turn your notes into an editable SVG: compare research methods, connect possible causes with an outcome, organize what a class knows and wants to learn, or outline a study. Describe the ideas and relationships you want to preserve, choose a layout, and generate a first draft. You can edit the wording and shapes, move nodes and refine connections before exporting the figure for a lesson, presentation or research document.

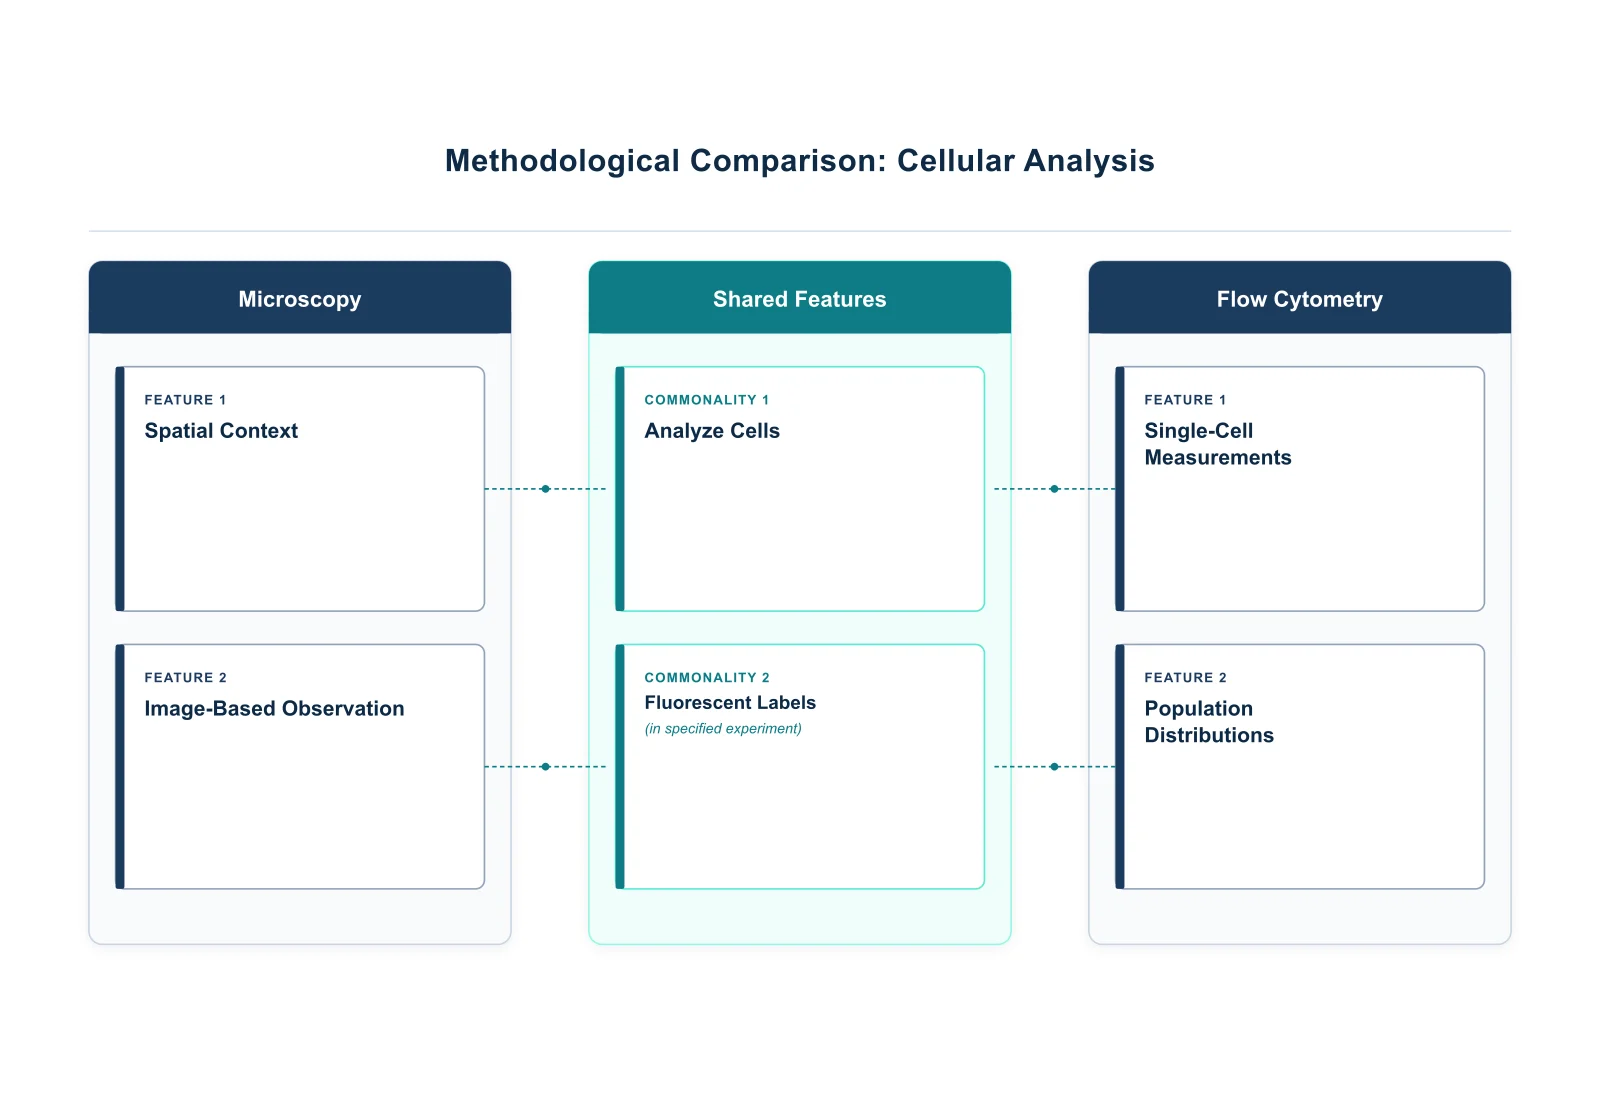
Comparison organizer for microscopy and flow cytometry with shared features and aligned method criteria
  • Compare ideas side by side
  • Connect possible causes and effects
  • Create a KWL chart from a lesson plan
  • Edit the wording and export the figure

Graphic Organizer Features

Choose a structure that serves your explanation, with the labels and relationships supplied in your prompt.

Compare ideas side by side

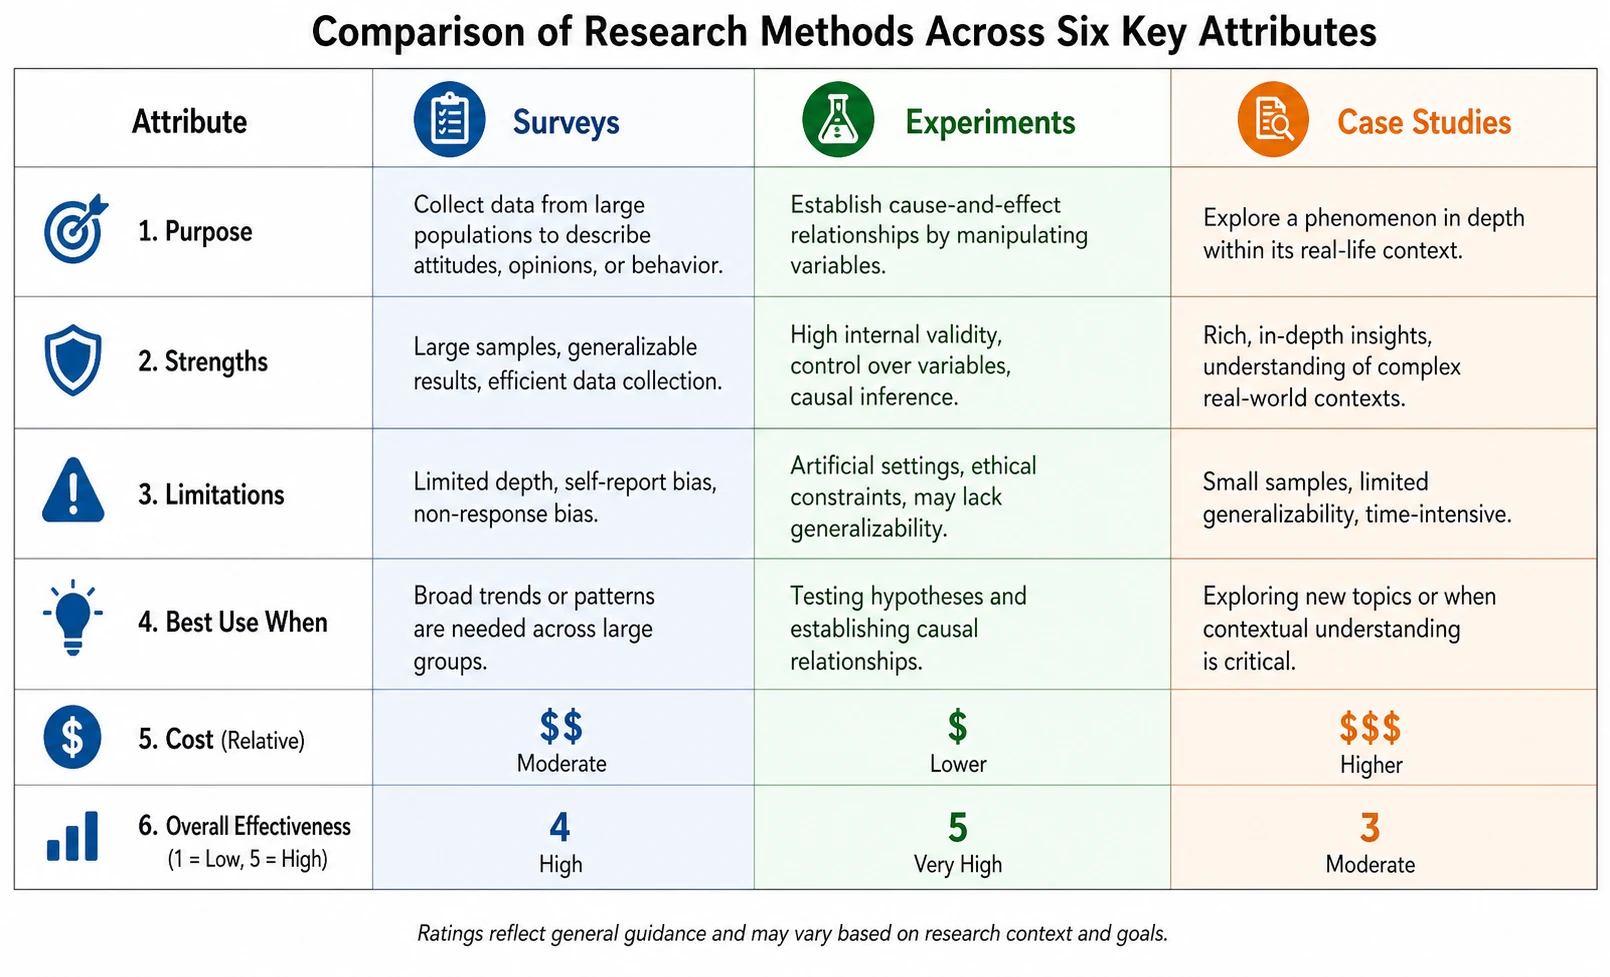
A graphic organizer generator can place competing explanations or research methods in aligned columns. Give the same comparison criteria for each item, such as preparation, readout or use case, and say which features belong in a shared section. This helps a reader compare like with like instead of searching through separate paragraphs.

  • Use matching criteria for every item
  • Separate shared and distinguishing features
  • Keep short labels in editable SVG objects
Try this example

Connect possible causes and effects

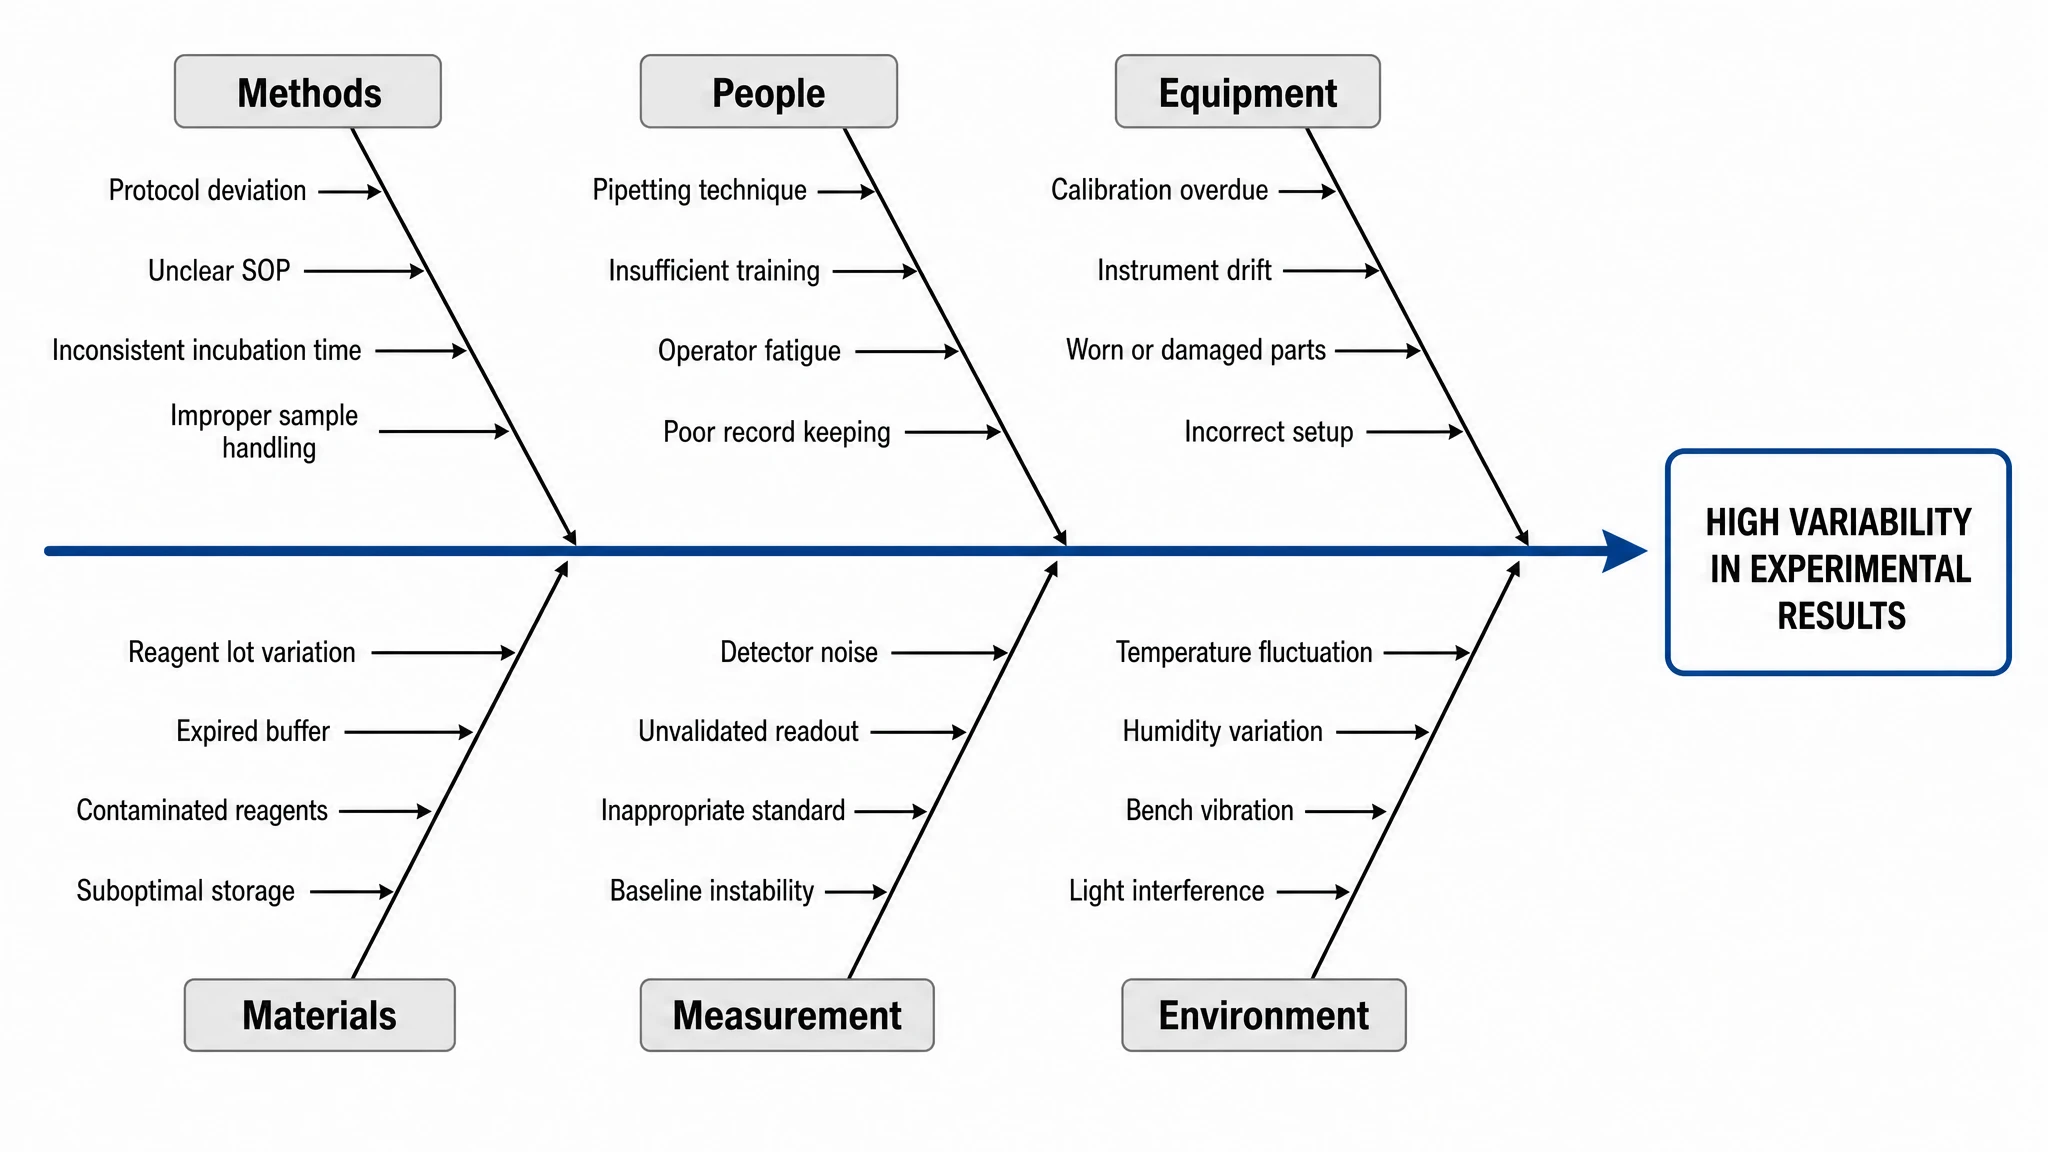
Describe an outcome and the factors you want to discuss. The AI graphic organizer can group those factors and connect them to the outcome, so a class or research team can see the proposed structure. You can label hypotheses as hypotheses and rearrange the branches as the discussion develops.

  • Group related factors
  • Label the outcome clearly
  • Revise relationships in the canvas
Try this example

Create a KWL chart from a lesson plan

A KWL chart separates what learners know, what they want to know and what they later learn. Tell the graphic organizer maker which statements are already given and which columns should stay blank. The structure can support a lesson without filling in discoveries before the activity takes place.

  • Keep supplied knowledge and questions separate
  • Leave unfinished columns blank
  • Reuse the layout for another lesson
Try this example

Edit the wording and export the figure

FlowChart produces an SVG with text, shapes and connections you can edit. Change a label, move a block, adjust the colors or use the SVG source to refine the layout. You can download SVG, PNG, JPG or PPTX for a document or slide, and retain the project to revisit the organizer later.

  • Edit labels and shapes
  • Keep revision history
  • Download SVG or image formats
Try this example

Graphic Organizer: How to Make One

Start from a specific explanation, supply the details and refine the result for your document.

  1. Choose the relationship to show

    Start with a specific task: compare methods, explore possible causes, collect KWL notes or outline a study. A graphic organizer maker works best when the structure follows the relationship rather than the amount of text.

  2. Supply the ideas and labels

    Paste the notes and list the sections, comparison criteria or question headings you want. State which facts are given and which parts should remain empty. A reference document can provide additional context. Use the supplied wording for each label so the organizer reflects your notes and remains easy to discuss with your intended readers.

  3. Generate an editable organizer

    Describe the layout, reading order and audience, then generate through FlowChart. The AI graphic organizer produces a first SVG version that you can inspect in the workspace. You can compare the connections with your input and adjust spacing or labels so related ideas stay together and the reading order is clear.

  4. Refine and share

    Edit wording, move shapes and adjust the connections for your explanation. Save the version and export the figure in the format your worksheet, paper or presentation needs. For a teaching slide, you can emphasize the most important comparison; for a worksheet, you can leave room beside each idea for learners to write.

Graphic Organizer Uses

These tasks connect a concrete input with the figure you want to explain or share.

Comparison organizer for microscopy and flow cytometry with shared features and aligned method criteria

Compare research methods

Use aligned criteria to explain the choices between two methods in a proposal or teaching slide. Shared features and method-specific strengths can sit in separate areas. Supply the same criteria for both methods so readers can compare each dimension and connect the visual summary with the explanation in your notes.

Explore this example
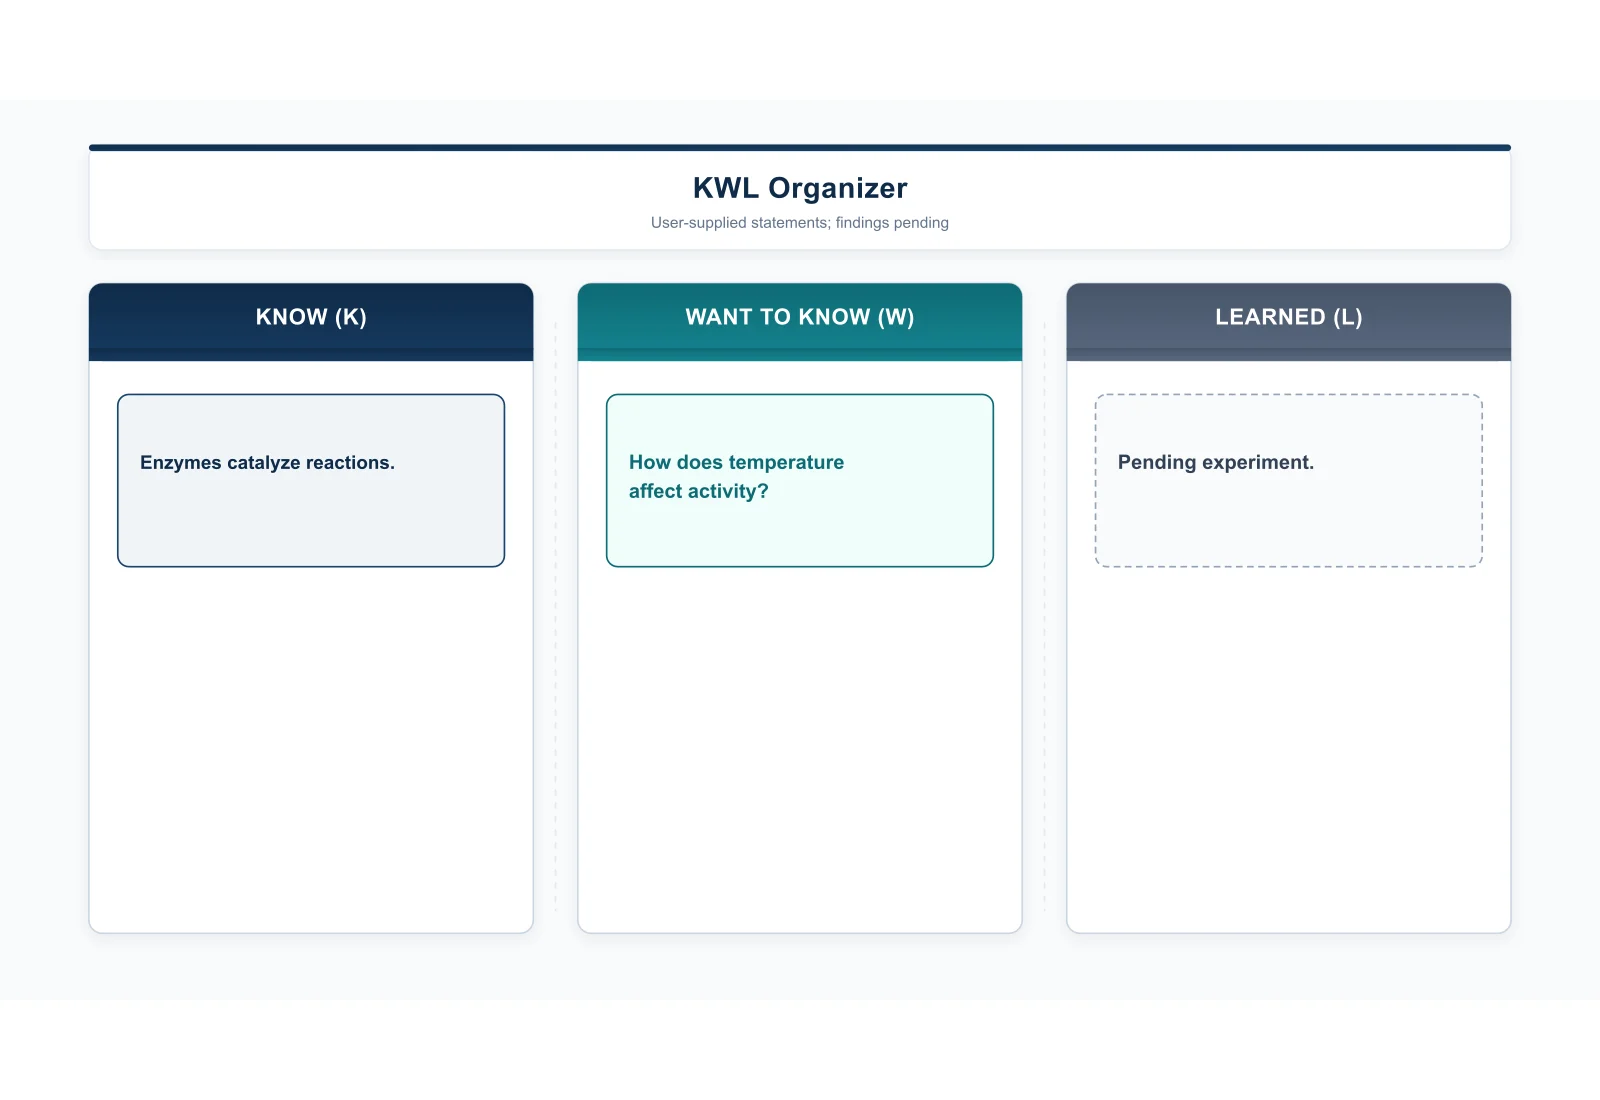
KWL organizer about enzyme temperature effects with a Pending experiment label in the Learned column

Prepare a KWL worksheet

Create an organizer before a lesson and leave space for learners to add their questions and findings. Keep the same structure for the follow-up discussion. Use the supplied enzyme-temperature example to separate prior knowledge, questions and the pending experiment, then record new findings in the appropriate column when they become available.

Explore this example
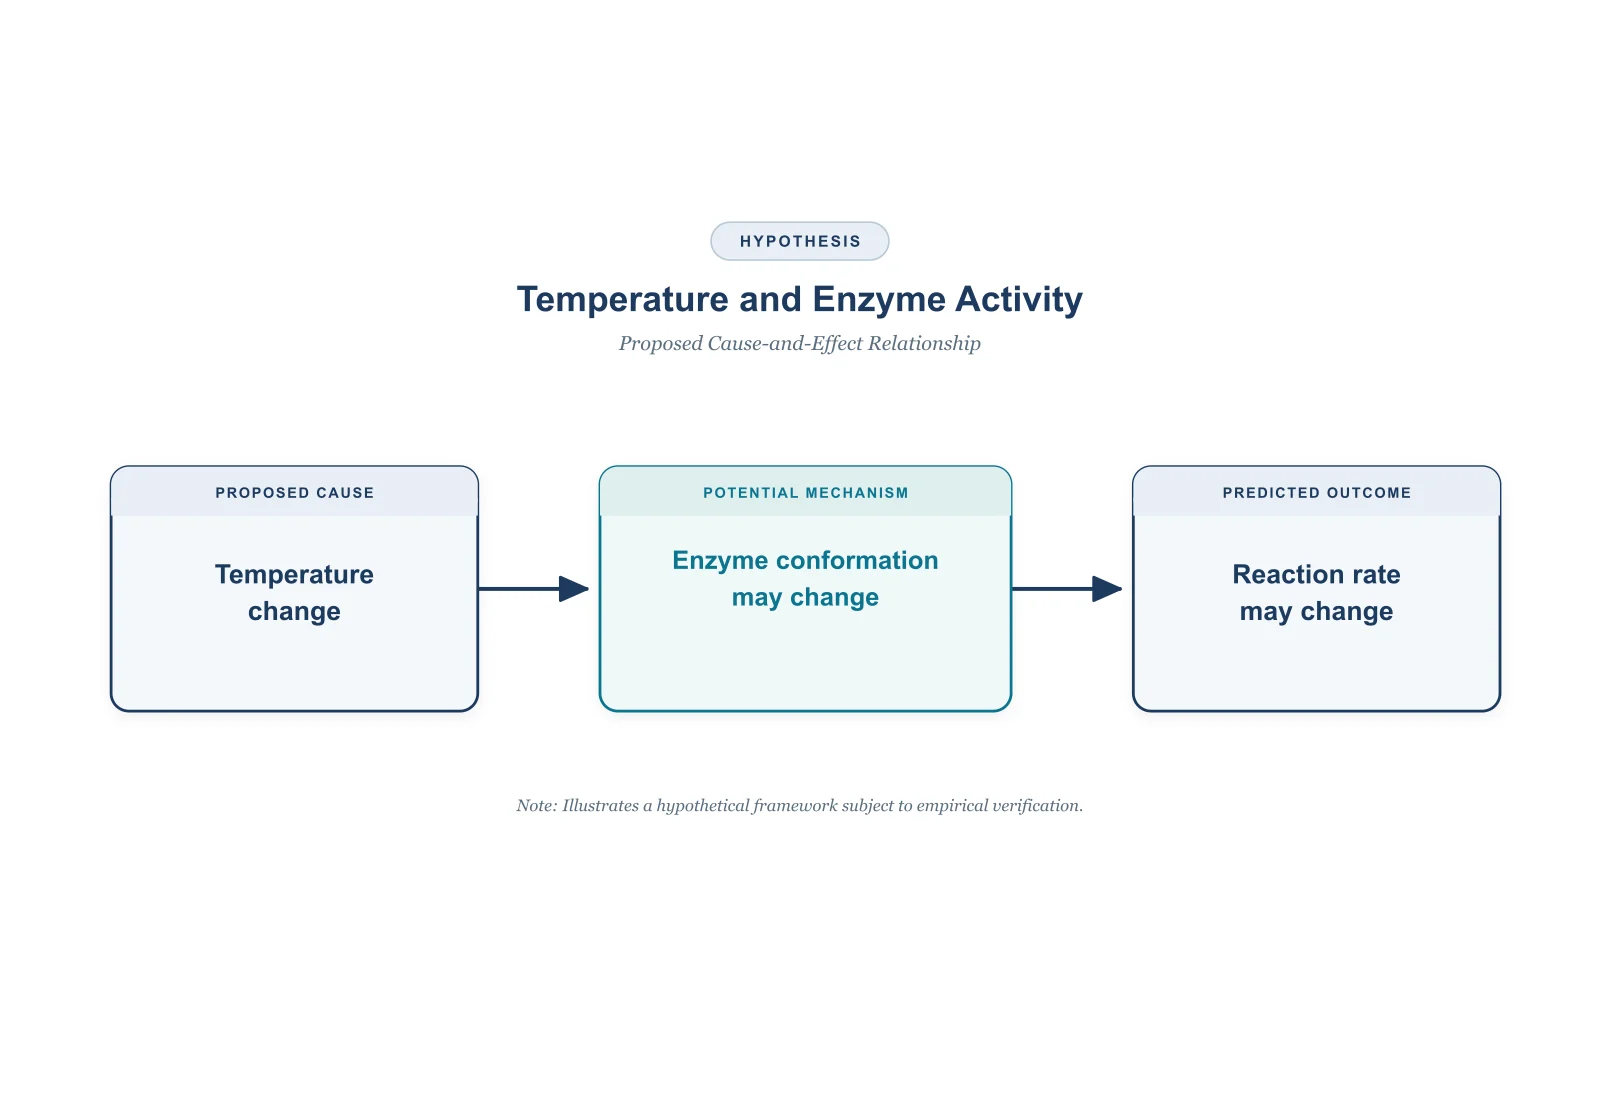
Cause-and-effect organizer connecting temperature change, a possible change in enzyme conformation and a possible change in reaction rate

Discuss possible assay variability

Group proposed influences on sample handling, reagents, instruments and analysis. The figure makes the discussion visible without converting assumptions into measured evidence. Use the temperature example to distinguish an observed change from a proposed link through enzyme conformation, keeping each relationship available for discussion and further investigation.

Explore this example
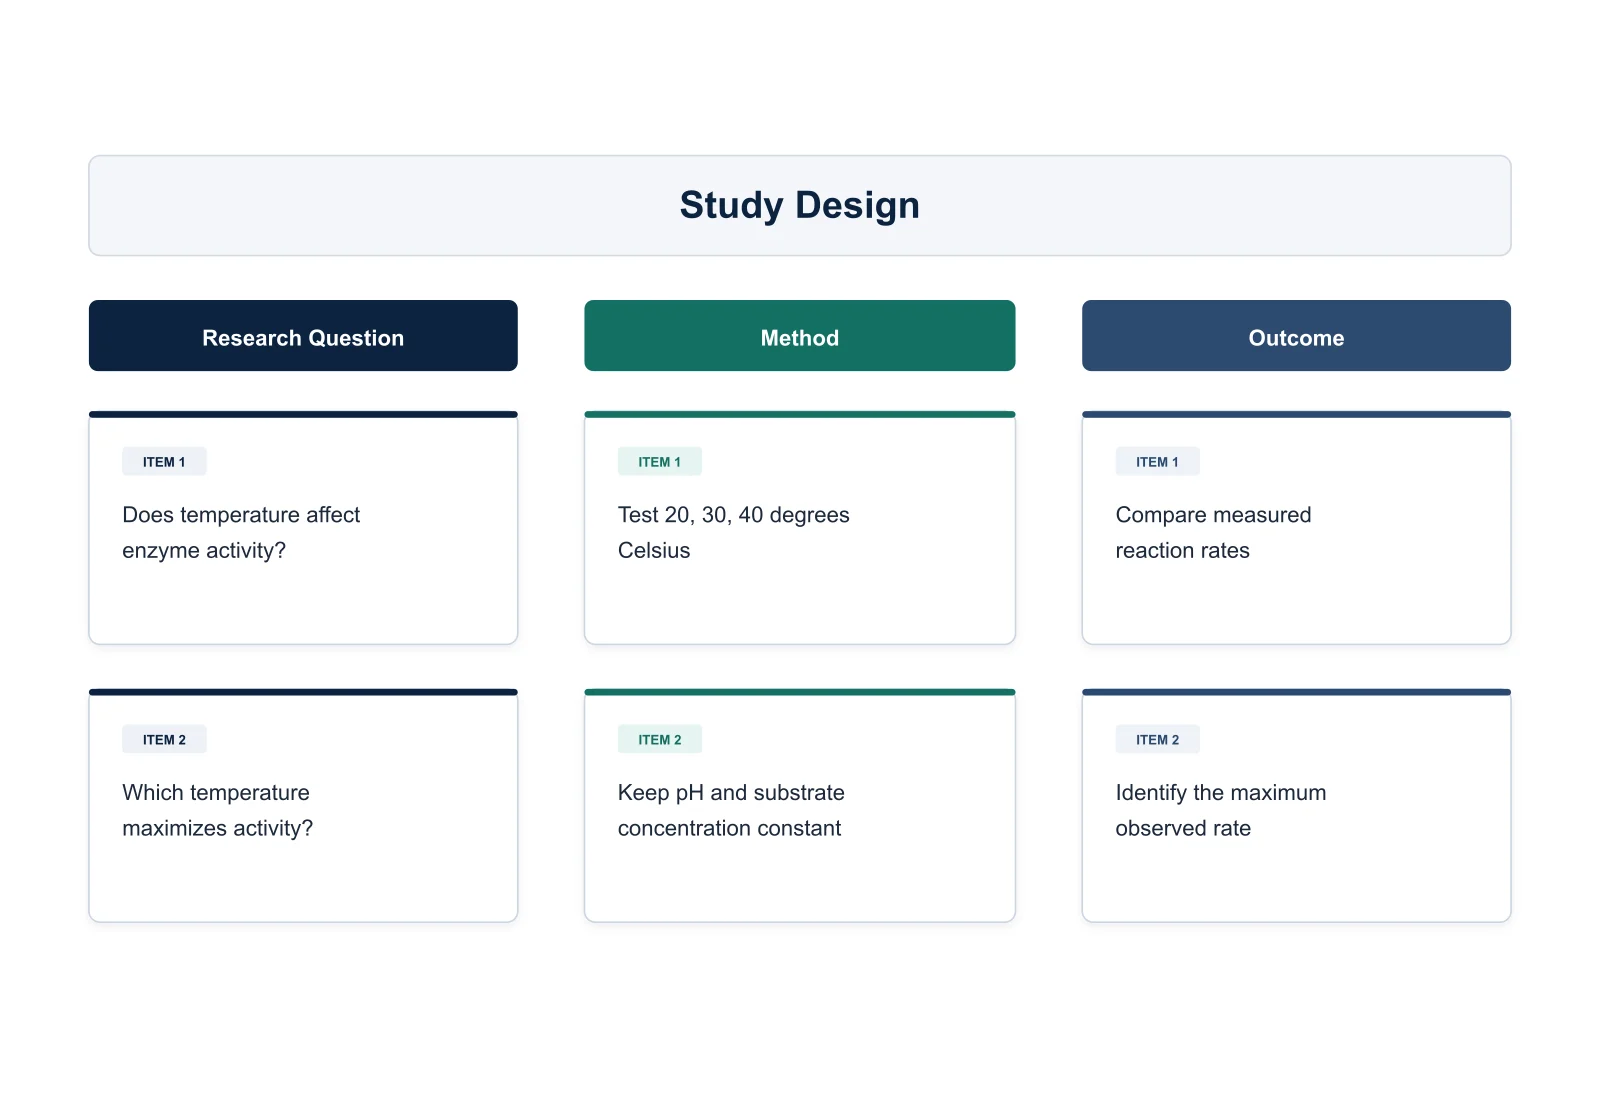
Research organizer comparing enzyme activity at three temperatures with constant pH and substrate concentration and an outcome defined as comparing rates

Outline a study proposal

Show how the research question relates to groups, measurements and the intended analysis. A study organizer can reveal missing links before you write the full proposal. The supplied example connects an enzyme-activity question with temperature conditions, fixed pH and substrate concentration, and a comparison of rates as the intended outcome.

Explore this example
Comparison organizer for microscopy and flow cytometry with shared features and aligned method criteria

Organize a literature discussion

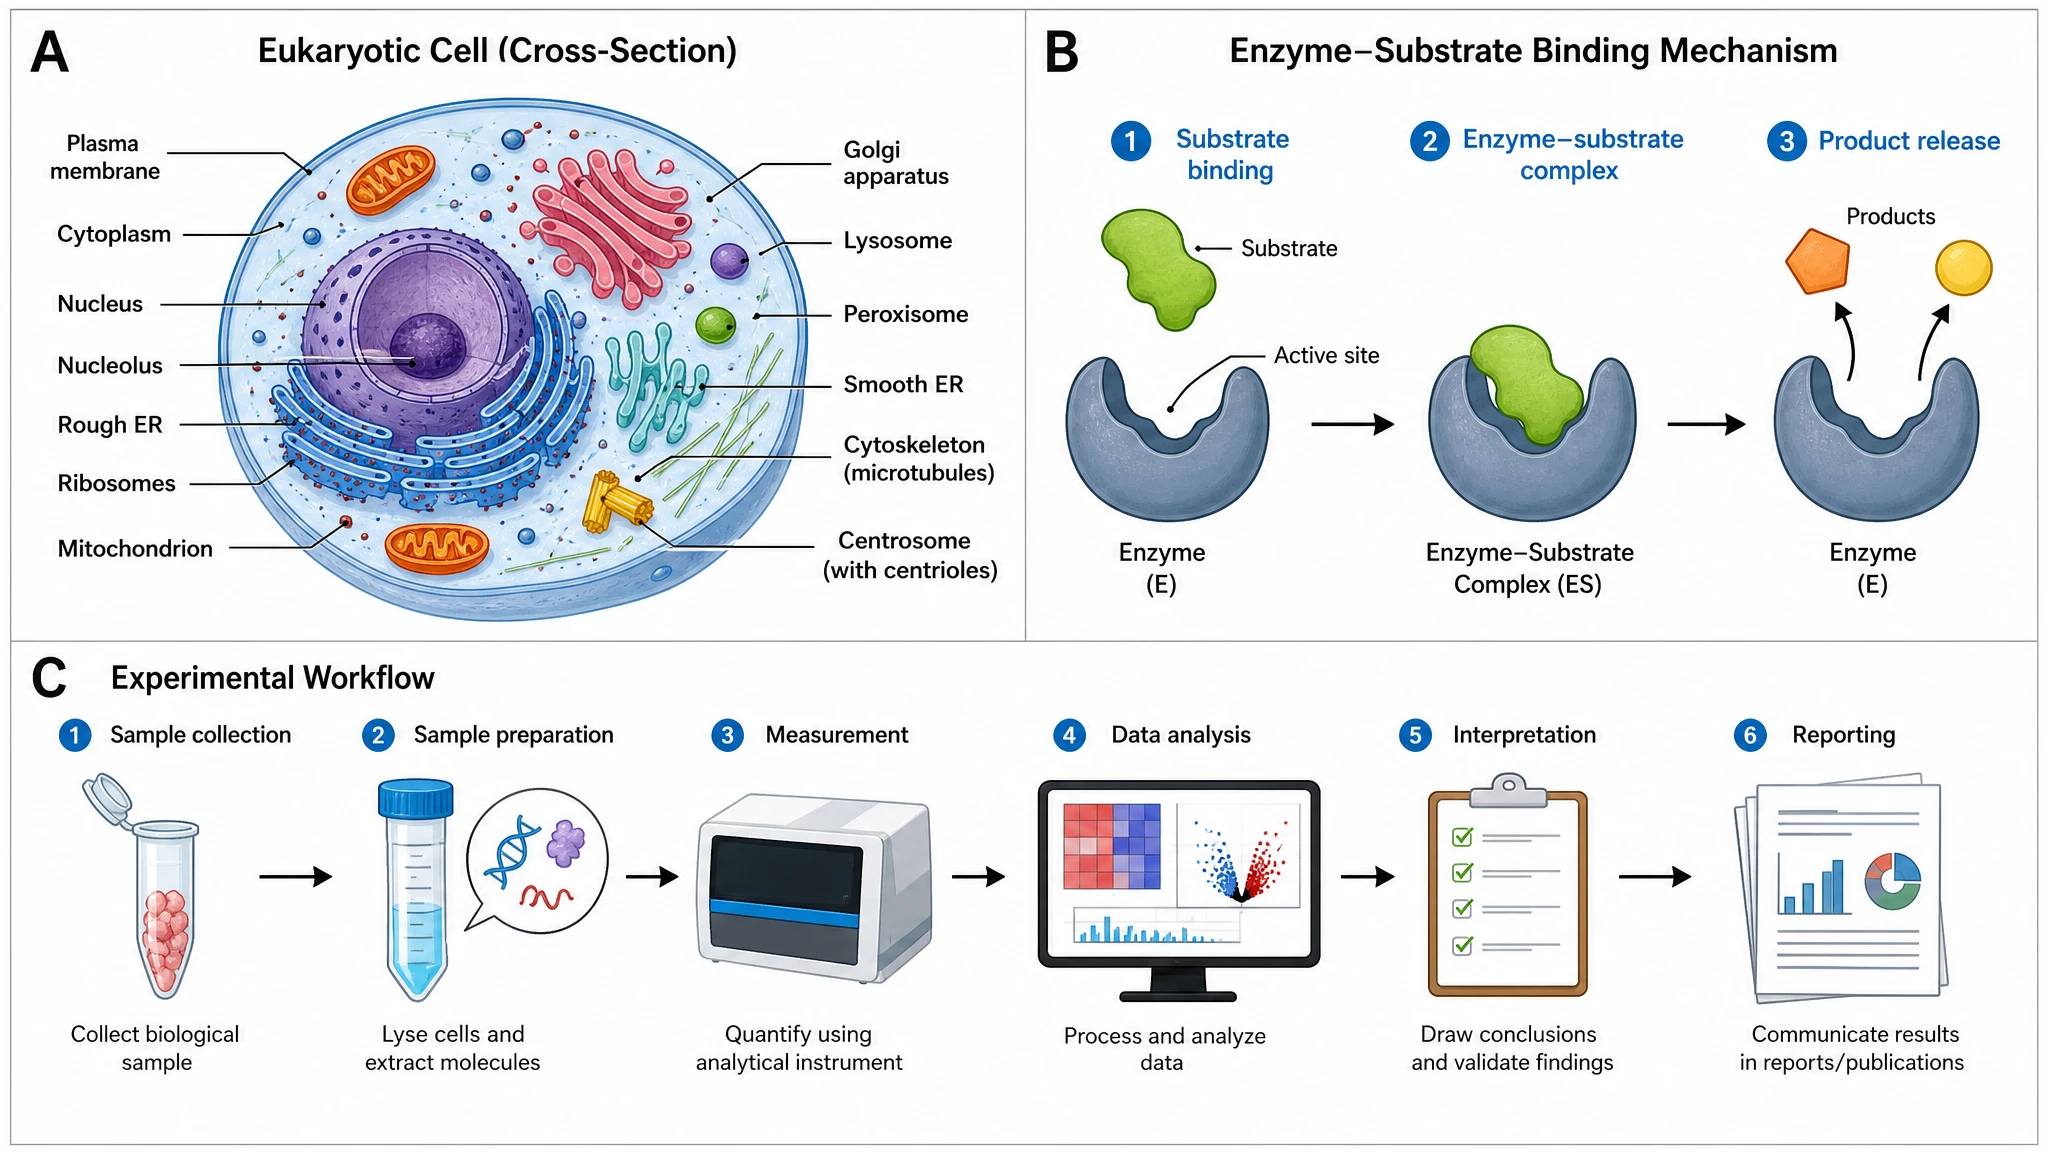
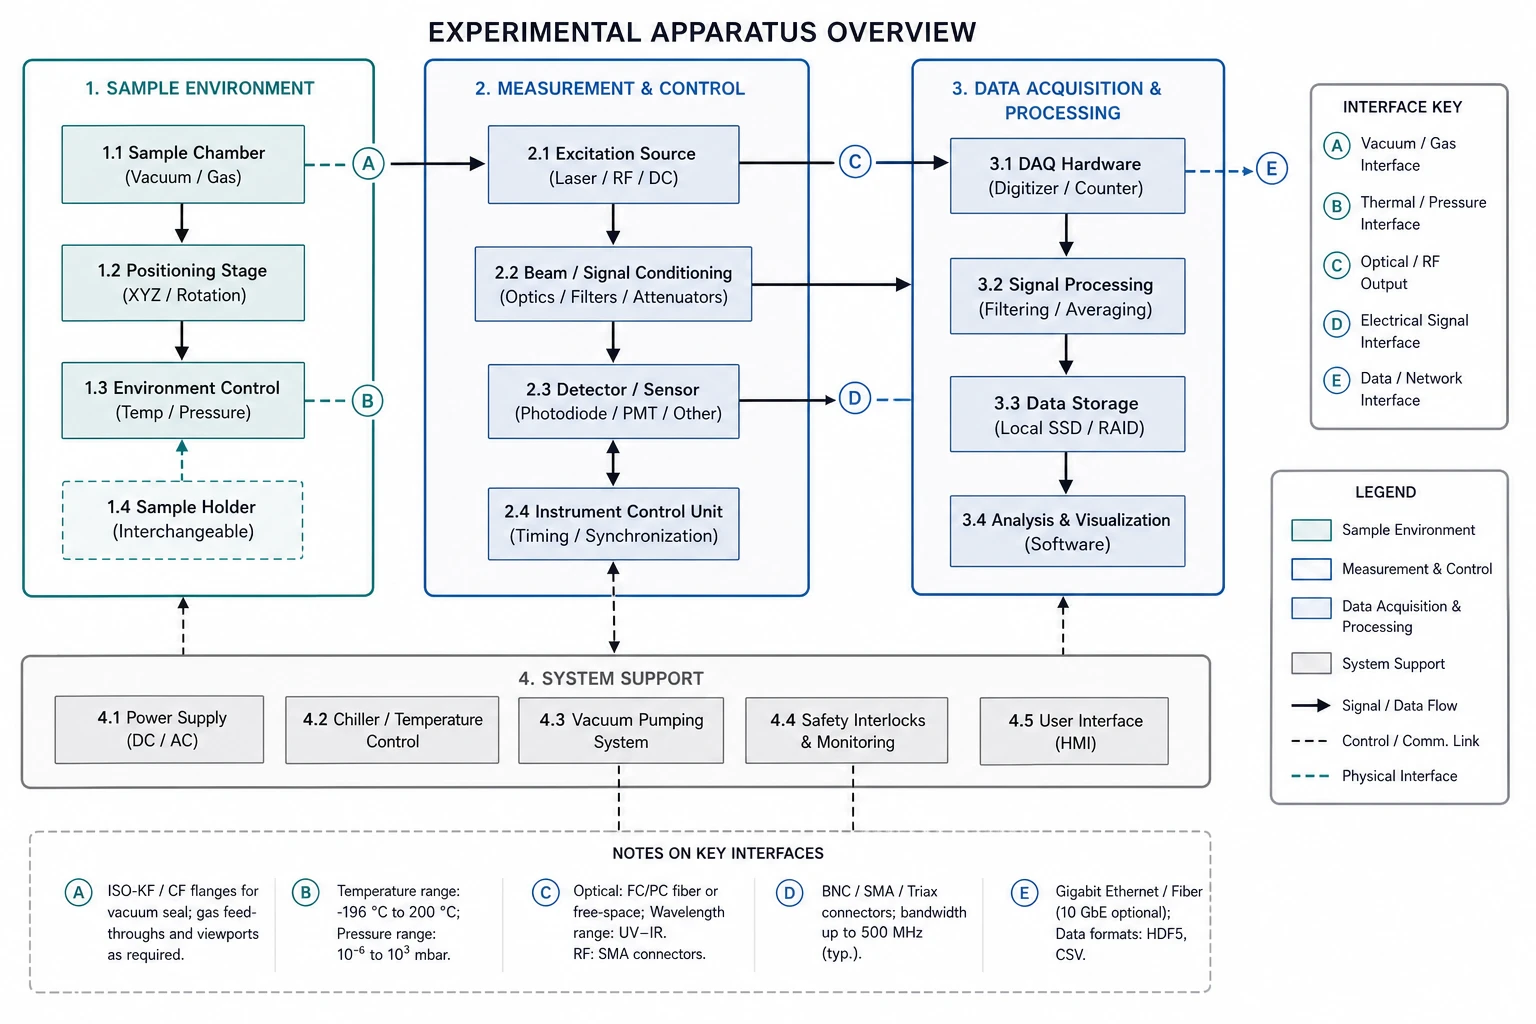
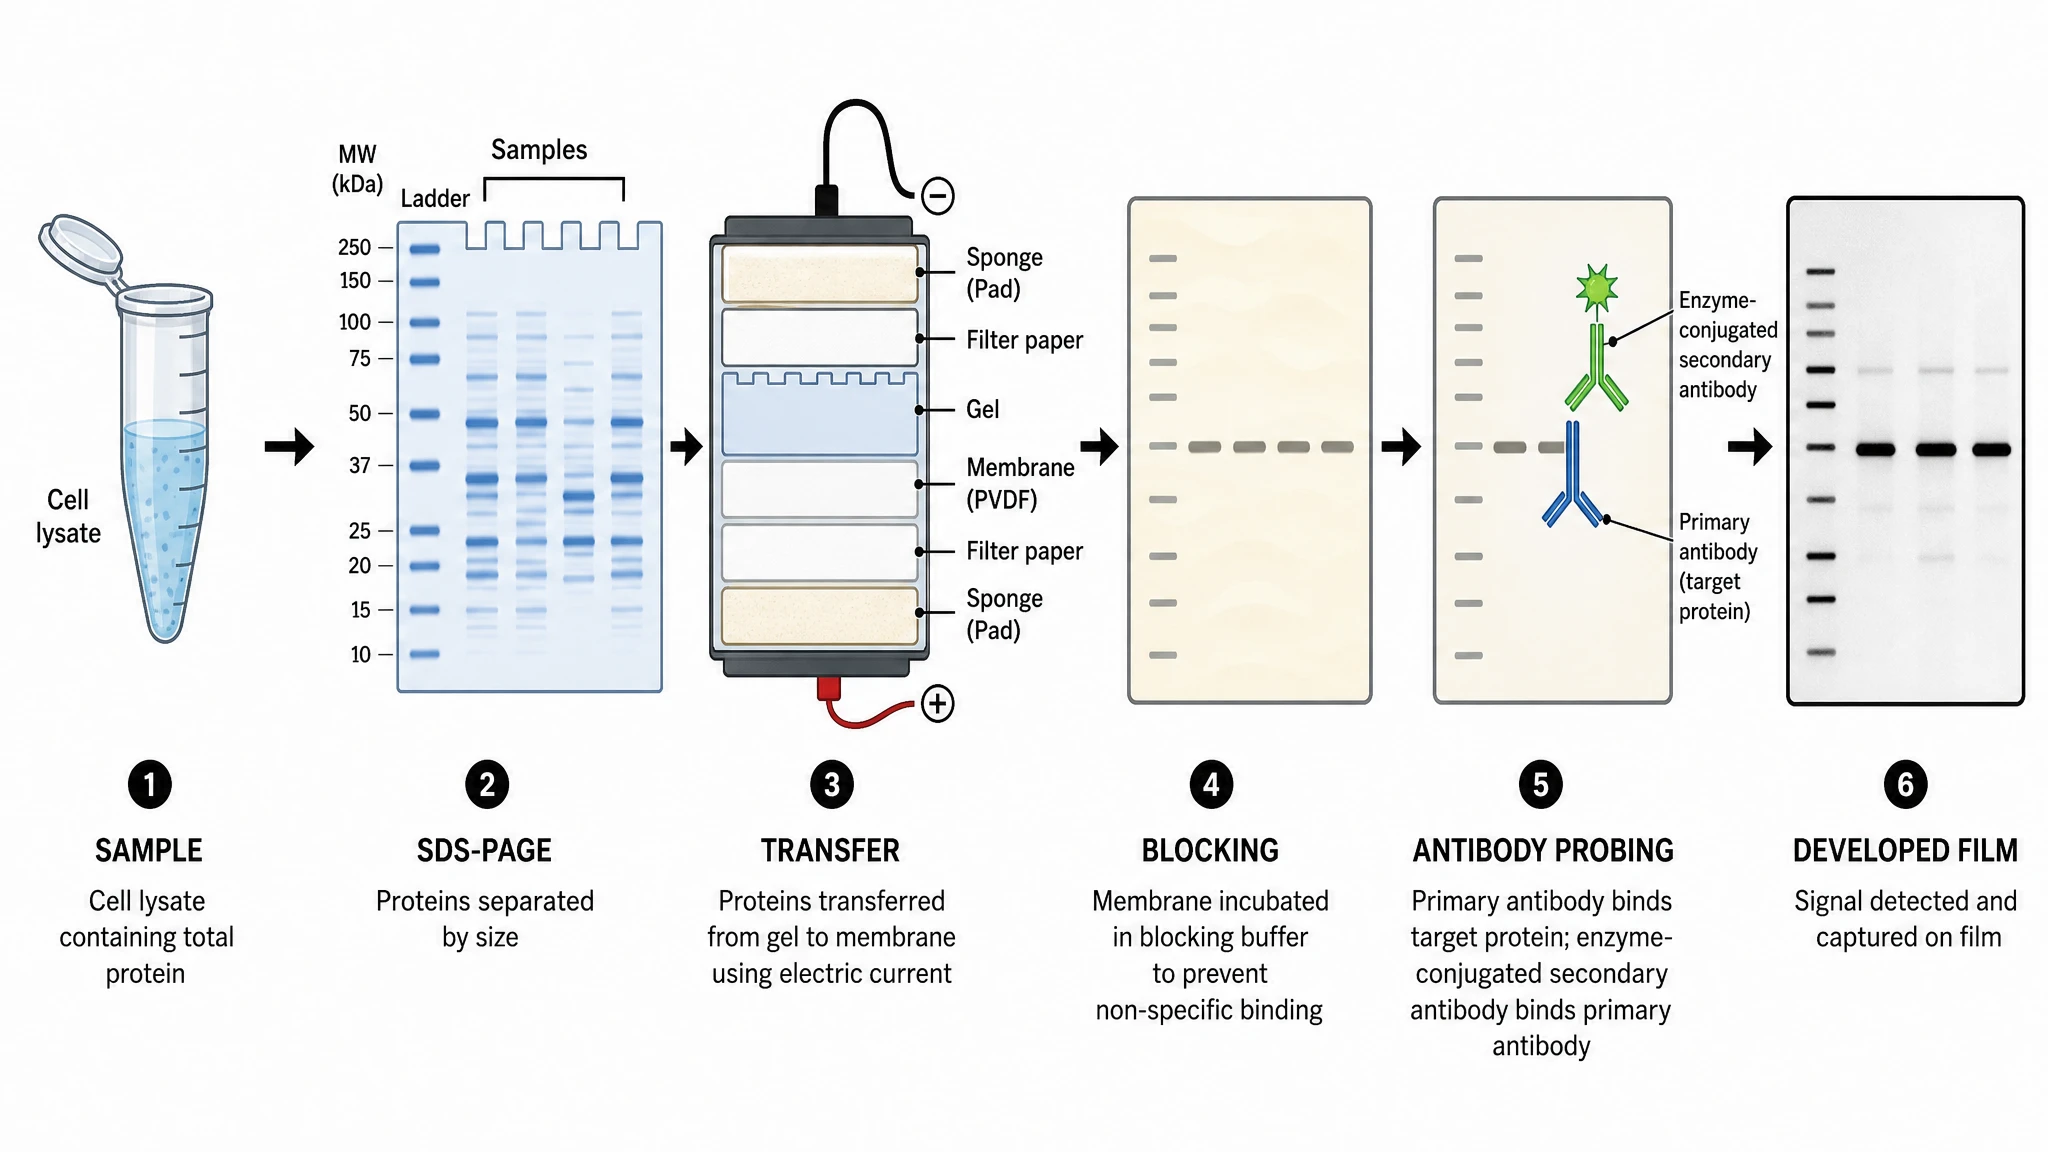
Compare supplied viewpoints or themes from papers in a visual structure. For a detailed sequence of steps, the experimental workflow diagram page provides a related starting point. Supply the paper titles and the specific ideas you want to contrast, then use consistent labels so readers can follow which source contributed each point.

Explore this example
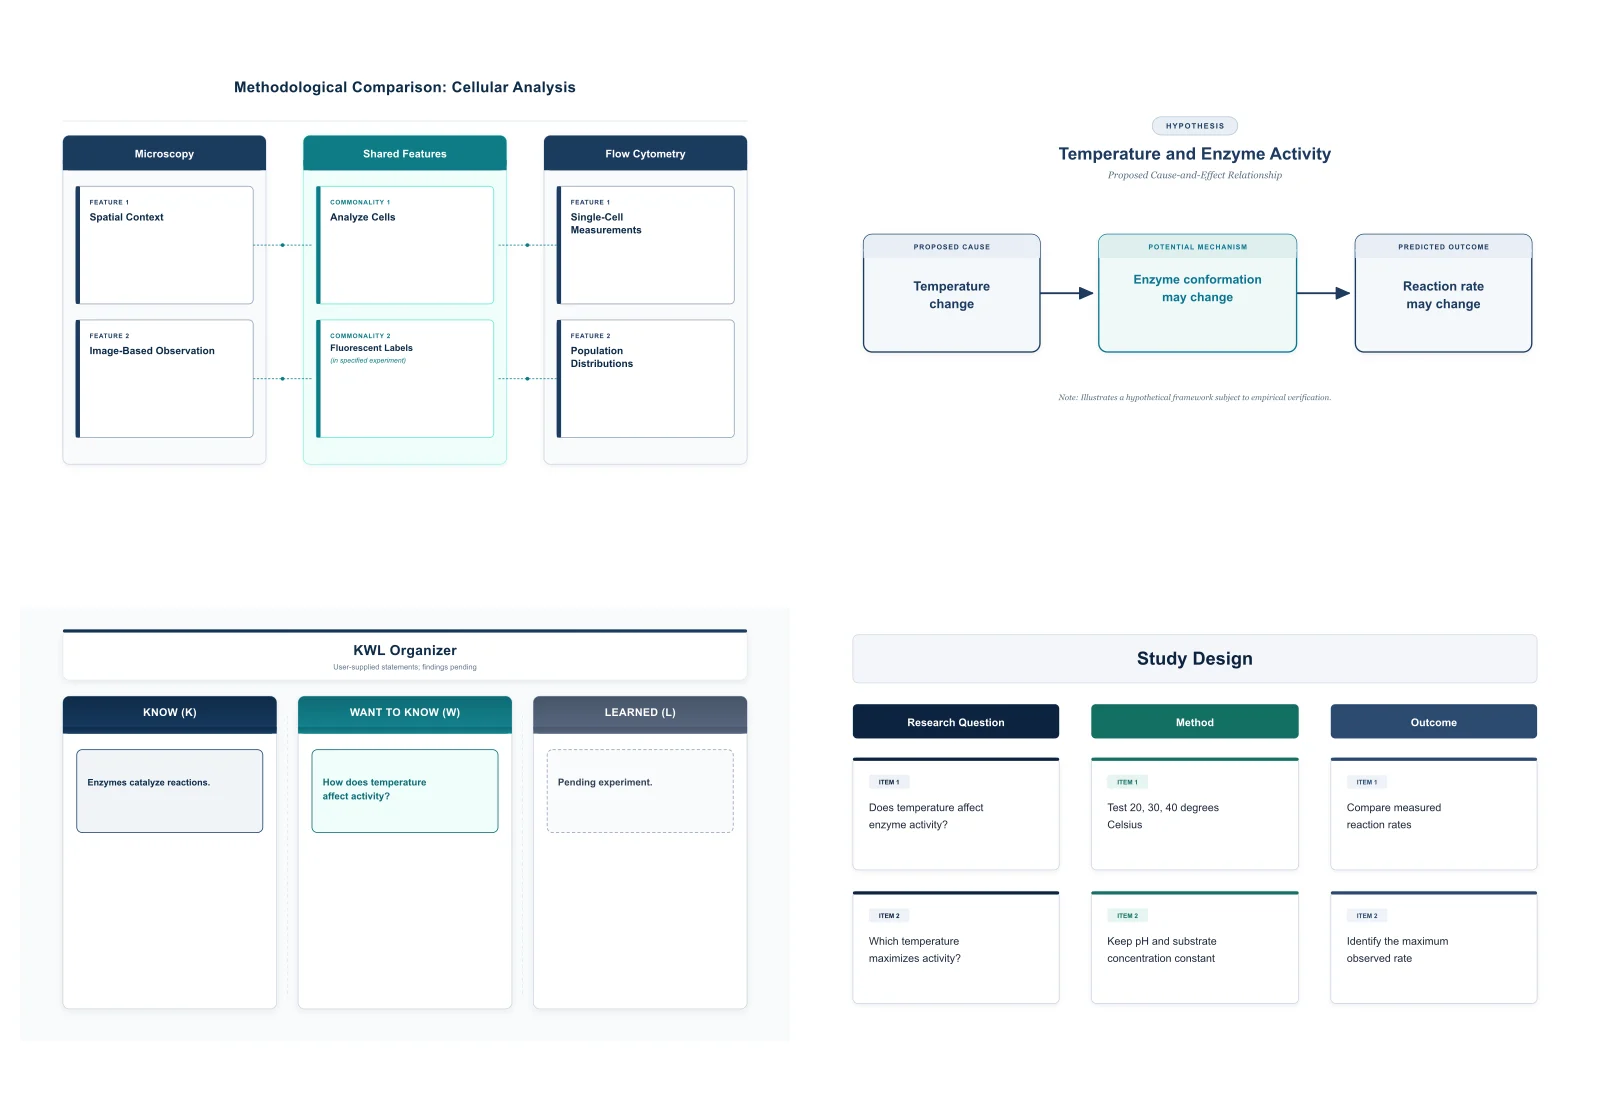
Montage of four accepted graphic organizer examples: comparison, cause-and-effect, KWL and study design

Build accessible teaching slides

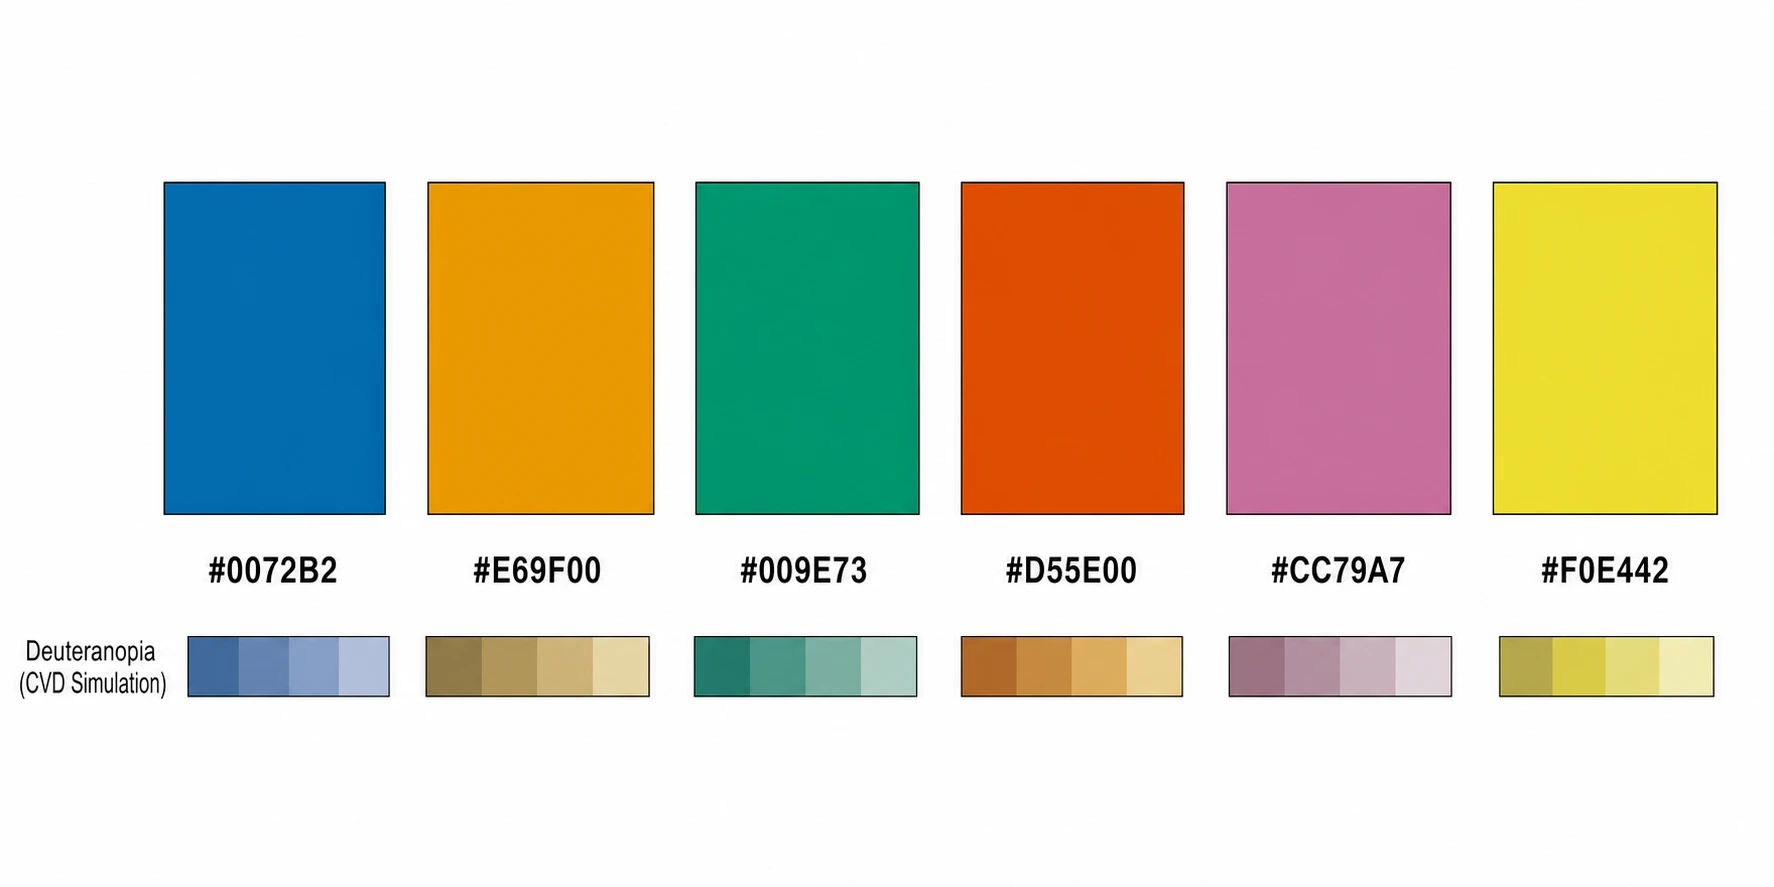
Keep labels concise and use a reading order that follows the explanation. A graphic organizer generator can turn the same notes into a diagram that fits on a slide or worksheet. Use clear contrast and enough spacing around each shape, and choose a layout that lets learners connect the spoken explanation with the same visual labels.

Explore this example
Graphic Organizer Scenarios

Illustrative ways to use the tool in a lesson, report or research discussion.
I would give the same criteria for microscopy and flow cytometry, then use the two columns to explain why a study might need both.

Alex R.

Teaching assistant

These are illustrative use scenarios with fictional names, not verified customer reviews.

Free tools

A tool for every scientific figure

94 focused generators for the scientific figure you need — each opens in the right workspace with a matching example.

Graphic Organizer Questions

1.

2.

3.

4.

5.

6.

Call to action background

Turn your explanation into a figure

Create Your Graphic Organizer

Create your figure

Free to start · No credit card required · Built for researchers