
Free CONSORT Trial Enrolment Flow Diagram Generator
Edit enrolment, allocation, follow-up, and analysis counts in a structured CONSORT draft, then export SVG or PNG without an account or upload.
Free editable participant-flow tool
Draft a CONSORT participant flow diagram
Edit enrolment, allocation, follow-up, and analysis counts in a structured visual draft, then export SVG or PNG without an account or upload.
Every number and label appears exactly as you type it. Edit freely, then match reporting decisions to your trial records and the current official CONSORT guidance before export.
Runs locally in your browser. No account, upload, or credits required.
Live participant flow preview
Updated
What is a trial enrolment flow?
A trial enrolment flow diagram generator turns participant counts and reasons into an editable visual for a randomized trial. For CONSORT diagram creation, enter the enrolment, allocation, follow-up and analysis figures from your trial records. For other layouts, SciFig FlowChart (flowcharts and diagrams) creates native SVG from your steps and counts.
CONSORT Flow Diagram Generator
- Structured draft, not a black box — the trial enrolment flow diagram generator exposes every participant count and reason as an editable field rather than inventing a diagram from an opaque prompt.
- Four reporting stages — organize enrollment, allocation, follow-up, and primary-outcome analysis in one connected participant flow diagram with clear trial-arm columns.
- Two to four arms — begin with parallel, drug-versus-placebo, or three-arm presets, then add a fourth comparison arm or rename any arm for the study design.
- Flexible reasons — add, remove, and edit pre-randomization exclusions, non-receipt reasons, follow-up losses, intervention discontinuations, and primary-analysis exclusions.
- Transparent values — the CONSORT flow diagram generator preserves contradictory totals instead of silently changing research data, leaving reconciliation and reporting judgment with the researcher.
- Private local output — every edit and export happens in the browser, with no account, credits, participant-data upload, or nondeterministic generation step.
Map Trial Enrolment and Allocation
- Start with eligibility — enter the population assessed and list each reason people were excluded before randomization, including separate counts for ineligibility, declining participation, or other documented causes.
- Record randomization once — use the randomized node as the shared branching point, then compare its value with the sum allocated across arms during your own source-data review.
- Describe allocation by arm — name the assigned intervention or comparator, enter the allocated count, and state how many participants actually received the assigned intervention.
- Separate follow-up events — distinguish people lost to follow-up from those who discontinued an intervention, and keep the reason wording specific to the trial record.
- Describe the primary analysis — enter the number analyzed for the primary outcome and list documented reasons for excluding randomized participants from that analysis.
- Use CONSORT diagram creation as an editorial pass — adjust labels for the protocol and analysis set, then inspect the full visual before exporting a publication draft.
Verify Counts, Exclusions, and Labels
- Check current official guidance — compare the draft with the applicable CONSORT participant-flow items and trial design rather than treating the template as a compliance certificate.
- Reconcile every transition manually — confirm assessed minus exclusions, randomized versus allocated totals, intervention receipt, follow-up outcomes, and analyzed counts against controlled source records.
- Audit reason categories — avoid vague buckets when a more informative, non-identifying reason is available, and ensure that one participant is not counted twice within the same transition.
- Label the analysis population — make clear whether the displayed count refers to the primary outcome analysis and document any exclusions using language consistent with the trial report.
- Keep PRISMA separate — use the linked PRISMA flow diagram generator for systematic-review records and studies; this page is specifically for randomized-trial participants.
- Export for review — download SVG for later vector editing or PNG for comments and slides, then complete scientific, statistical, accessibility, and journal checks outside this drafting tool.
Free CONSORT Trial Enrolment Flow Diagram Generator — Frequently Asked Questions
Common questions about Free CONSORT Trial Enrolment Flow Diagram Generator.
More tools
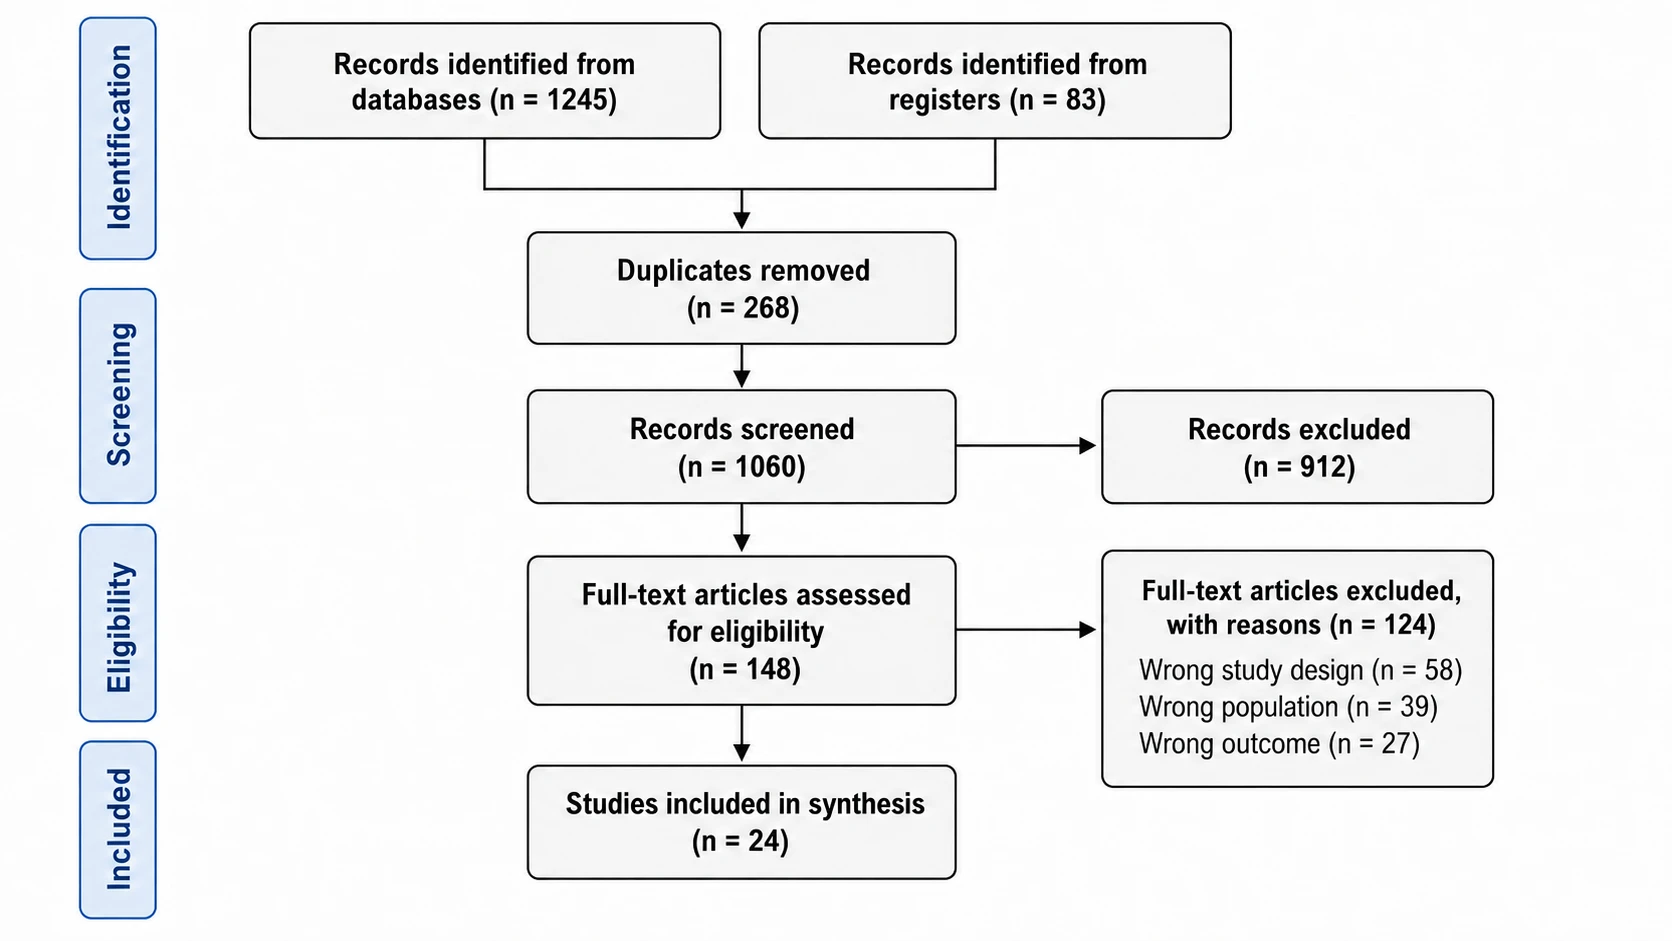
PRISMA Flow Diagram Generator
Chart your systematic review screening

Circuit Diagram Maker
Draw electronic circuit schematics

Free Body Diagram Generator
Show forces acting on an object
SciFig
Free AI Scientific Figure Generator for Illustrations, Images, Charts and Flowcharts
Models
Default to GPT Image 2 for journal papers; switch to Nano Banana Pro for slides and posters; pick Nano Banana 2.1 for routine figure work
Tutorials
Seven short walkthroughs of the AI scientific figure generator
Blog
Tutorials, tool comparisons, and publication tips for researchers.
Inspiration
Explore publication-ready illustrations, charts and flowcharts. Copy a prompt or open any template as the starting point for your own figure.
Pricing
View pricing

Ready to publish?
Make your own trial enrolment flow in minutes.
Start for freeFree to start · No credit card required · Built for researchers