
Free Fishbone Diagram Generator
Map every possible cause of a problem onto one clean Ishikawa spine — categories as major bones, contributing factors as branches, ready for a report or poster.
Start with up to 150 free credits|No credit card required
Get up to 350 free credits on day one when you join through an invite.
Updated
Free Fishbone Diagram Generator— templates & examples
Everything you need to build a clear fishbone diagram
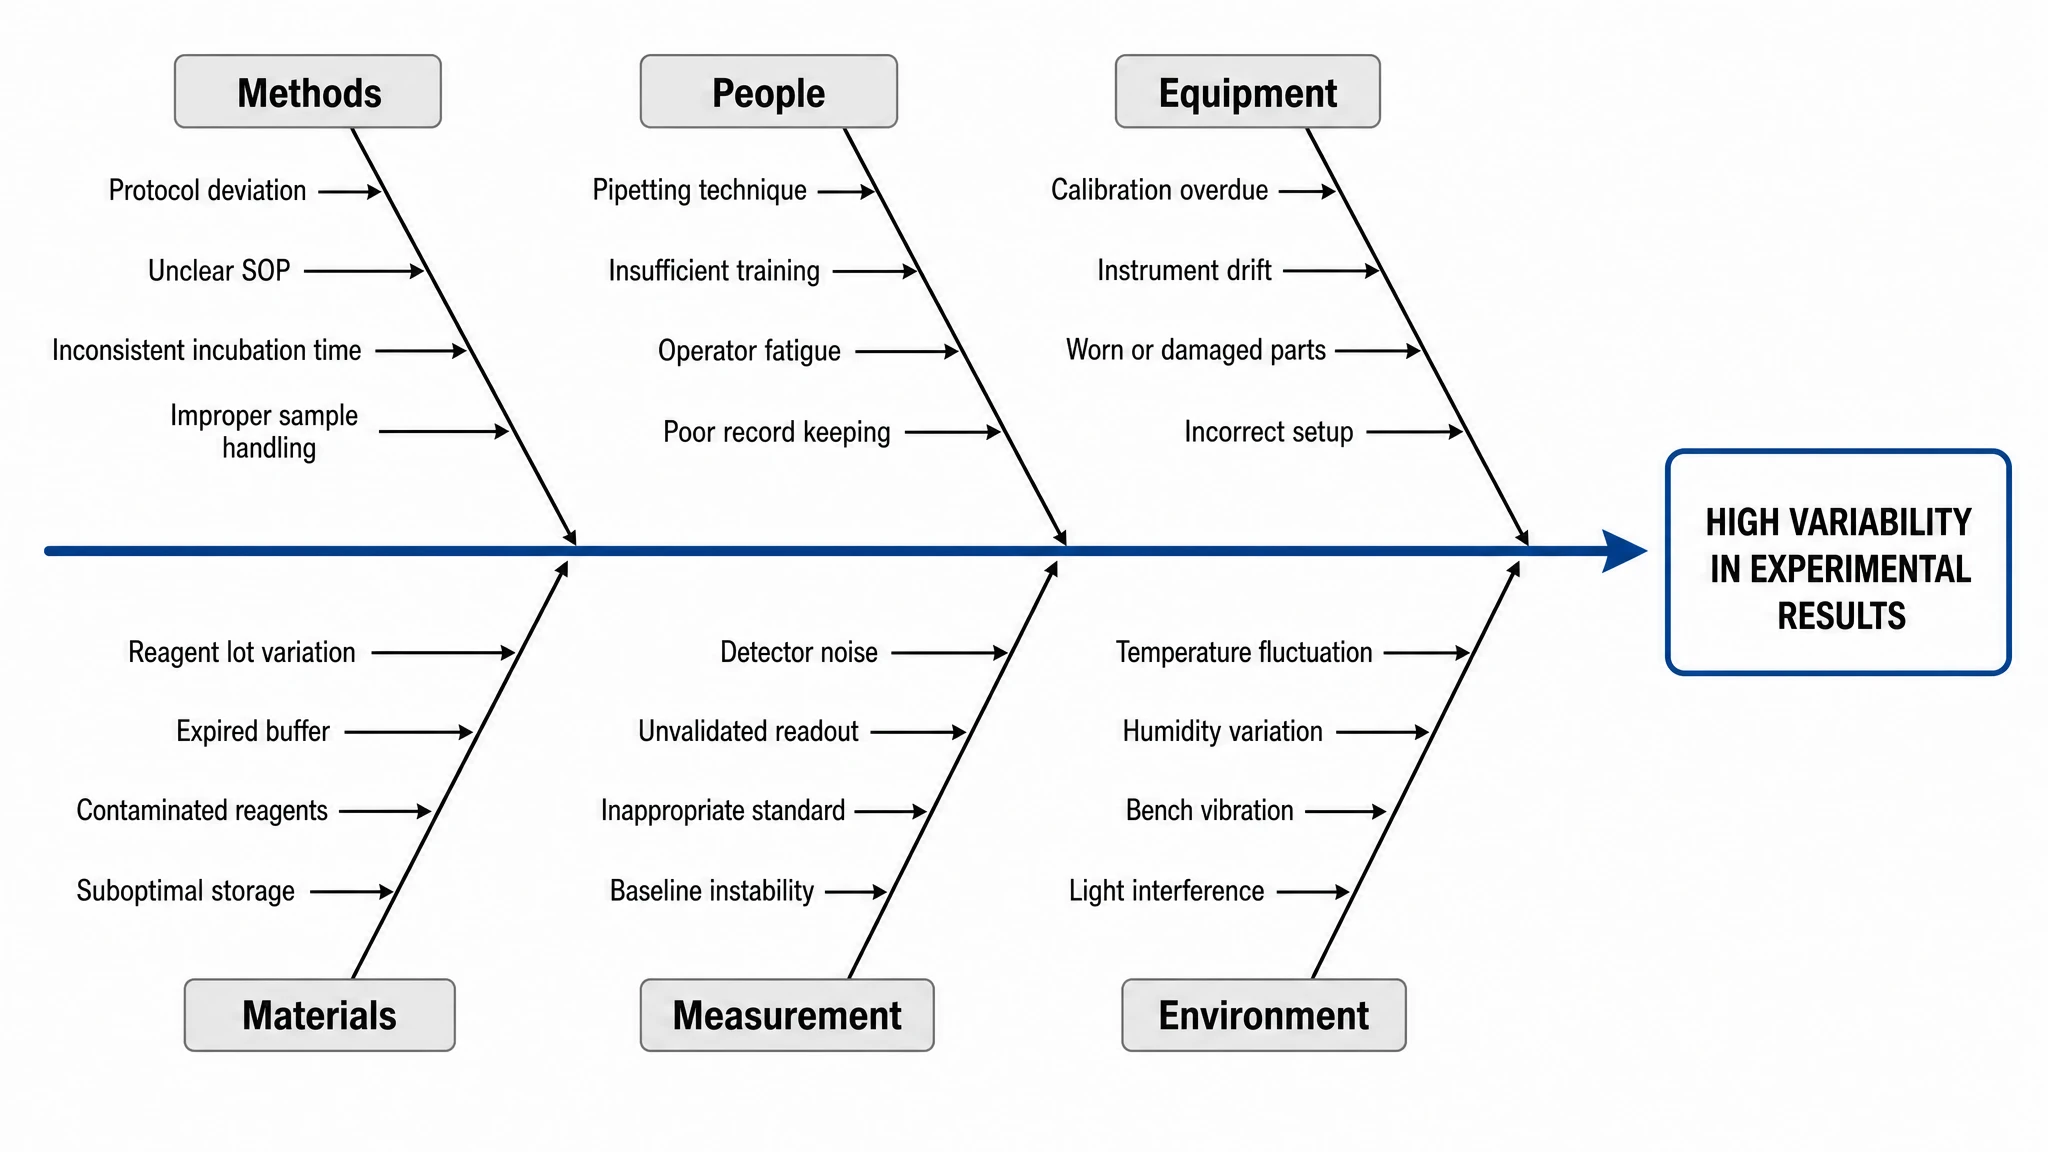
Lay out the spine, categories, and sub-causes
The value of an ishikawa diagram generator is that layout stops being the bottleneck. SciFig places the problem statement at the head, spaces the major category bones evenly along the spine, and keeps sub-cause branches legible however many you add — so a brainstorming session stays about causes, not about spacing.
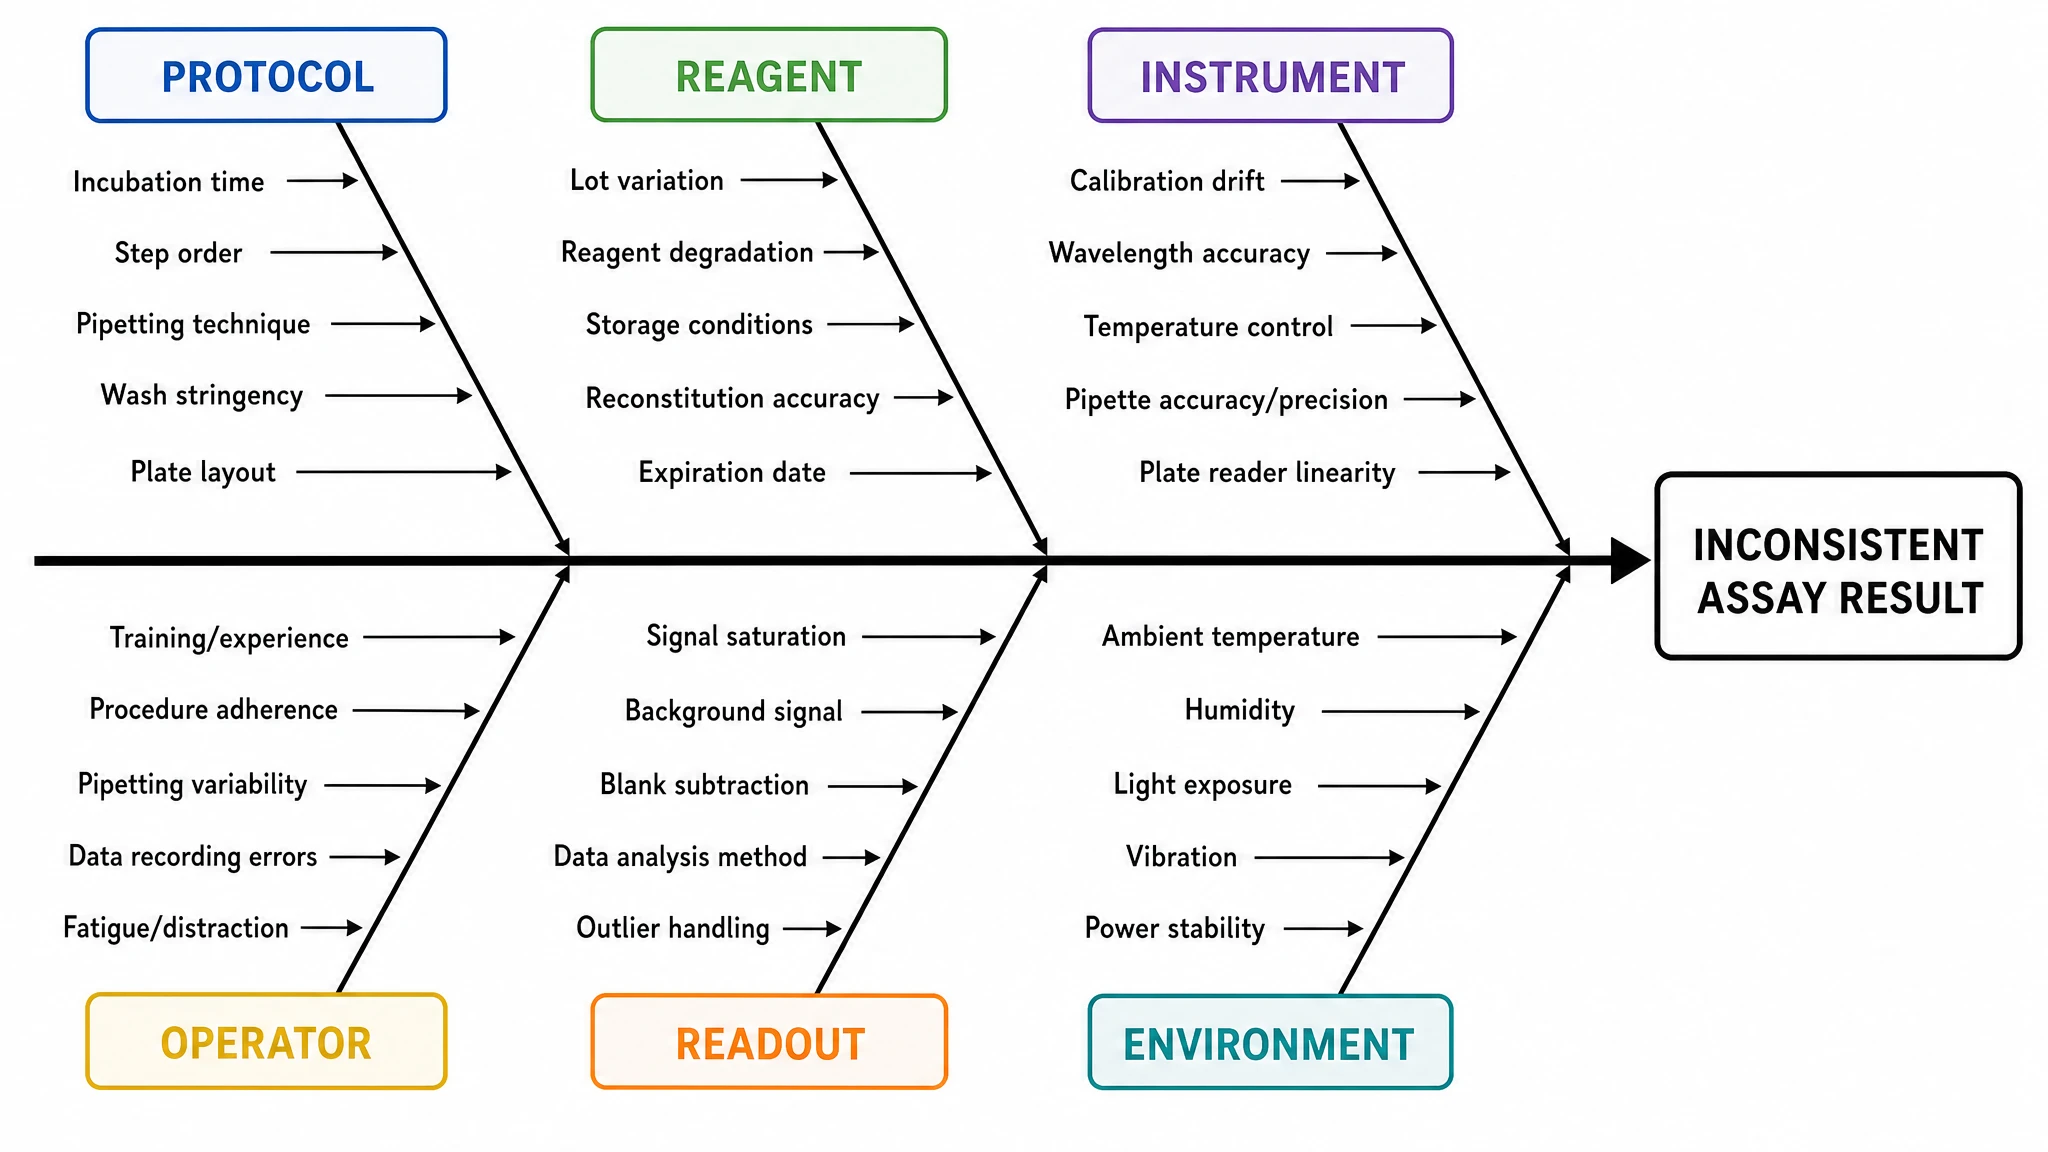
Rename categories for lab and research use
The manufacturing 6Ms rarely fit a failed assay. Use a fishbone generator that lets you swap in protocol, reagent, instrument, operator, readout, and environment instead, so an irreproducibility investigation reads in the language your lab actually uses.
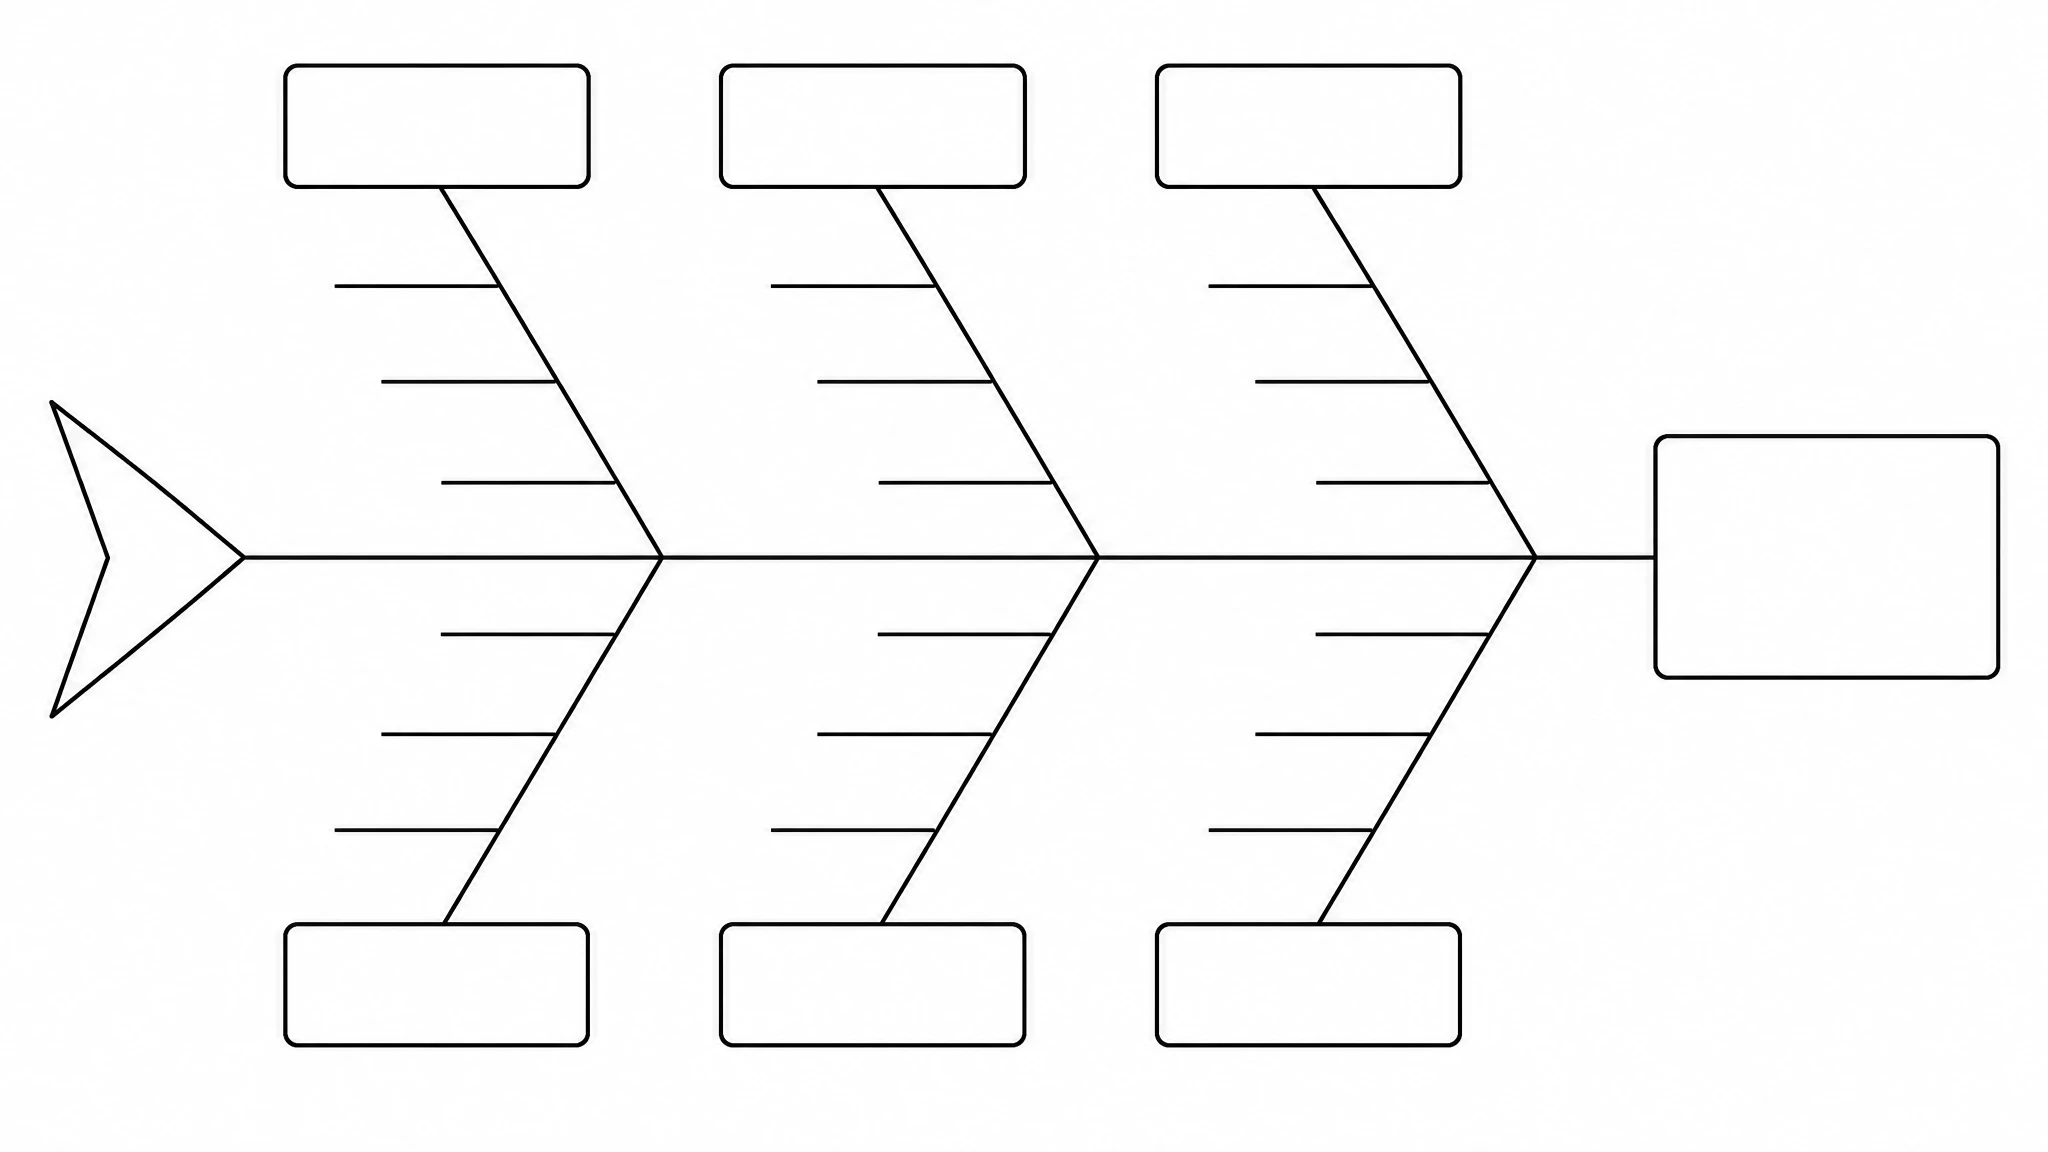
Export charts for reports, posters, and audits
Use this free fishbone diagram maker to produce a chart that fits a quality report, a CAPA record, or a conference poster panel. Exports come out at publication resolution with editable text, so you can update a cause after the investigation progresses.
What is a fishbone diagram?
A fishbone diagram is a cause-and-effect chart that puts a problem statement at the head of a horizontal spine and branches the possible causes off it as angled bones, grouped by category. Grouping forces a team to look beyond the first explanation and consider method, equipment, materials, people, environment, and measurement in turn. With SciFig's fishbone diagram generator you describe the problem and its contributing factors and get a clean, readable chart you can edit and export.
Why you need a fishbone diagram
- Force a team past its first assumption toward the full space of possible causes
- Group candidate causes into categories so blind spots become visible
- Give a structured record of an investigation for audits and quality systems
- Turn a vague complaint into a precisely stated problem at the head of the spine
- Identify which causes are worth testing experimentally before spending bench time
- Support root cause analysis requirements in CAPA and quality management workflows
Key components of a fishbone diagram
- Problem statement — the effect being investigated, written at the head of the spine
- Spine — the horizontal backbone running from the categories to the problem
- Major bones — the four to six cause categories angled off the spine
- Sub-causes — the smaller branches naming specific contributing factors
- Category labels — the headings such as method, equipment, or reagent
- Highlighted root cause — the branch marked once evidence points to a likely origin
Where fishbone diagrams are used
- Lab investigations into failed, contaminated, or irreproducible experiments
- Quality management and CAPA records in regulated laboratories
- Manufacturing and process engineering defect analysis
- Clinical audit and patient safety incident reviews
- Continuous improvement and six sigma training materials
- Project retrospectives and team problem-solving workshops
How to make a fishbone diagram
Describe the structure
Describe the steps, groups, and connections, or start from a suitable SciFig FlowChart template.
Generate the diagram
SciFig FlowChart creates a native SVG diagram — edit any label, connection or count directly.
Edit and export
Edit SVG elements and export SVG, PNG, JPG or PPTX. PPTX includes the diagram visual and editable text where supported.
Free Fishbone Diagram Generator — Frequently Asked Questions
Common questions about Free Fishbone Diagram Generator.
More tools

Circuit Diagram Maker
Draw electronic circuit schematics

Free Body Diagram Generator
Show forces acting on an object

Graphical Abstract Maker
Summarize your study in one panel
SciFig
Free AI Scientific Figure Generator for Illustrations, Images, Charts and Flowcharts
Models
Default to GPT Image 2 for journal papers; switch to Nano Banana Pro for slides and posters; pick Nano Banana 2.1 for routine figure work
Tutorials
Seven short walkthroughs of the AI scientific figure generator
Blog
Tutorials, tool comparisons, and publication tips for researchers.
Inspiration
Explore publication-ready illustrations, charts and flowcharts. Copy a prompt or open any template as the starting point for your own figure.
Pricing
View pricing

Ready to publish?
Make your own fishbone diagram in minutes.
Start for freeFree to start · No credit card required · Built for researchers