
Volcano Plot Generator Free
Try the volcano plot generator free with effect sizes and p-values. SciFig DataChart (data-driven charts) plots your table; customize thresholds and labels, then export.
Start with up to 150 free credits|No credit card required
Get up to 350 free credits on day one when you join through an invite.
Updated
Volcano Plot Generator Free— templates & examples
A volcano plot maker for clear scientific explanations
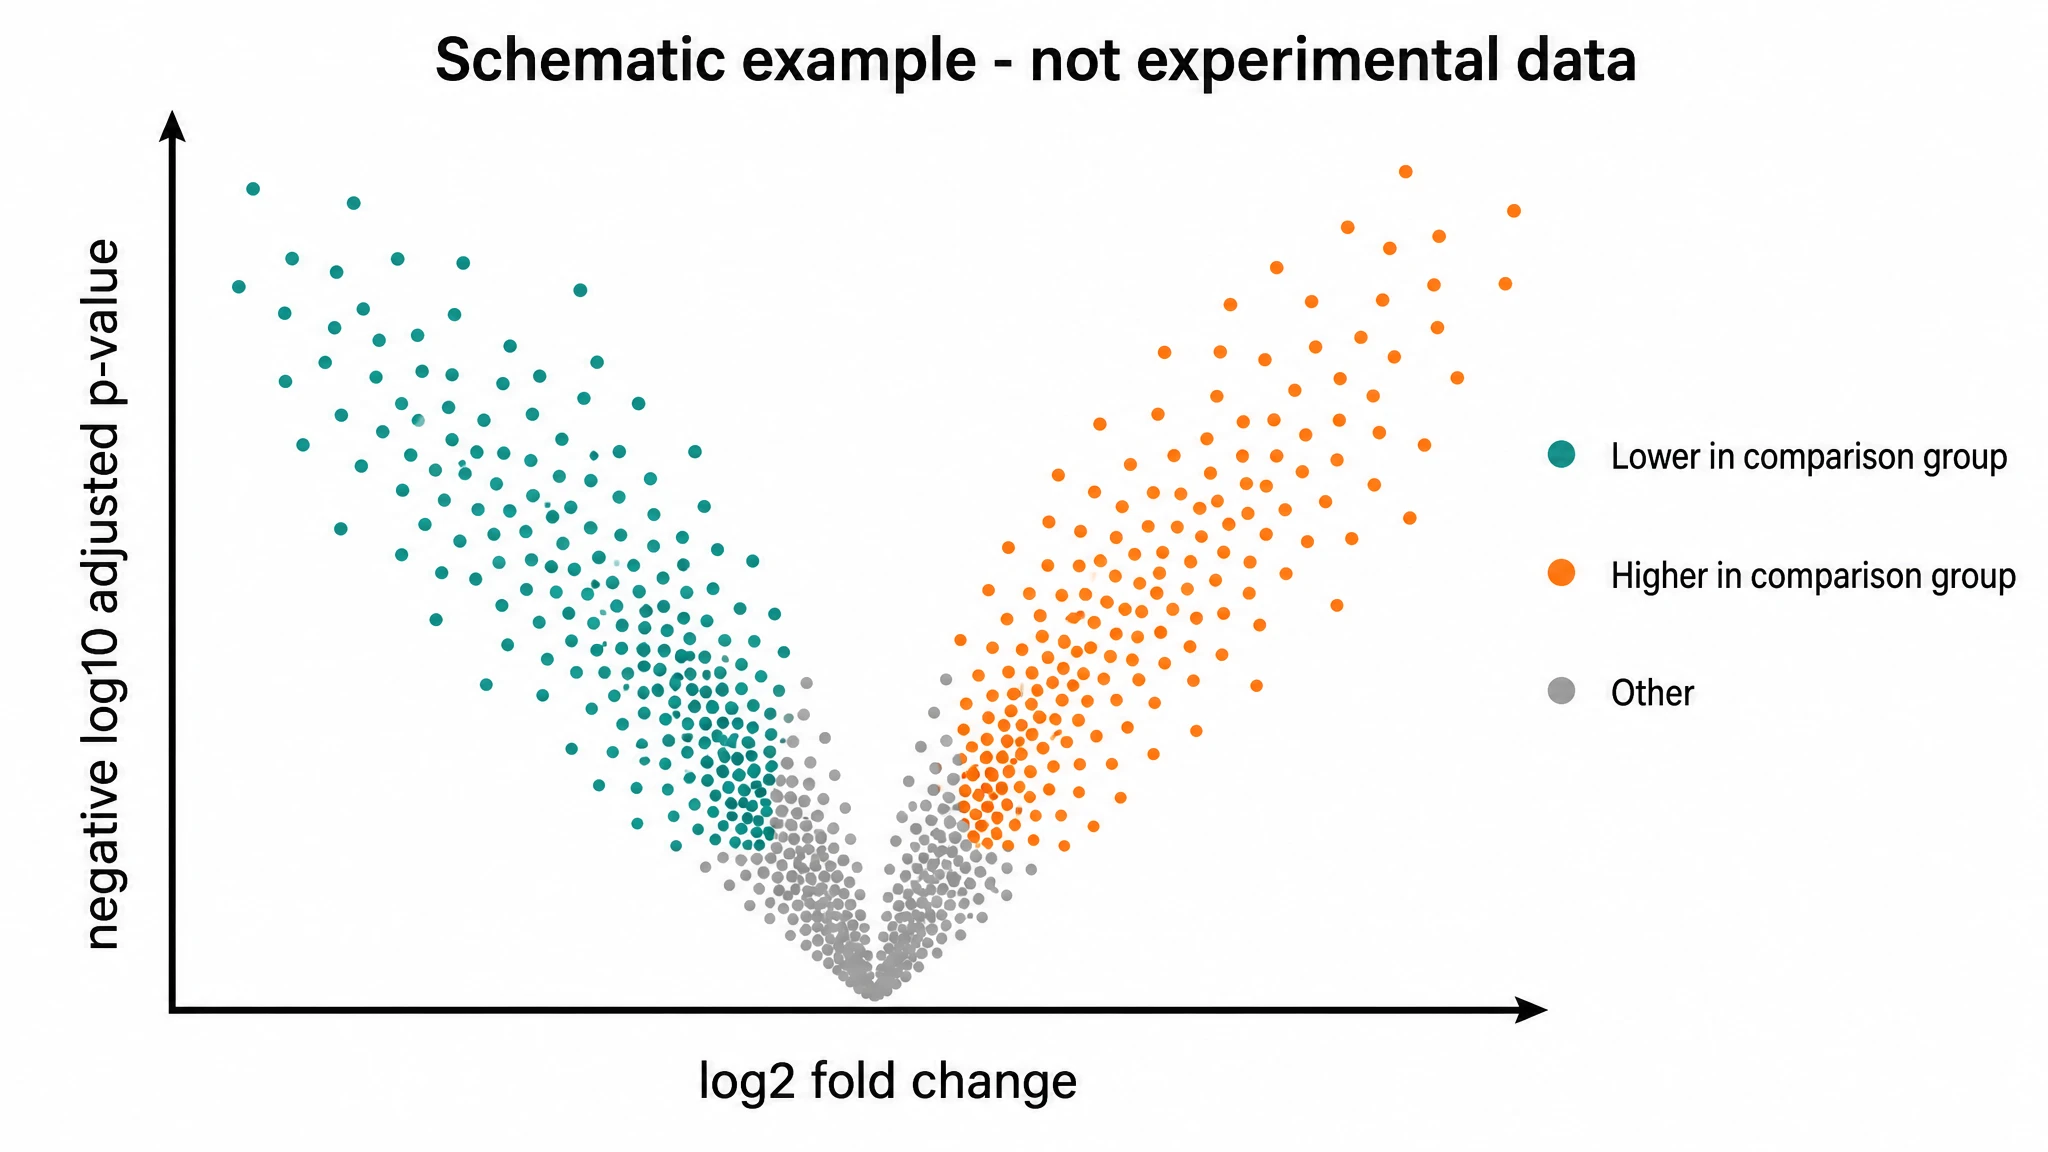
Explain axes and comparison direction
Try the volcano plot generator free with effect sizes and p-values from your statistical analysis. Open SciFig DataChart (data-driven charts) in SciFig and it plots from that table.
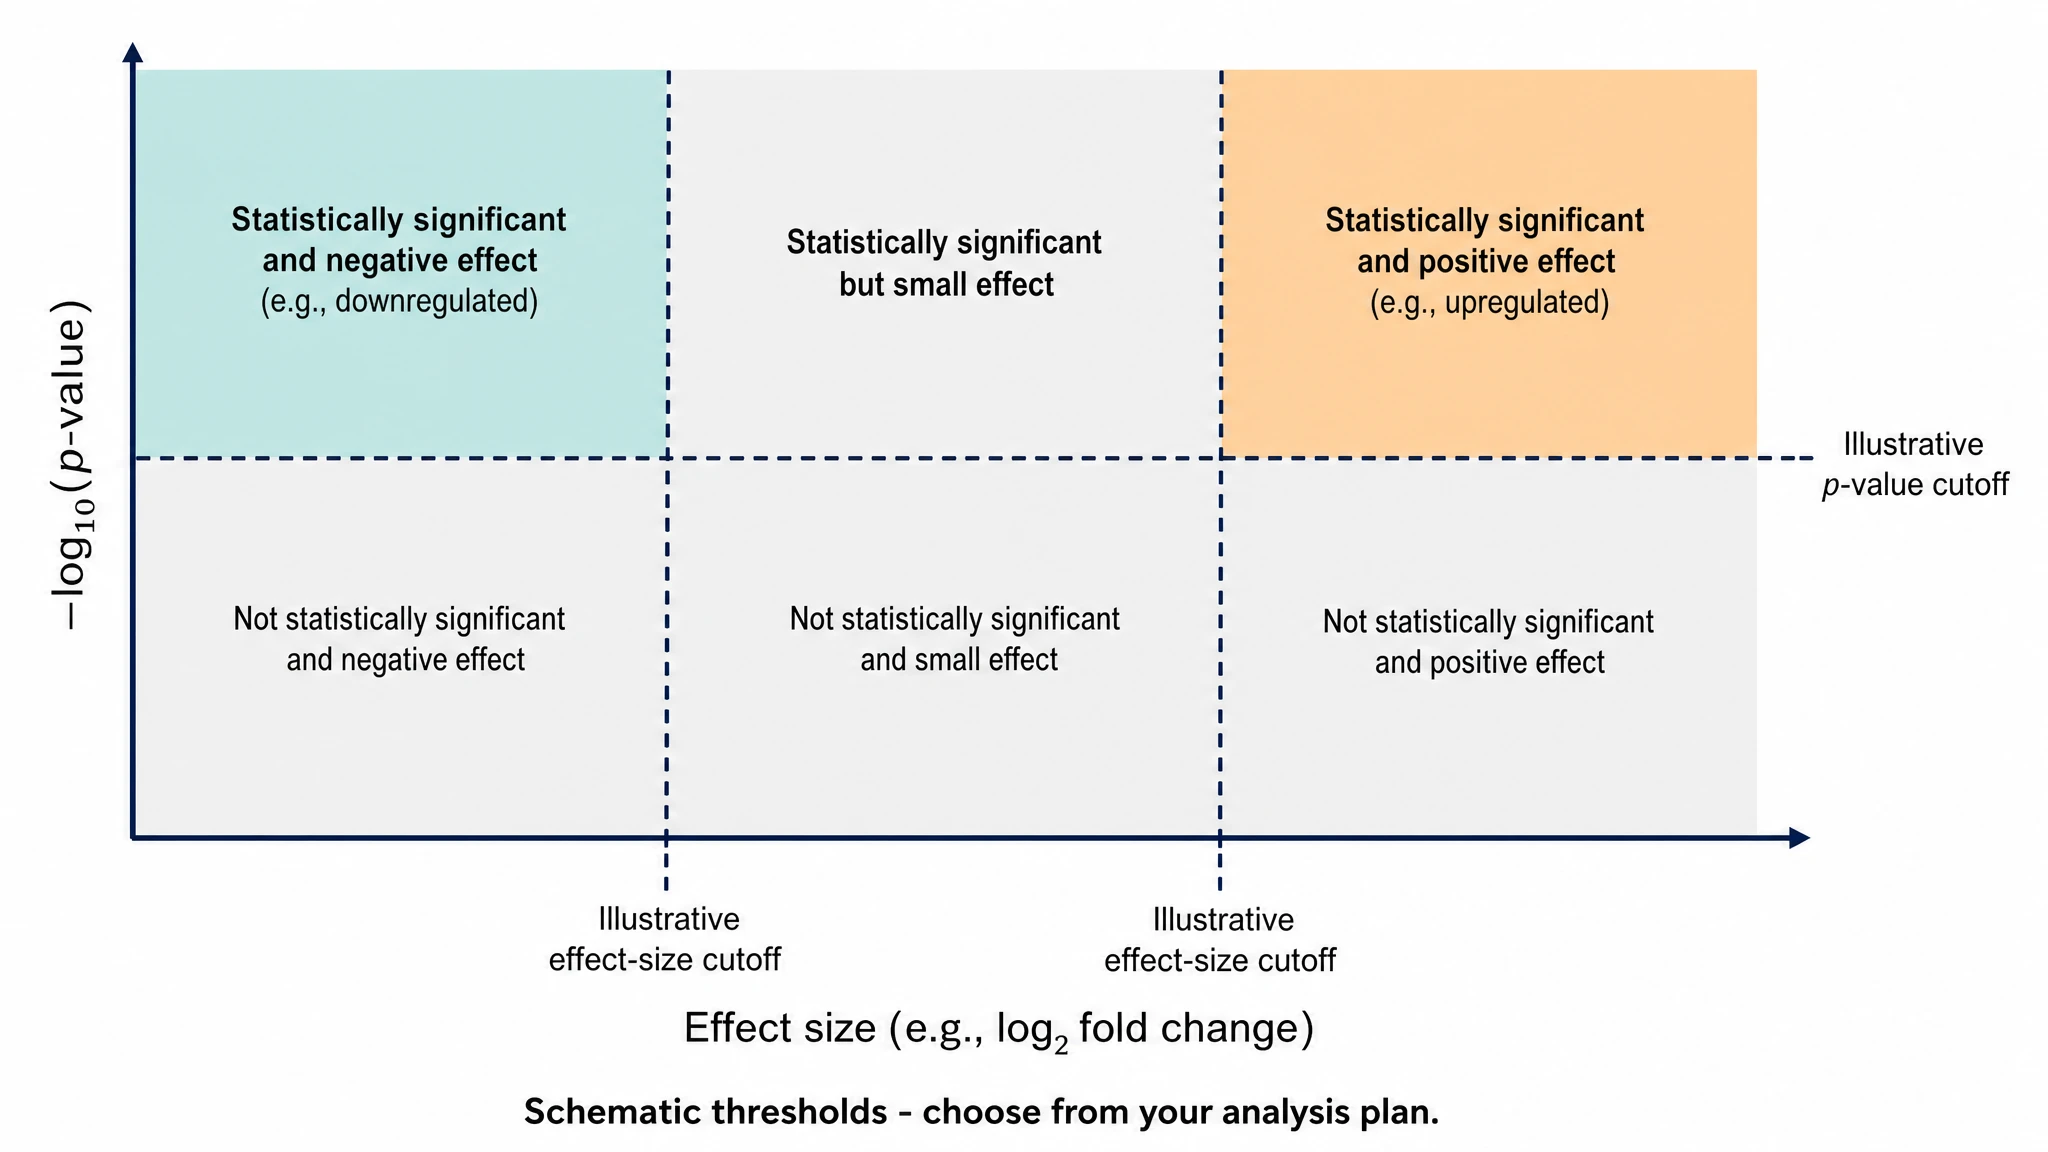
Show threshold regions without inventing results
A volcano plot online tool can help illustrate how effect-size and significance criteria divide a diagram into regions. Give SciFig explicit educational labels and keep the example separate from experimental evidence. Thresholds in an actual analysis must come from your method, not from the generated picture.
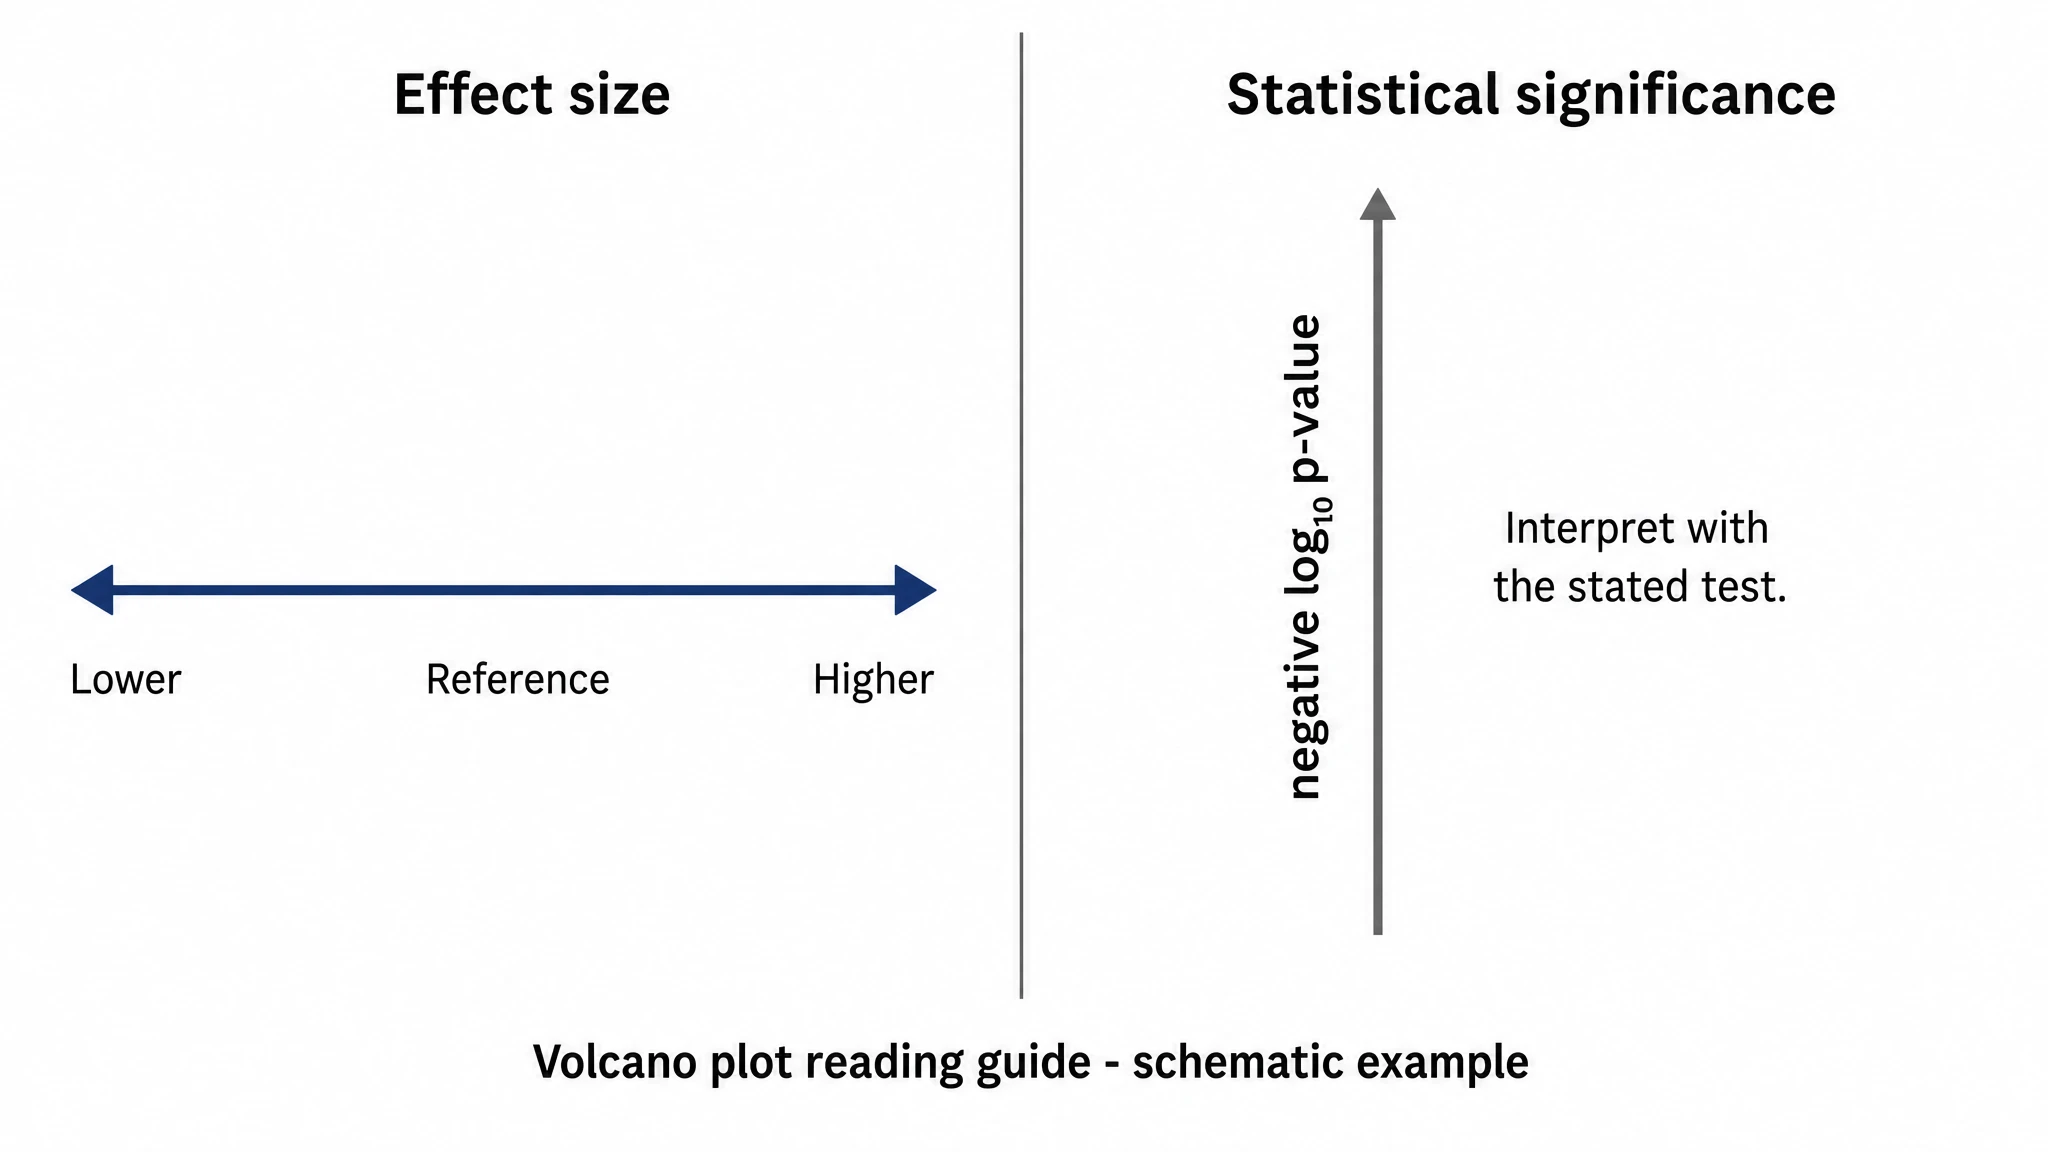
Prepare a teaching or presentation schematic
Build an explanatory visual for a methods lecture, a lab discussion, or a guide to reading differential-expression results. SciFig DataChart plots every point from your statistical software output, and you can edit the labels before exporting PNG, PDF, EPS or TIFF.
What is a volcano plot?
A volcano plot displays effect size against statistical significance, usually log2 fold change on the horizontal axis and negative log10 of a stated p-value on the vertical axis. Upload your effect-size and p-value table to SciFig DataChart (data-driven charts), map the columns and select thresholds and labels to create the plot. Try the volcano plot generator free.
Why illustrate a volcano plot?
- Connect effect size and significance in one explanatory figure
- Show why a small p-value and a large fold change answer different questions
- Make the numerator and reference group visible to readers
- Explain the distinction between adjusted and unadjusted p-values
- Introduce threshold regions before discussing a real analysis
Key components of a volcano plot
- Horizontal axis: the stated effect-size measure, commonly log2 fold change
- Vertical axis: negative log10 of the explicitly named p-value measure
- Points: genes, proteins, or other tested features in a data-derived plot
- Threshold lines: analysis-specific cutoffs, or labeled educational examples
- Colour legend: the exact criteria defining each highlighted region
- Annotations: selected feature names only when supported by the underlying data
Where explanatory volcano plots help
- Teaching how differential-expression results are read
- Explaining fold-change direction in a lab meeting
- Comparing effect-size and significance criteria in a methods guide
- Introducing RNA-seq or proteomics visualisation concepts
- Pairing an overview with an experimental workflow diagram that explains the preceding procedures
How to make a volcano plot
Upload your table
Upload a CSV or Excel file with the measurements and column names needed for your chart.
Set up the chart and analysis
Choose a chart type, then set the column mapping, units, filters and statistical options; SciFig DataChart plots every value from your table.
Download your results
Export the chart and analysis files, or convert the result to SVG for editing in SciFig Vector Canvas.
Volcano Plot Generator Free — Frequently Asked Questions
Common questions about Volcano Plot Generator Free.
More tools

Circuit Diagram Maker
Draw electronic circuit schematics

Free Body Diagram Generator
Show forces acting on an object

Graphical Abstract Maker
Summarize your study in one panel
SciFig
Free AI Scientific Figure Generator for Illustrations, Images, Charts and Flowcharts
Models
Default to GPT Image 2 for journal papers; switch to Nano Banana Pro for slides and posters; pick Nano Banana 2.1 for routine figure work
Tutorials
Seven short walkthroughs of the AI scientific figure generator
Blog
Tutorials, tool comparisons, and publication tips for researchers.
Inspiration
Explore publication-ready illustrations, charts and flowcharts. Copy a prompt or open any template as the starting point for your own figure.
Pricing
View pricing

Ready to publish?
Make your own volcano plot in minutes.
Start for freeFree to start · No credit card required · Built for researchers