
Free Experimental Workflow Diagram
Turn your methods into an experimental workflow diagram: describe the samples, controls and readouts, and SciFig FlowChart lays them out as a native, editable SVG.
Start with up to 150 free credits|No credit card required
Get up to 350 free credits on day one when you join through an invite.
Updated
Free Experimental Workflow Diagram— templates & examples
Build an experimental workflow figure straight from your methods
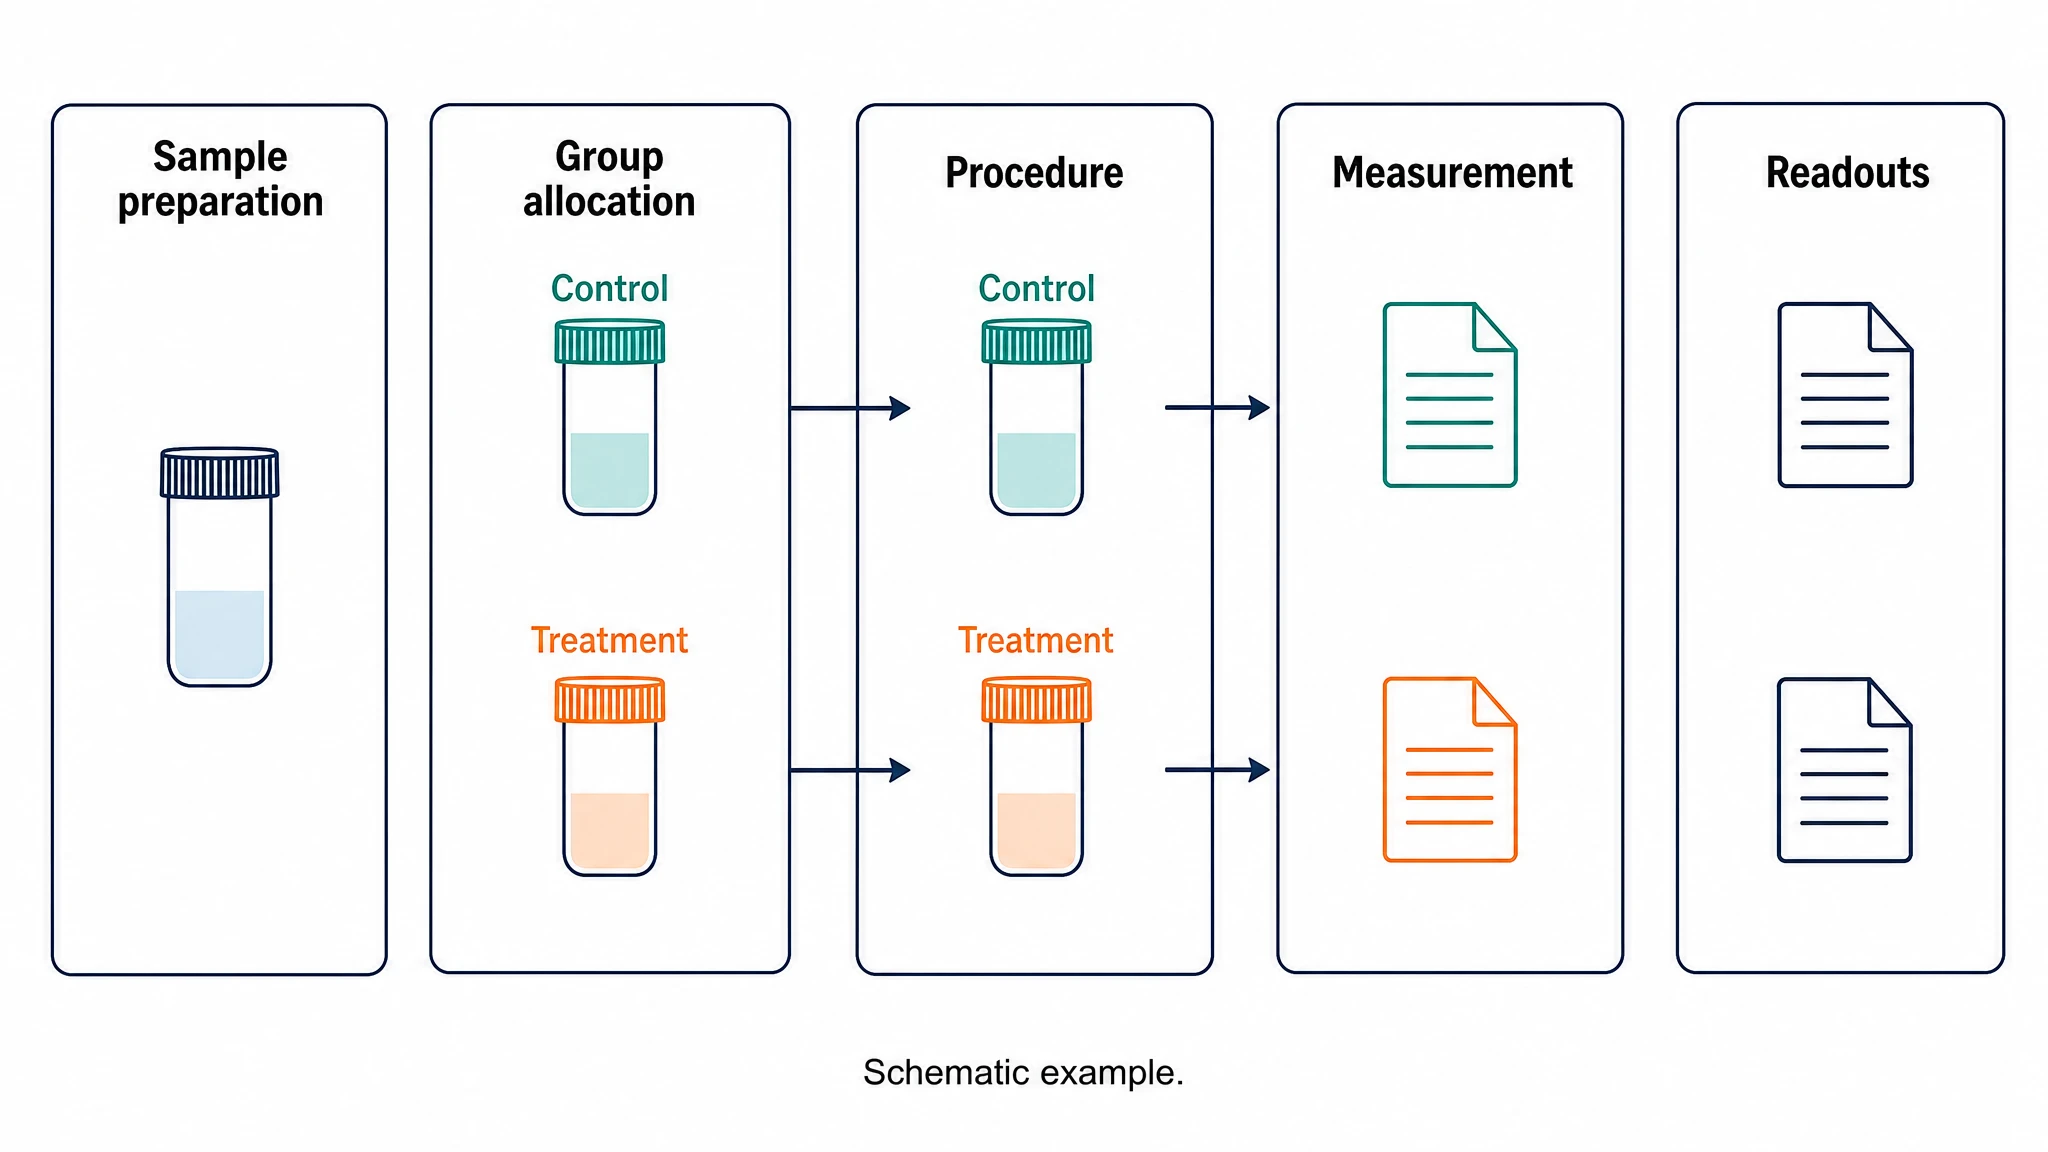
Connect inputs, procedures, and readouts
Start with a short outline that names what enters and leaves each stage. SciFig turns that description into an experimental workflow figure you can edit node by node. Keep the operation and its measured output distinct so the diagram explains the logic instead of merely listing equipment or decorative laboratory icons.
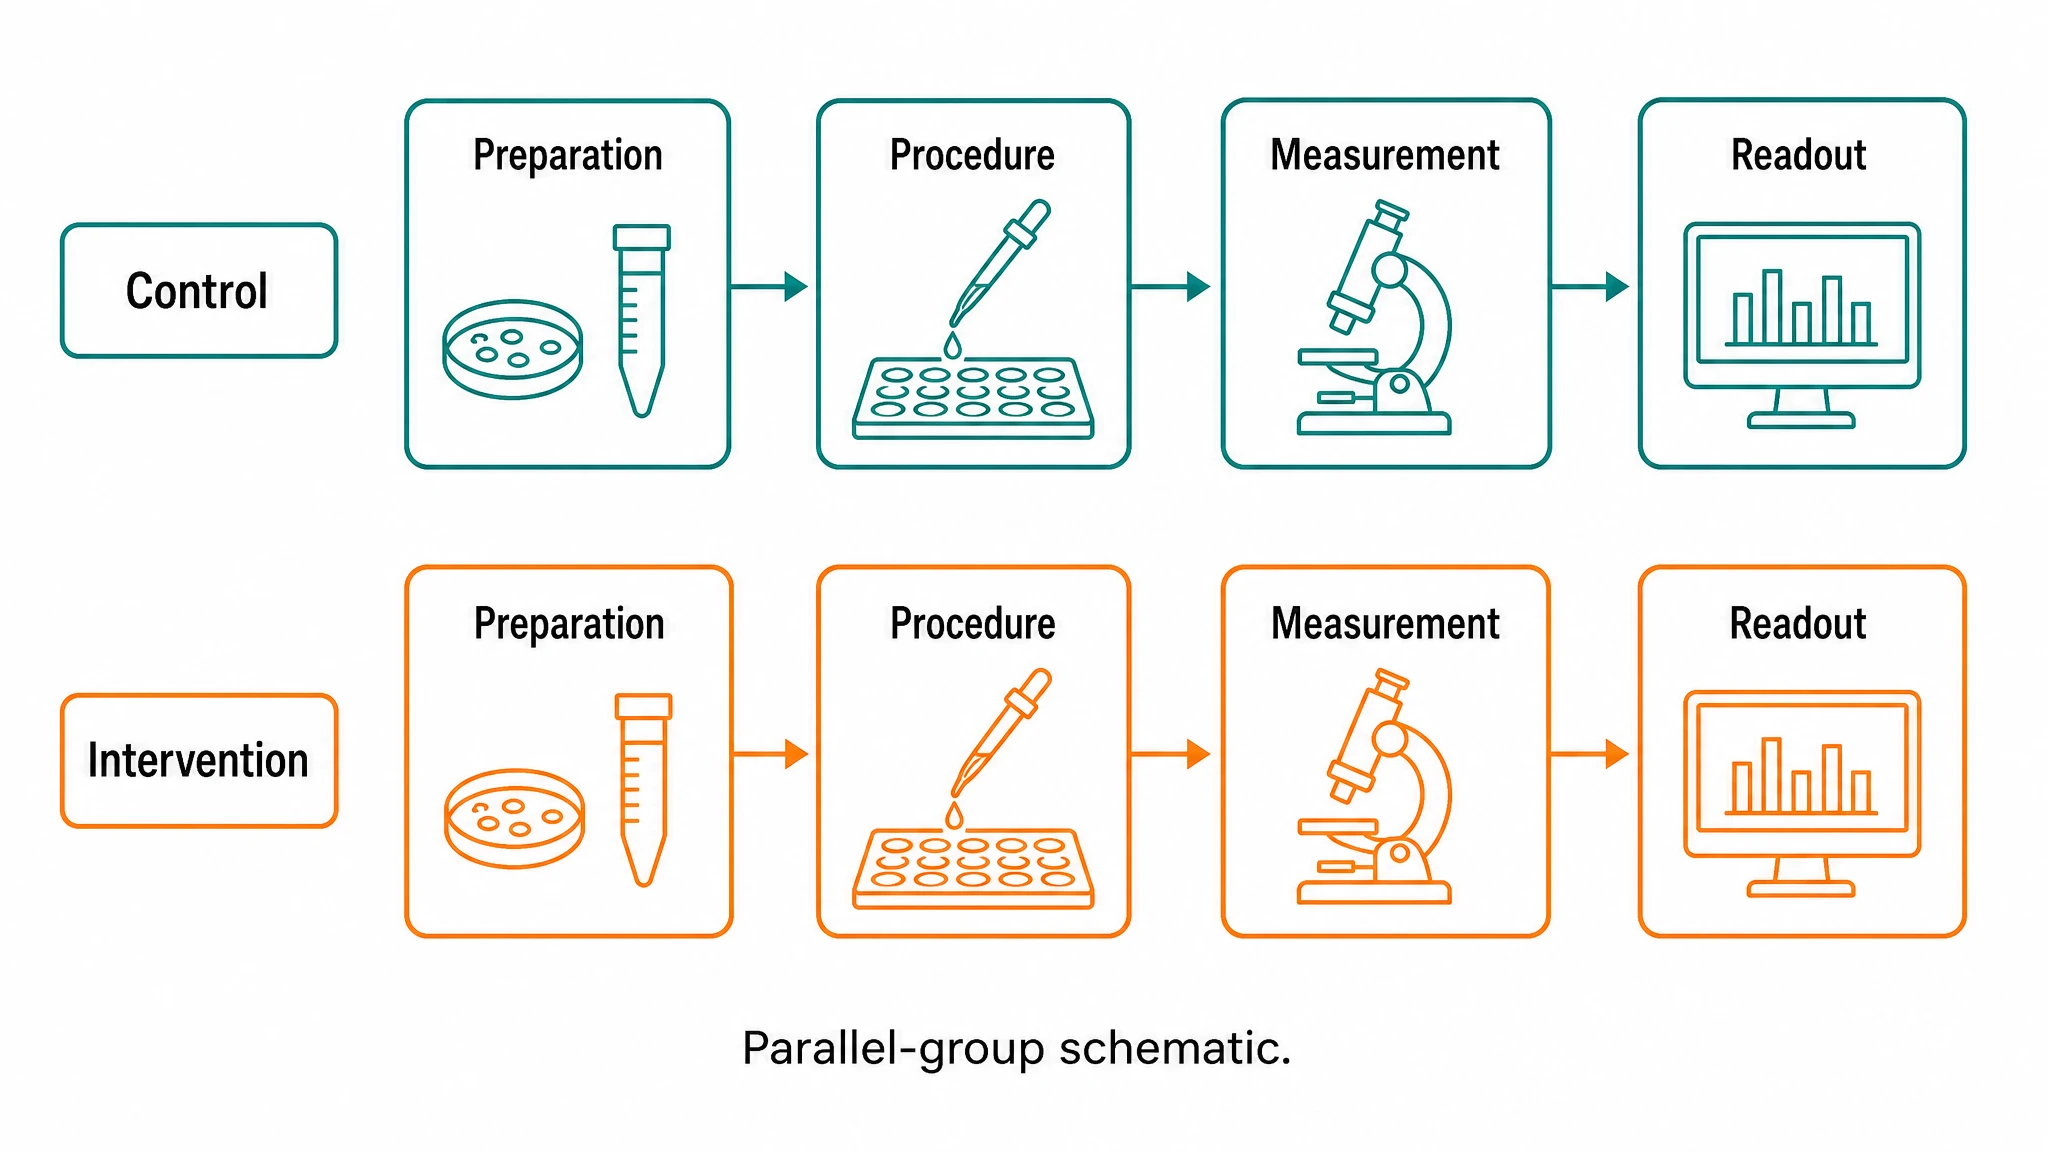
Make groups and branches readable
A research workflow diagram needs clear boundaries between shared preparation, separate groups, and genuine decisions. Describe those relationships explicitly, including the control path. SciFig FlowChart keeps every arrow and label editable in the SVG, so you can fix any unintended convergence before refining colour or spacing.
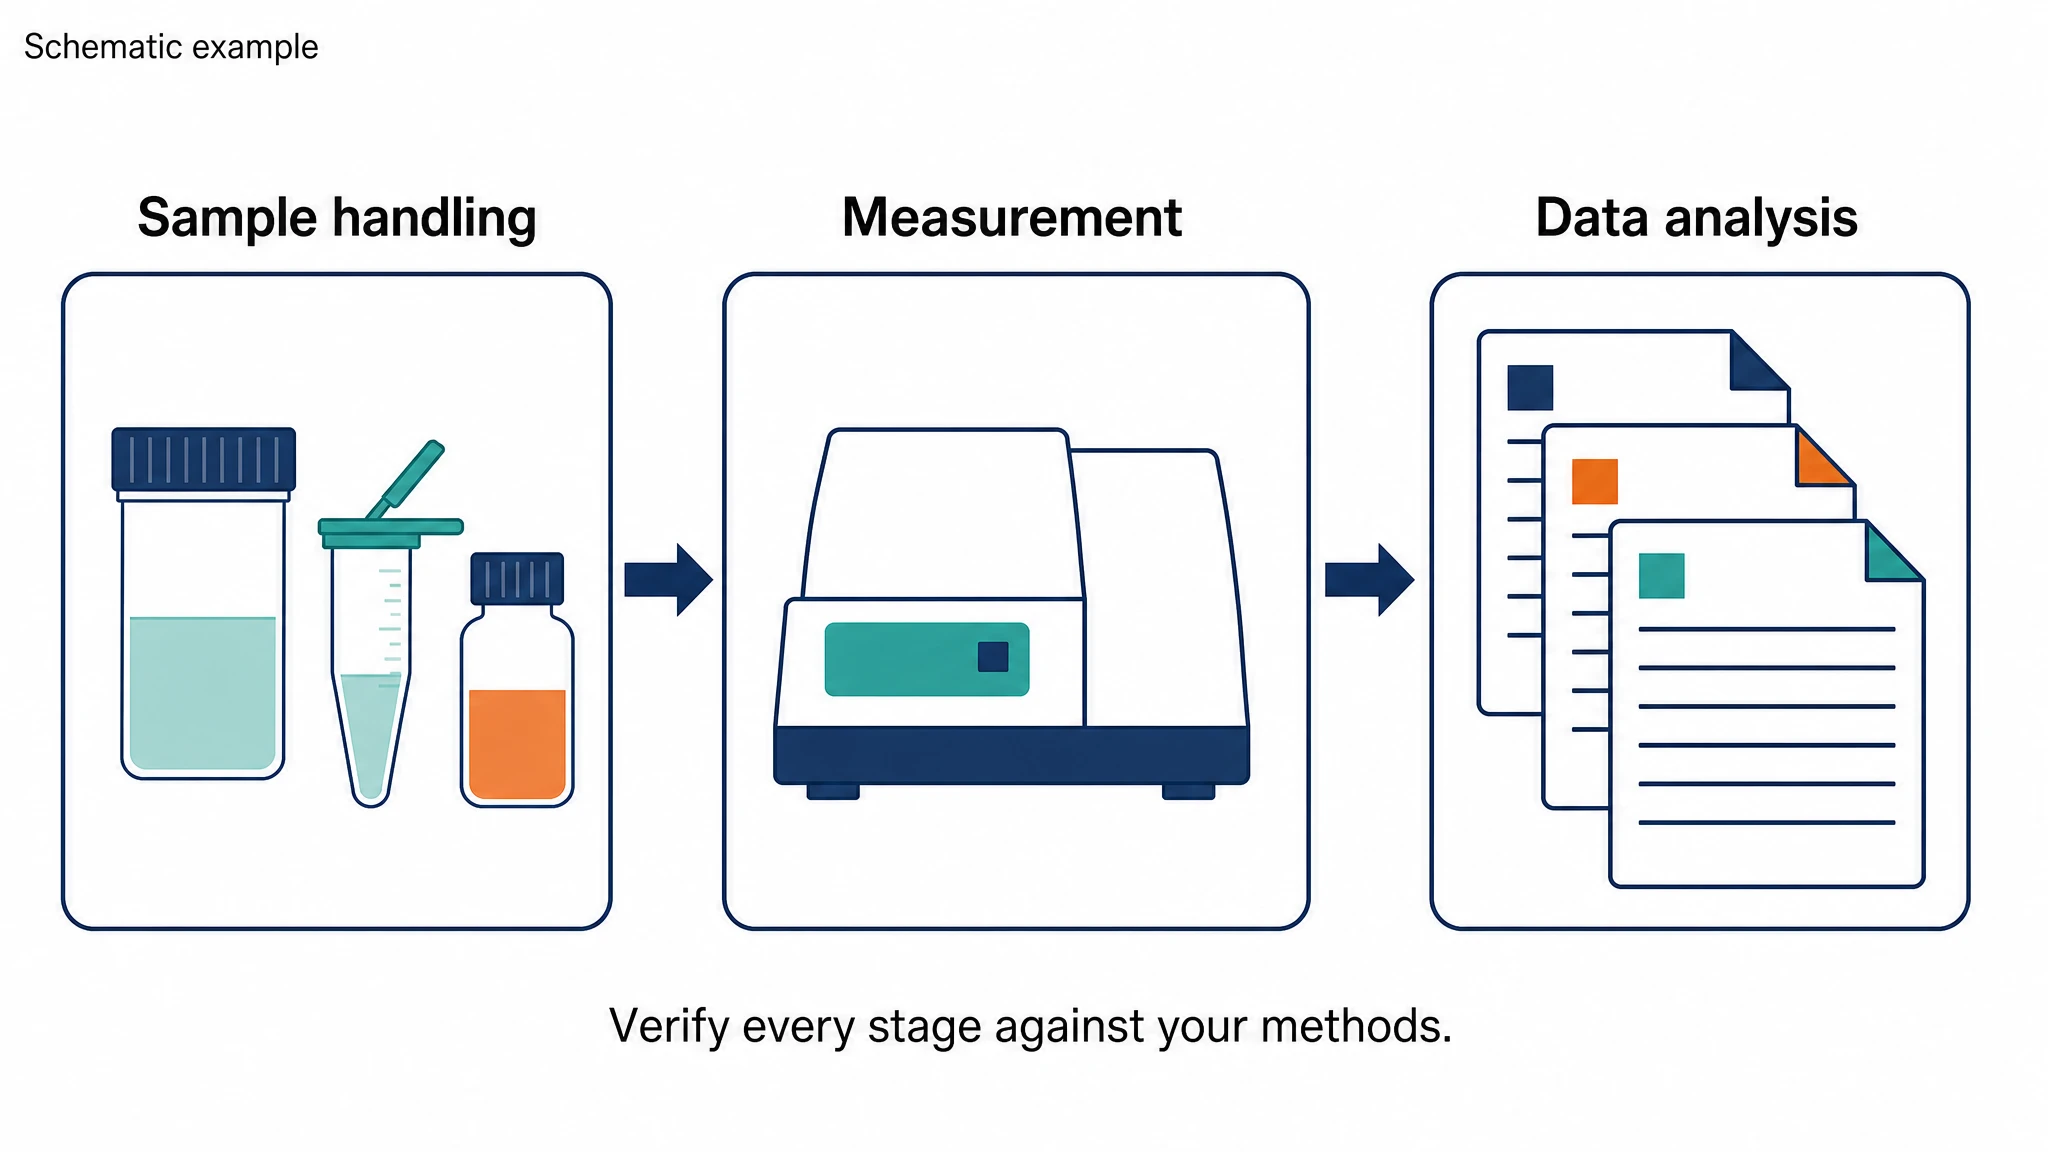
Refine and explain the finished schematic
Refine the labels and layout of your workflow in the SciFig FlowChart editor or by AI request. Use the methods figure flowchart guide to plan layouts and captions, then export SVG, PNG, JPG or PPTX at the size your manuscript or slides need.
What is an experimental workflow diagram?
An experimental workflow diagram shows how samples move through procedures to produce measured outputs. It makes group allocation, controls, and important decisions visible while the written methods retain operational detail. SciFig FlowChart (flowcharts and diagrams) turns your description into a native SVG experimental workflow figure where every stage, arrow and label stays editable, ready for a presentation or manuscript.
Why use an experimental workflow diagram?
- Make the relationship between a sample and its final readout visible
- Show which preparation stages are shared by the study groups
- Identify where controls enter and how they are processed
- Explain branches with the decision criteria used in the protocol
- Help coauthors review the sequence alongside the written methods
- Give a presentation audience a compact overview before detailed results
Key components of an experimental workflow
- Inputs: the sample or source material relevant to the design
- Processes: major operations written as specific actions
- Groups: consistent control and intervention labels
- Arrows: one clearly defined relationship, such as progression or transfer
- Decisions: stated criteria with labeled outcomes where applicable
- Readouts: named measurements or datasets produced by the procedures
Where experimental workflow figures help
- Summarising a cell-culture comparison with parallel control and treatment lanes
- Explaining sample preparation before a molecular assay
- Showing the order of image acquisition and analysis stages
- Describing how collected material leads to separate measurement outputs
- Preparing a methods overview for a lab meeting or research presentation
- Introducing an analysis before an explanatory volcano plot
How to make an experimental workflow diagram
Describe the structure
Describe the steps, groups, and connections, or start from a suitable SciFig FlowChart template.
Generate the diagram
SciFig FlowChart creates a native SVG diagram — edit any label, connection or count directly.
Edit and export
Edit SVG elements and export SVG, PNG, JPG or PPTX. PPTX includes the diagram visual and editable text where supported.
Free Experimental Workflow Diagram — Frequently Asked Questions
Common questions about Free Experimental Workflow Diagram.
More tools

Circuit Diagram Maker
Draw electronic circuit schematics

Free Body Diagram Generator
Show forces acting on an object

Graphical Abstract Maker
Summarize your study in one panel
SciFig
Free AI Scientific Figure Generator for Illustrations, Images, Charts and Flowcharts
Models
Default to GPT Image 2 for journal papers; switch to Nano Banana Pro for slides and posters; pick Nano Banana 2.1 for routine figure work
Tutorials
Seven short walkthroughs of the AI scientific figure generator
Blog
Tutorials, tool comparisons, and publication tips for researchers.
Inspiration
Explore publication-ready illustrations, charts and flowcharts. Copy a prompt or open any template as the starting point for your own figure.
Pricing
View pricing

Ready to publish?
Make your own experimental workflow diagram in minutes.
Start for freeFree to start · No credit card required · Built for researchers