Ends Dec 1, PT
SciFig
Get Started Free

Describe the scientific figure you need

free and fully editable

Start from text, a sketch, a reference, a PDF, or a lab photo — publication-ready, every element editable.

Describe what you need in the box above.

Start with up to 150 free credits|No credit card required

Get up to 250 free credits on day one when you join through an invite.

3 figure engines · 500+ templatesEvery label editable · 60+ color schemesEditable PPTX · Layered SVG · 8K PNG / JPG

Illustration Templates

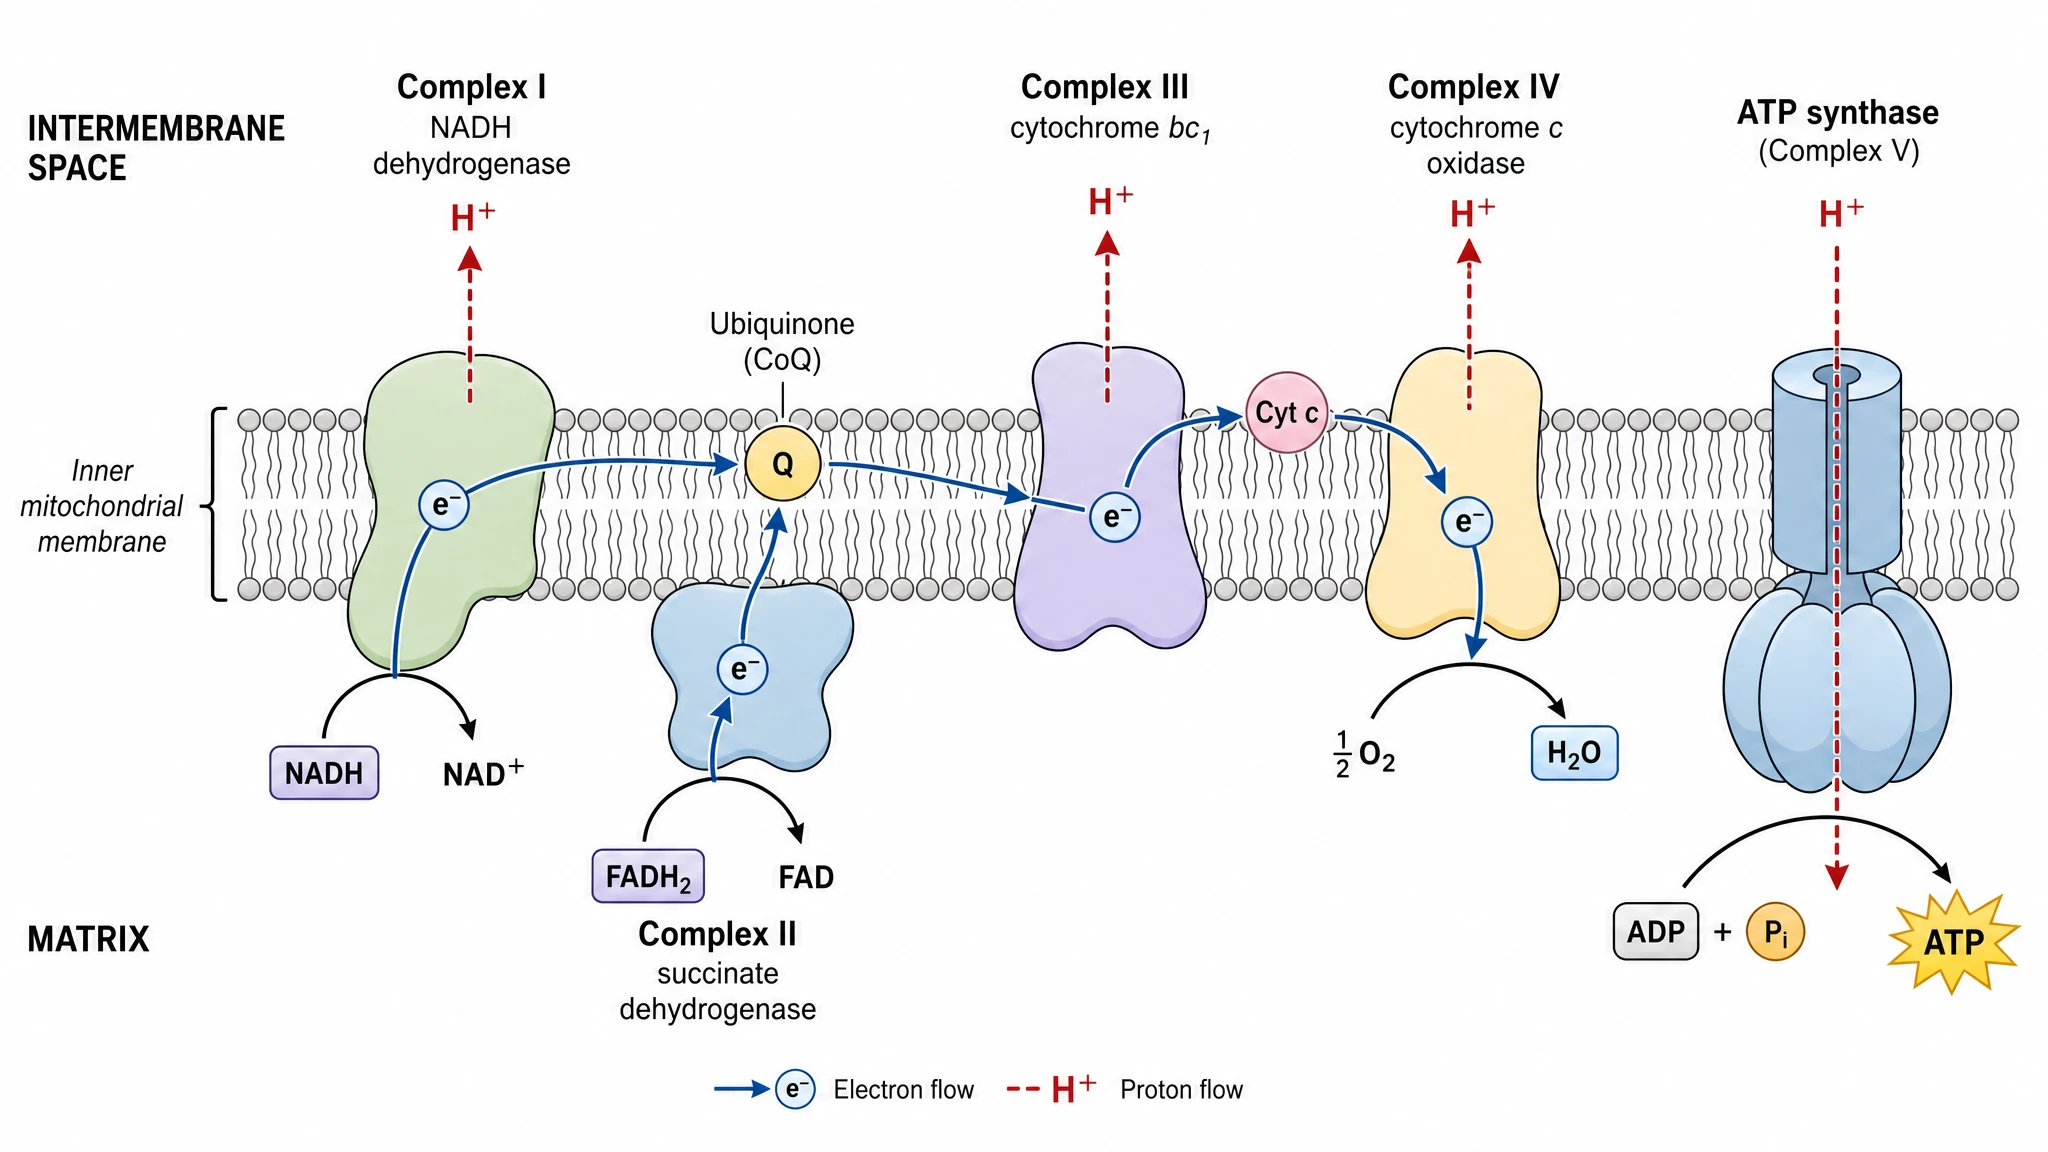
Mitochondrial Electron Transport Chain
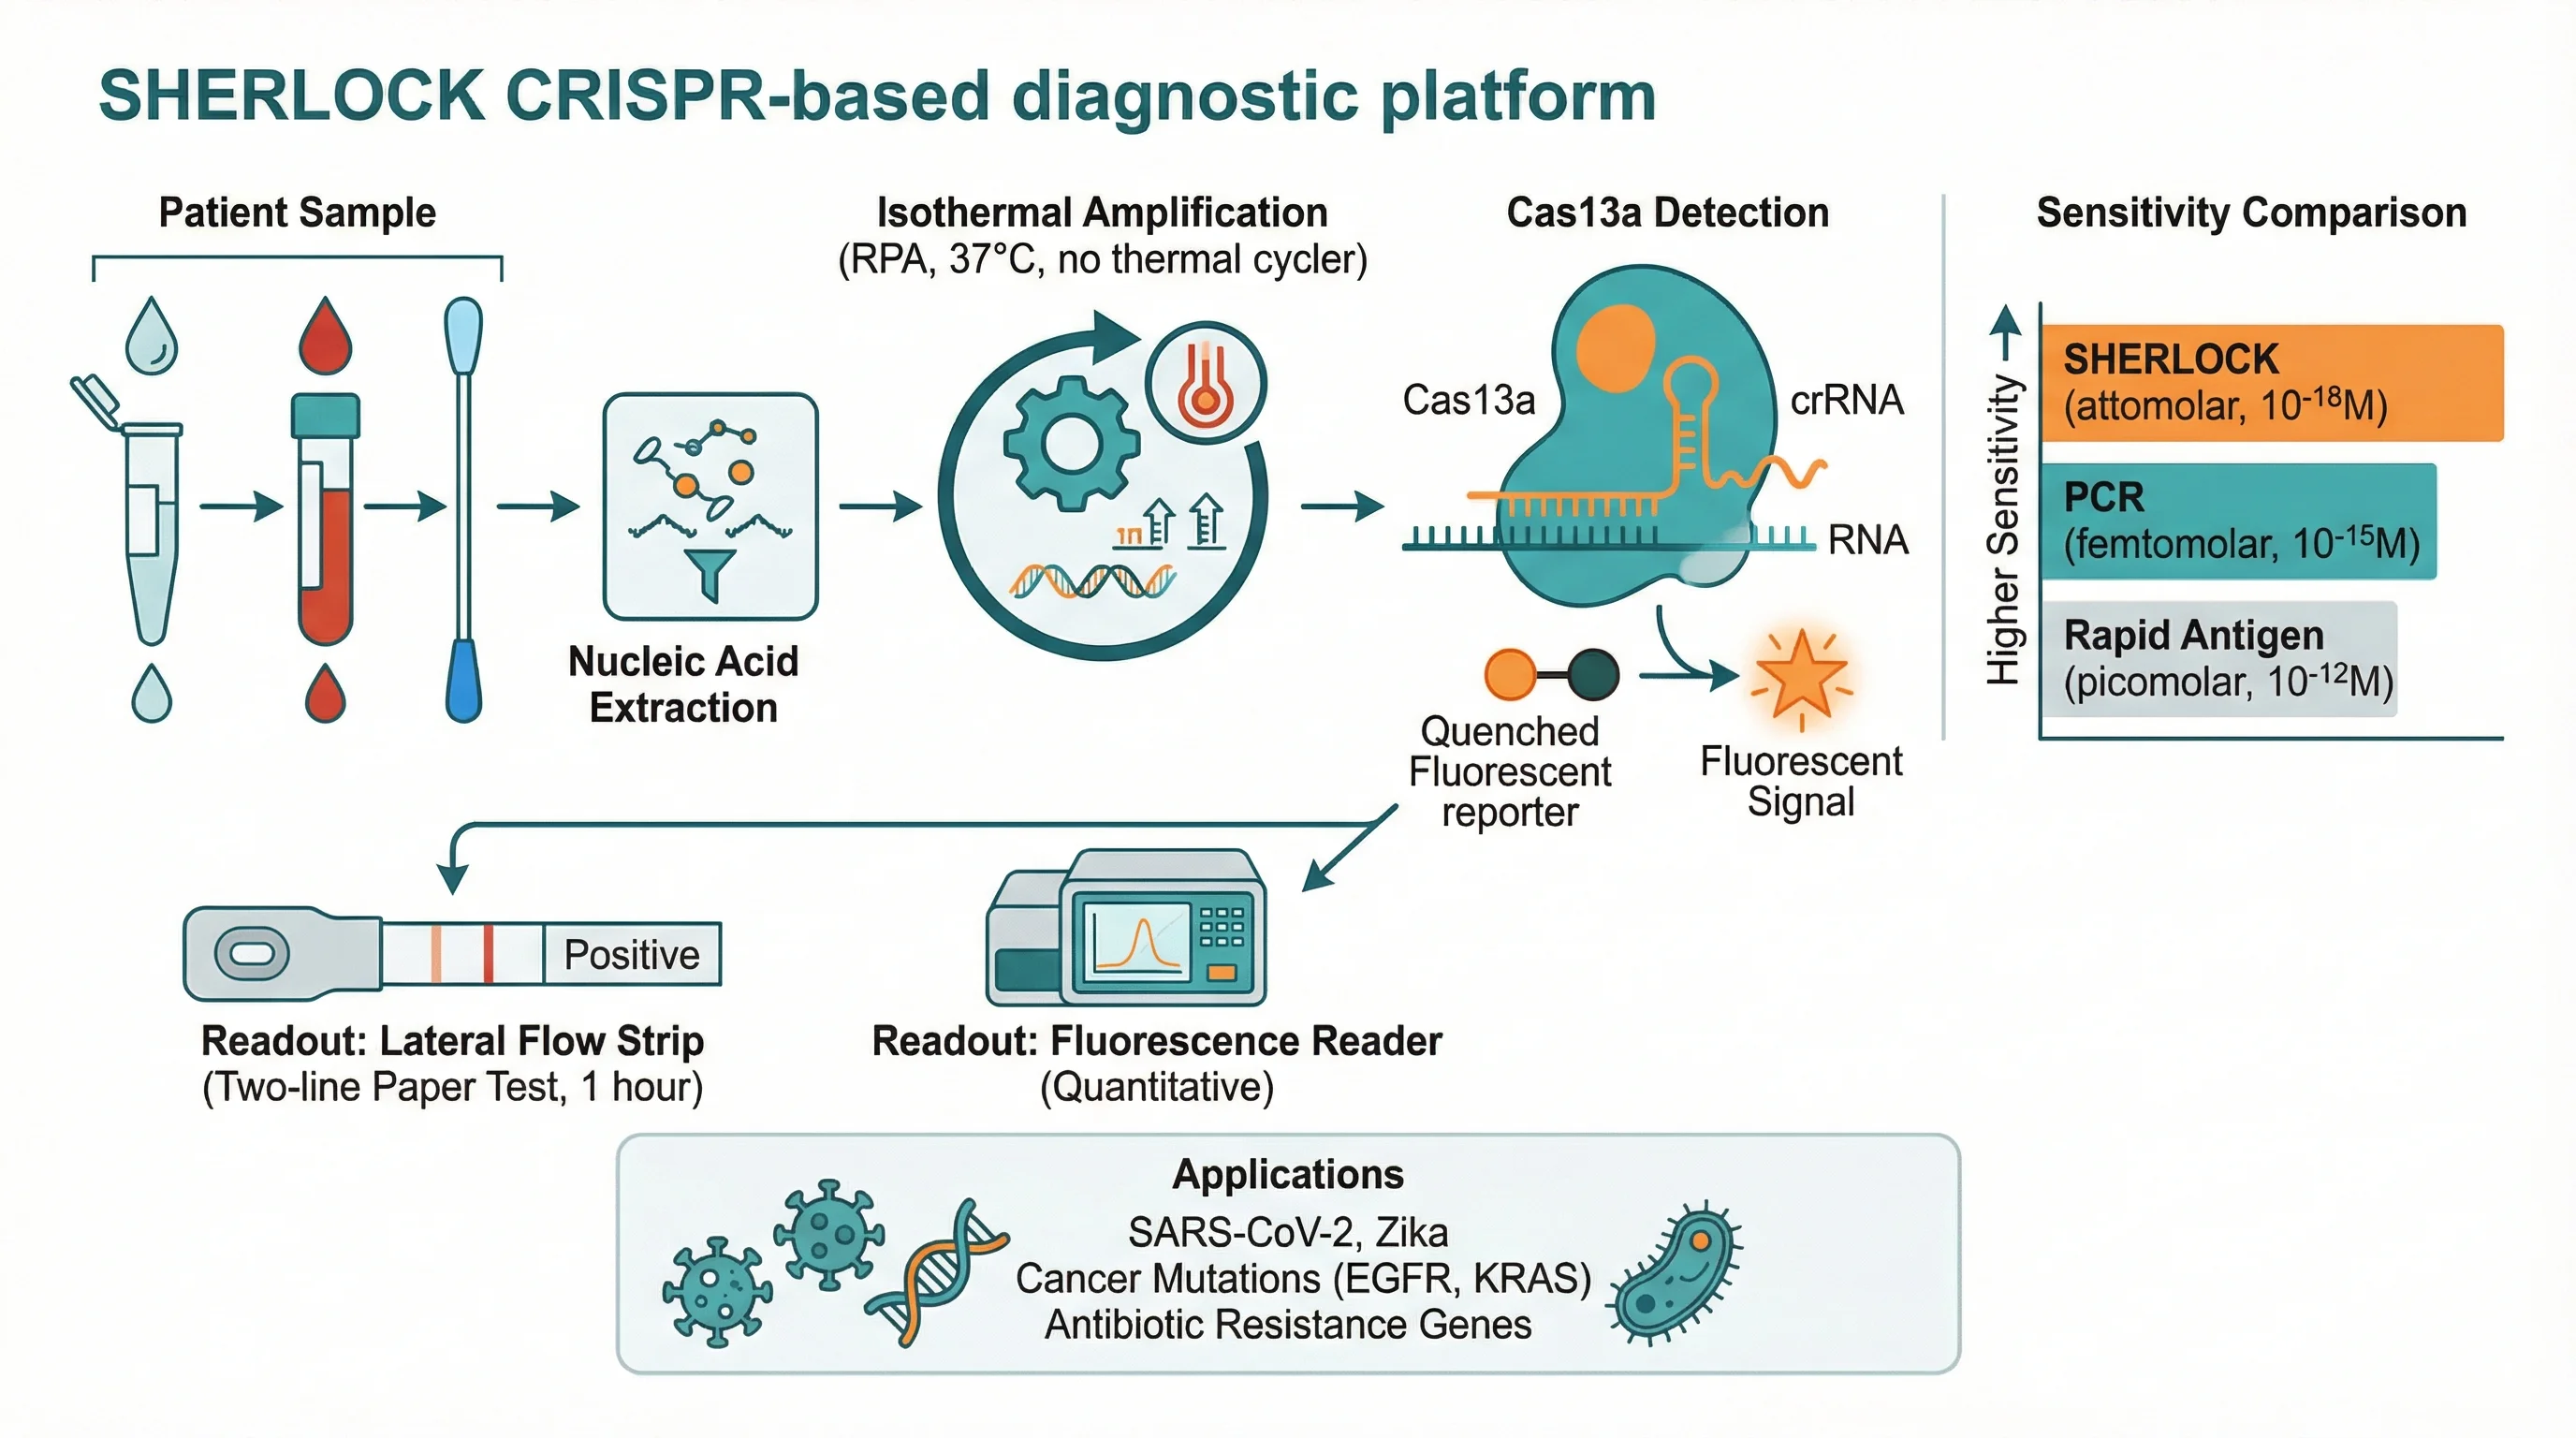
CRISPR Diagnostics SHERLOCK Platform
Suzuki Cross Coupling Catalytic Cycle
Semiconductor Wafer Fabrication Process

Scientific ideas into figures

Free AI Illustration Generator for Scientific Figures

Turn scientific structures and relationships into a figure your audience can follow.

An AI illustration generator turns a written idea and supported reference material into a figure. Illustration focuses this workflow on scientific figures: describe the structures, relationships and labels, or use a sketch, reference, PDF or lab photo mode to guide the composition. Refine the composition, labels and visual style through focused edits, and vectorize the result for a graphical abstract, teaching material or research presentation.

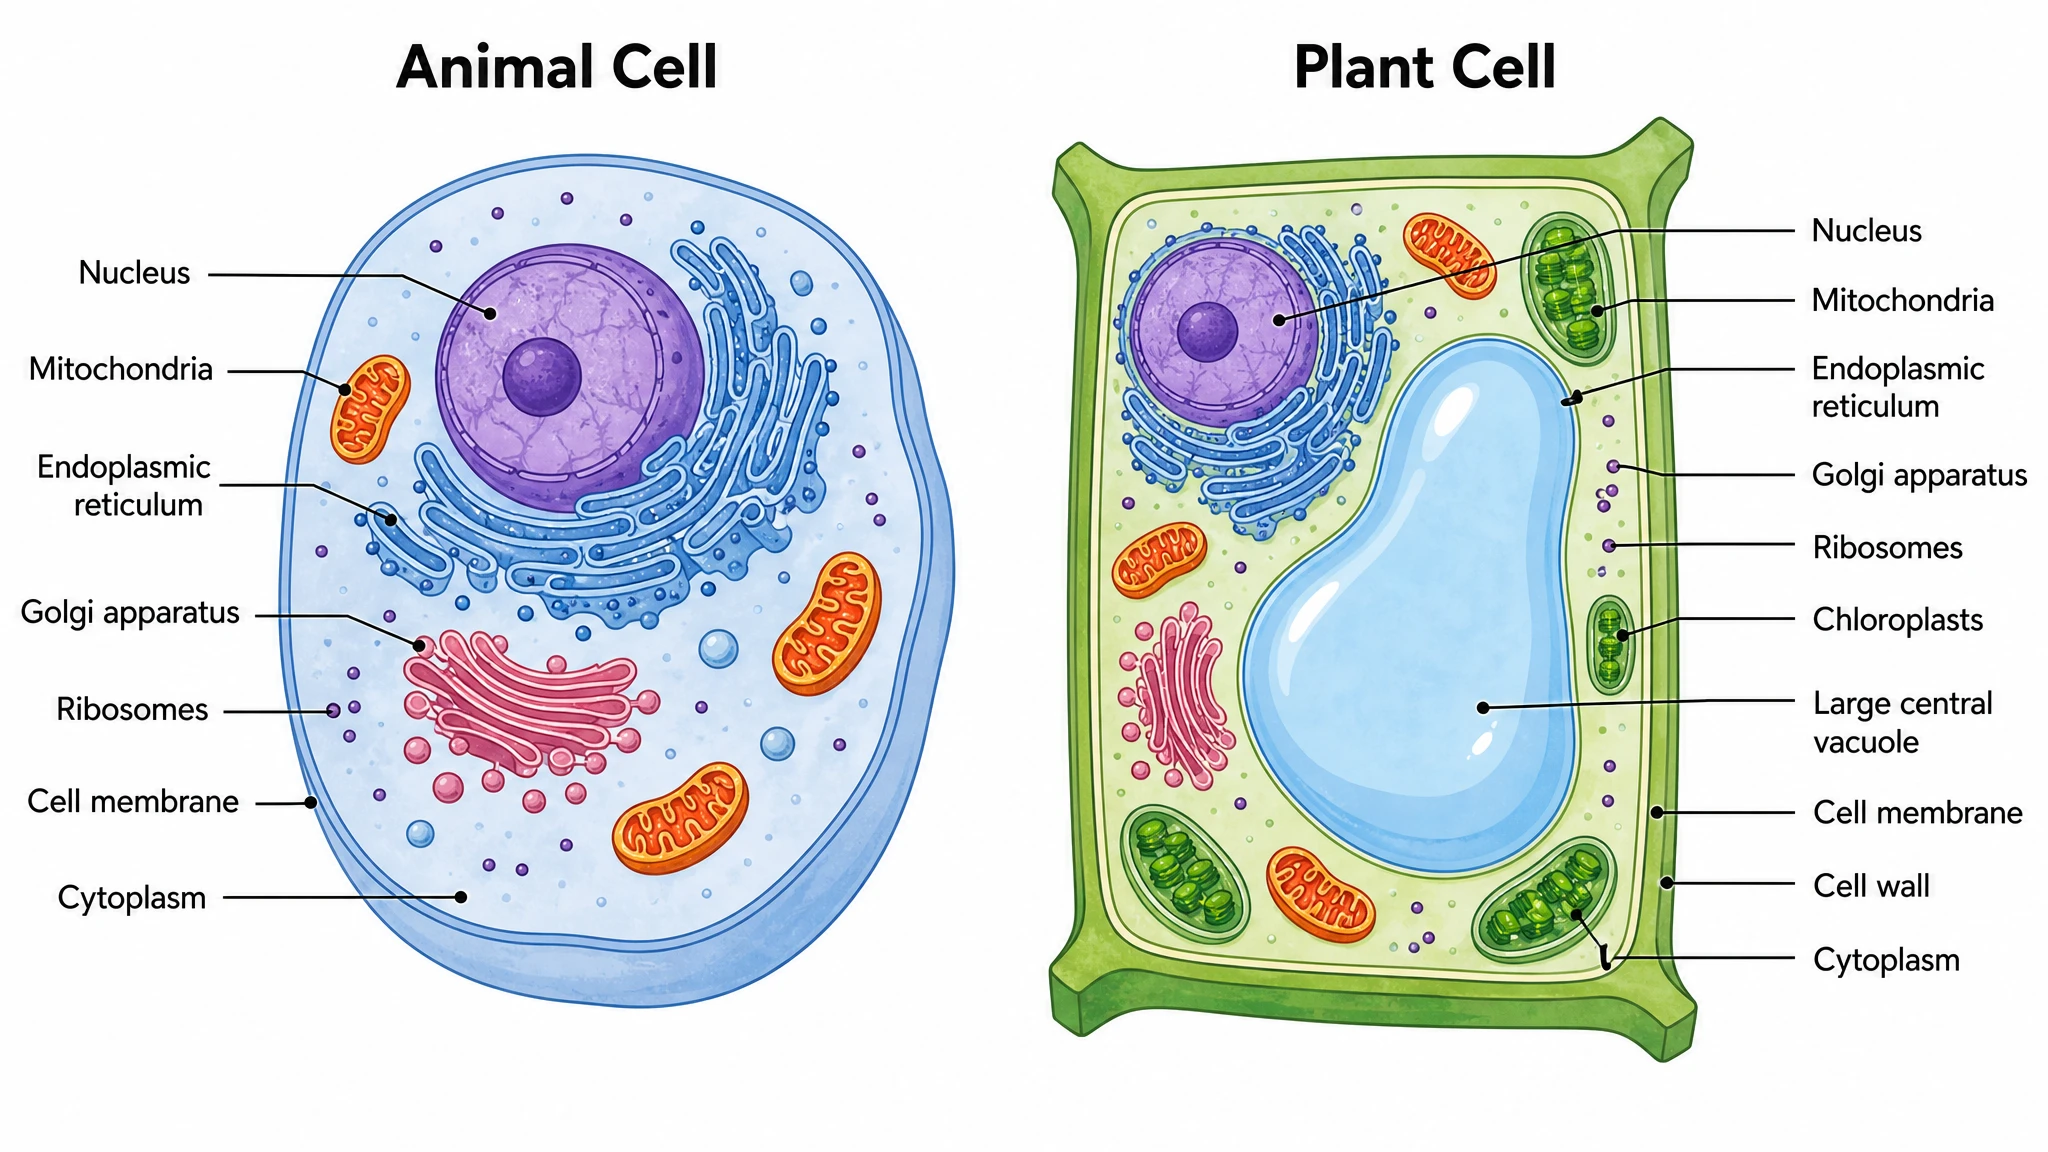
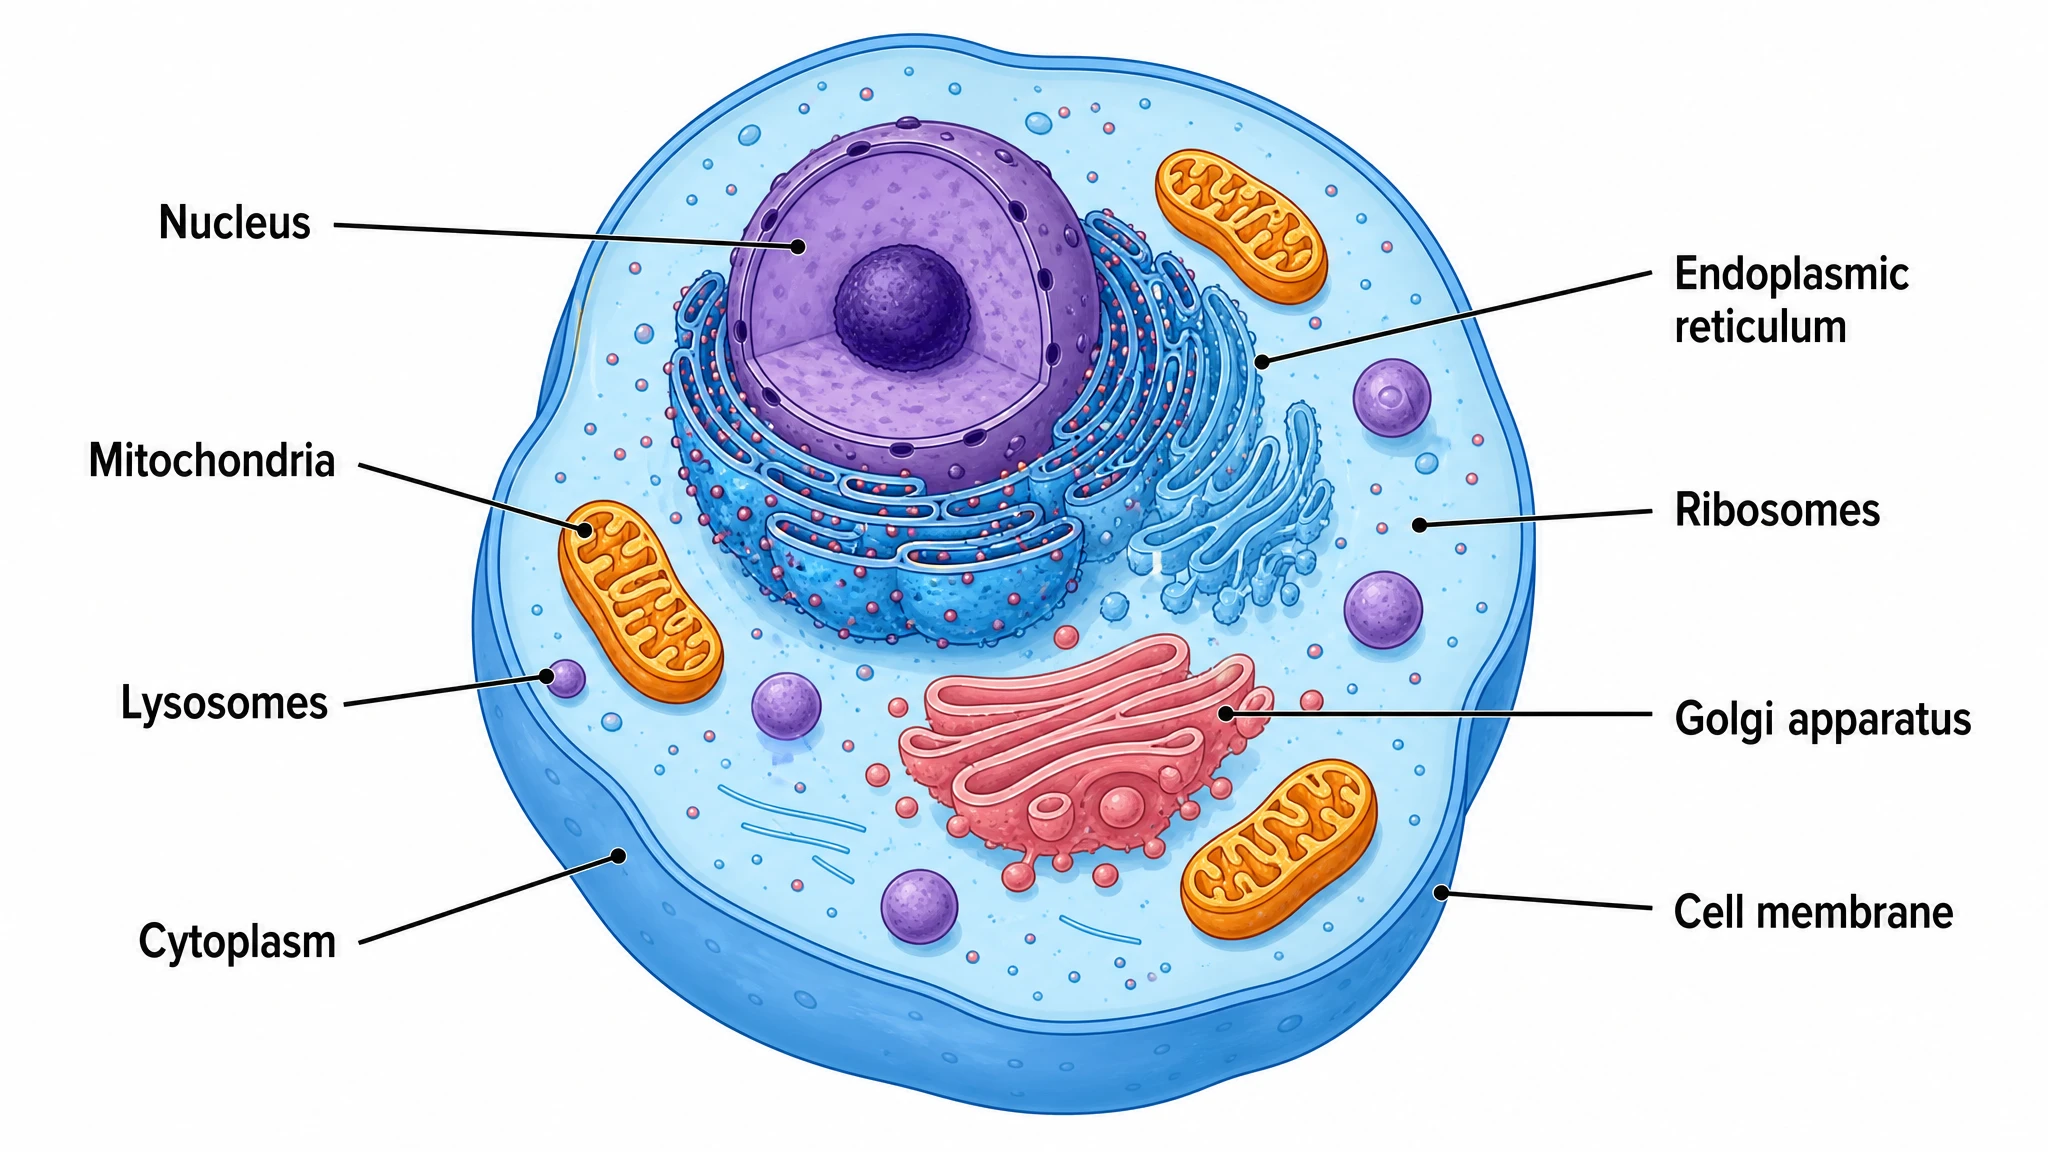
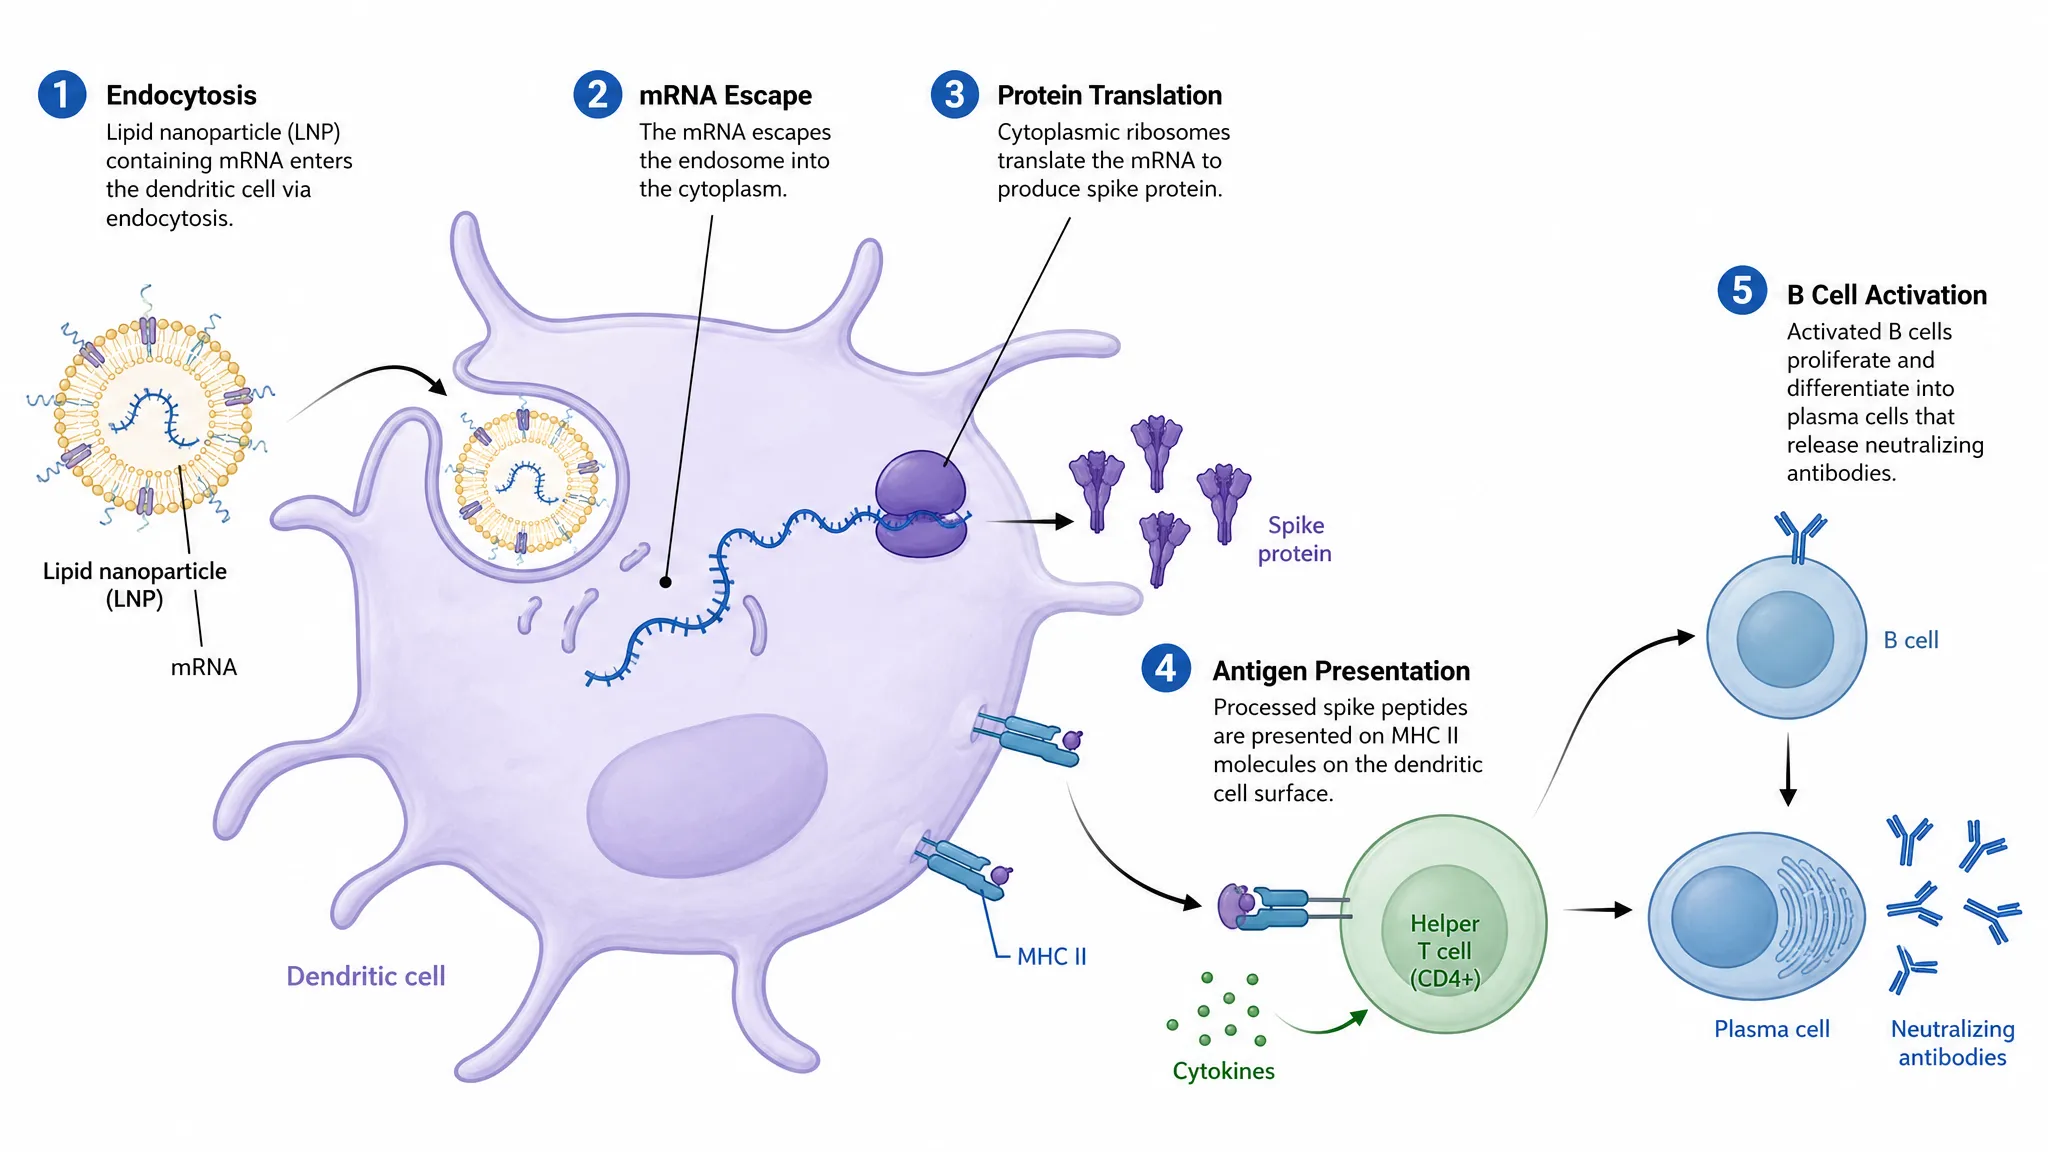
Lipid nanoparticle uptake and mRNA translation in a dendritic cell
  • Text, sketches, references, PDFs and photos
  • Editable text and selected-area redraw
  • Scientific templates and figure revisions
  • PNG, JPG, SVG and PPTX for your documents

AI Illustration Generator Features

Build a scientific illustration from a clear brief, then refine the details that carry your message.

Build a Figure from Your Brief

Bring a figure idea into view with a brief that names the structures, relationships and labels. Start from text, or select a supported sketch, reference, PDF or lab photo mode to communicate the composition. Illustration gives you an editable figure for a graphical abstract, teaching diagram or research presentation.

  • Give structures and relationships a clear visual brief.
  • Use a supported reference mode to guide composition.
  • Specify the labels and viewpoint your audience needs.
Describe Your Figure

Make Scientific Relationships Visible

Show how a cellular structure, molecular pathway or experimental process fits together. A relevant template helps communicate the layout, while your brief supplies the subject and terminology. Develop a figure around the relationship you want readers to understand and refine the labels and composition.

  • Explore examples of pathways, structures and protocols.
  • Connect each arrow and label to its intended meaning.
  • Adapt the level of detail to your paper or lesson.
Explore Illustration Templates

Refine the Details That Matter

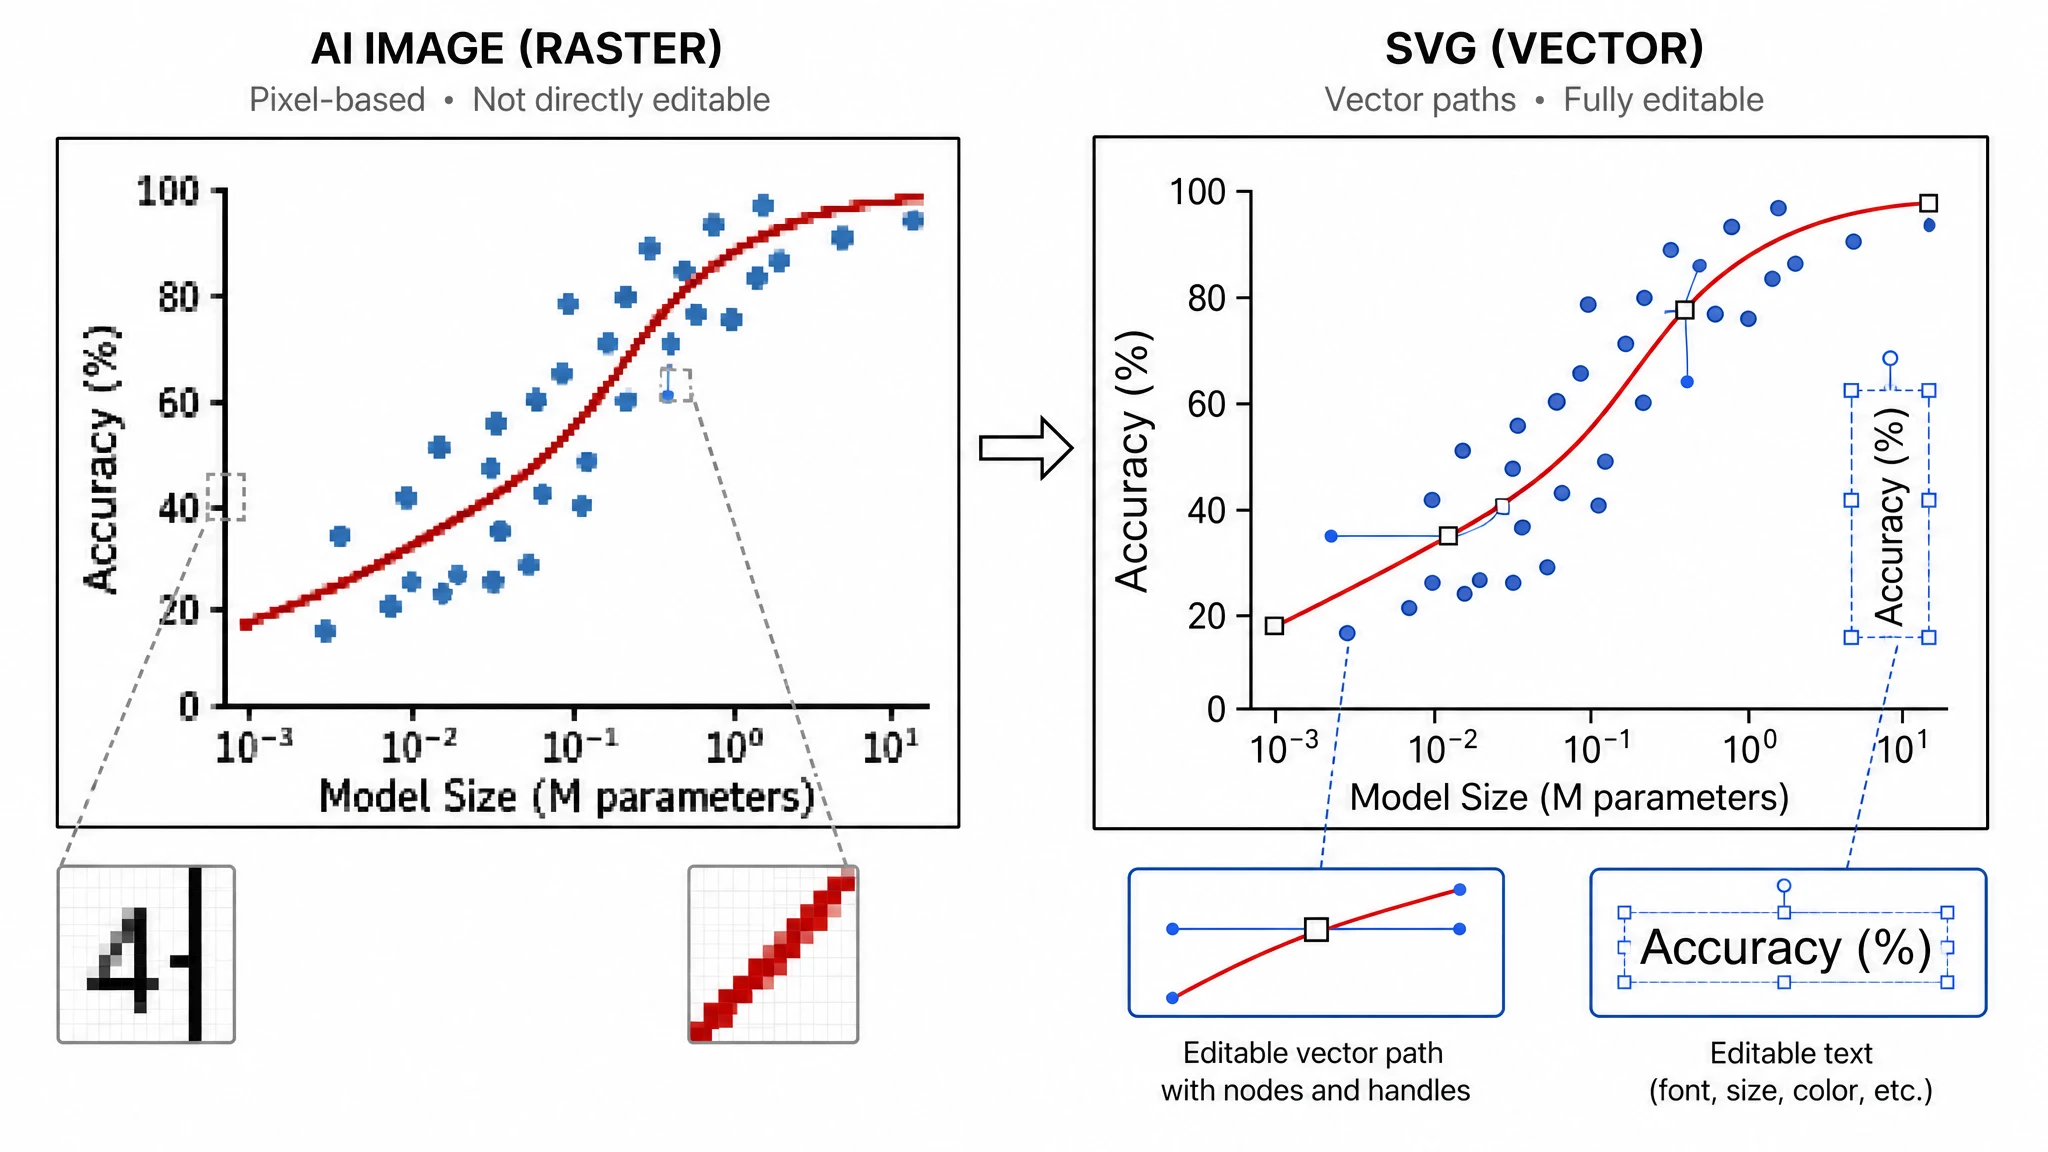
Use text editing to correct labels, select an area for redrawing, or describe a change to the composition and colors. Illustration lets you develop a figure through focused revisions instead of rewriting the whole brief, and vectorizes the result so you can edit every text and shape in Vector Canvas.

  • Correct the wording with text-editing tools.
  • Select an area to redraw a structure or object.
  • Convert to SVG for text and shape edits on the canvas.
Start an Editable Figure

Prepare a Figure for Your Audience

Bring the same scientific figure into a manuscript, poster or lecture. Export PNG or JPG for images, convert to SVG for vector editing, or prepare PPTX for slides. You can enlarge the image to 8K for larger layouts and keep the project so later changes build on the same composition.

  • Export PNG or JPG for documents and teaching materials.
  • Convert to SVG or prepare PPTX for slide workflows.
  • Enlarge to 8K for a larger poster or figure layout.
Create a Figure for Export

How to Use an AI Illustration Generator

Describe the figure, generate it in seconds, then refine any detail and export.

  1. Define the Figure You Need

    Describe the subject, viewpoint and relationships, then list the labels that must appear. For a cellular diagram, name the structures and any arrows or enlarged regions. This gives the AI illustration generator a clear composition brief before you choose the visual style.

  2. Add a Reference or Template

    Choose a supported input mode or browse a relevant template. A sketch can communicate layout; a reference can communicate the structures to include. Explain what to preserve and what to change, and follow the upload requirements shown for the selected mode.

  3. Generate Your Figure

    Generate the scientific figure from your description and chosen reference. View the resulting composition, structures, arrows and labels together. You now have a concrete figure to discuss with colleagues, with every label ready for focused changes.

  4. Refine and Prepare the Export

    Use text editing for labels, select an area to redraw, or describe a change to the composition. You can then export PNG or JPG, convert to SVG, or prepare PPTX. Enlarge to 8K when you need a larger image for the final layout.

Scientific Illustration Use Cases

Use scientific illustrations to explain structures, mechanisms and research workflows in papers or teaching.

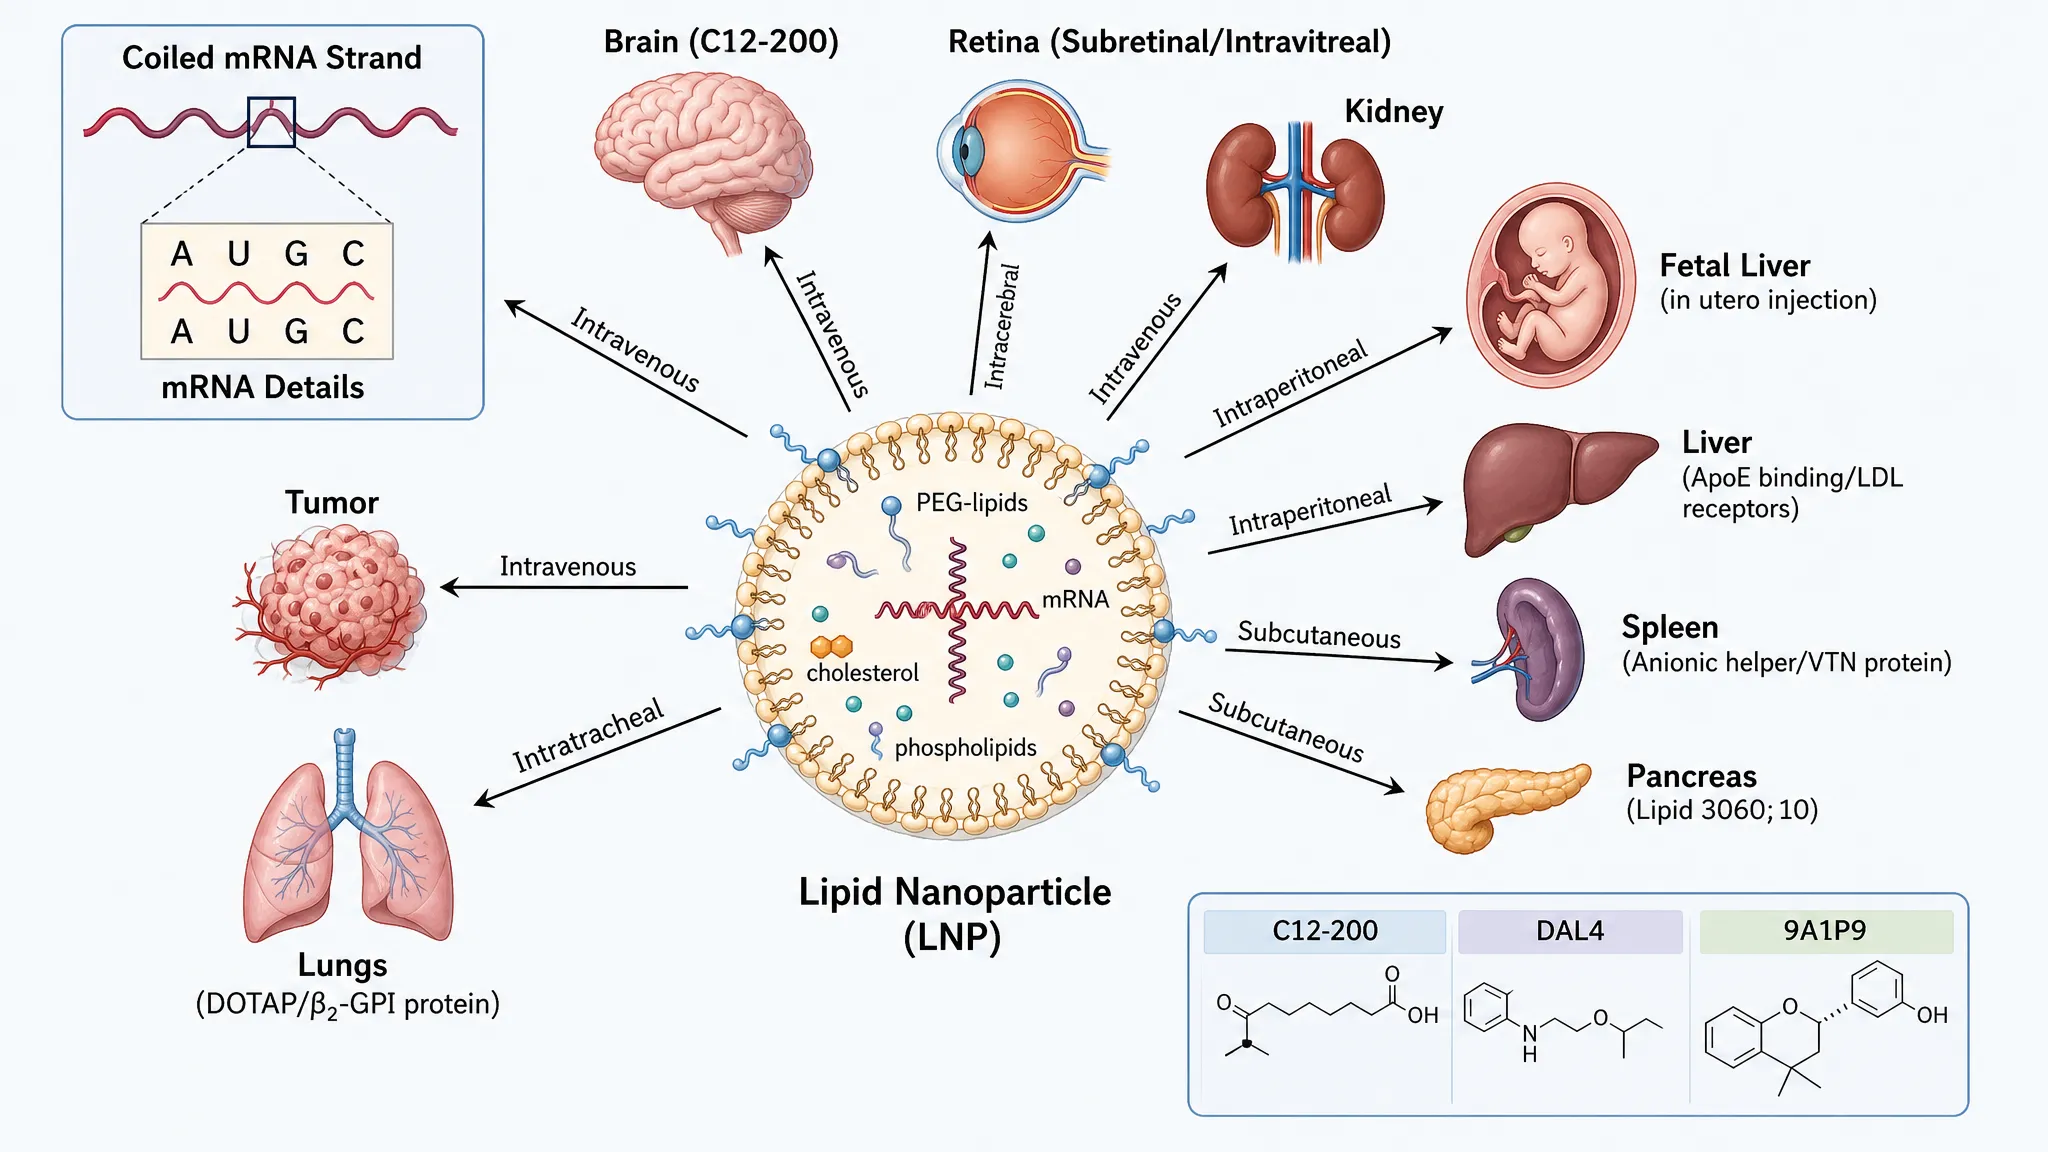
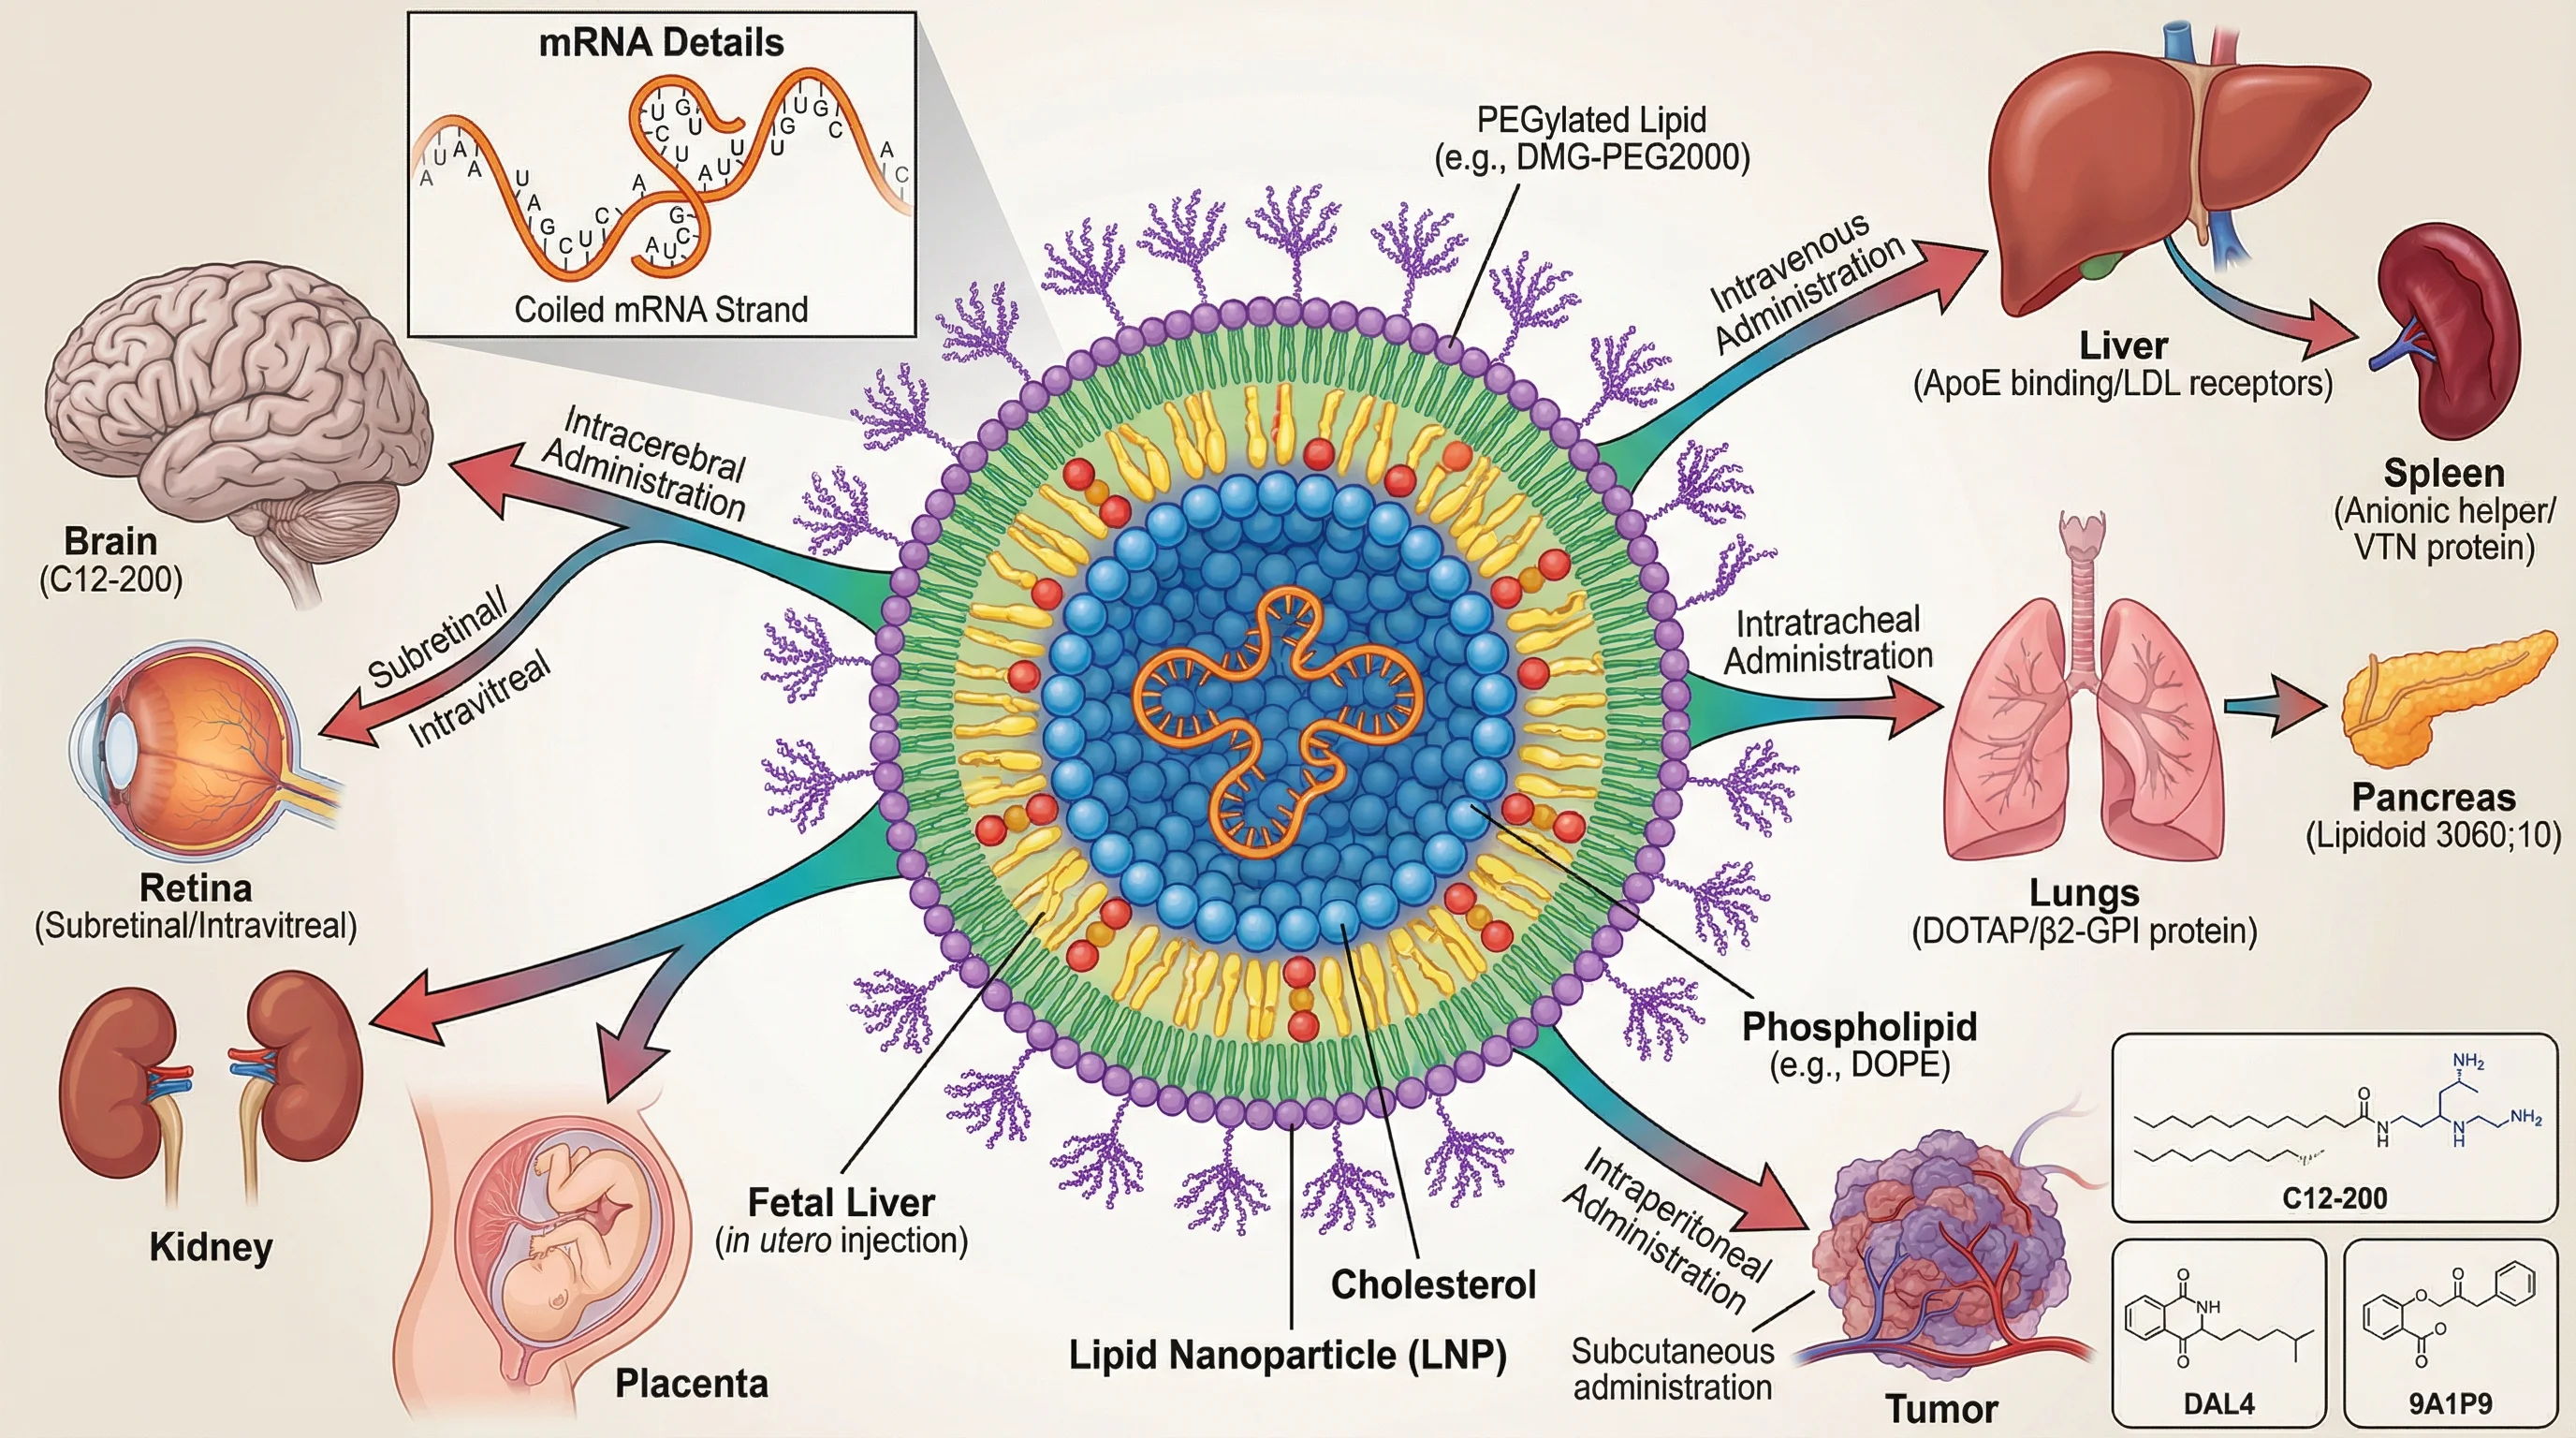
Lipid nanoparticle structure and target-organ biodistribution diagram

Graphical Abstracts for Research

Turn your study notes, key findings and linked objects into a graphical abstract. Give Illustration the question and relationships that should stand out, then develop one composition connecting the approach and outcome. The figure can introduce the study in a manuscript, conference poster or presentation.

Explore this example
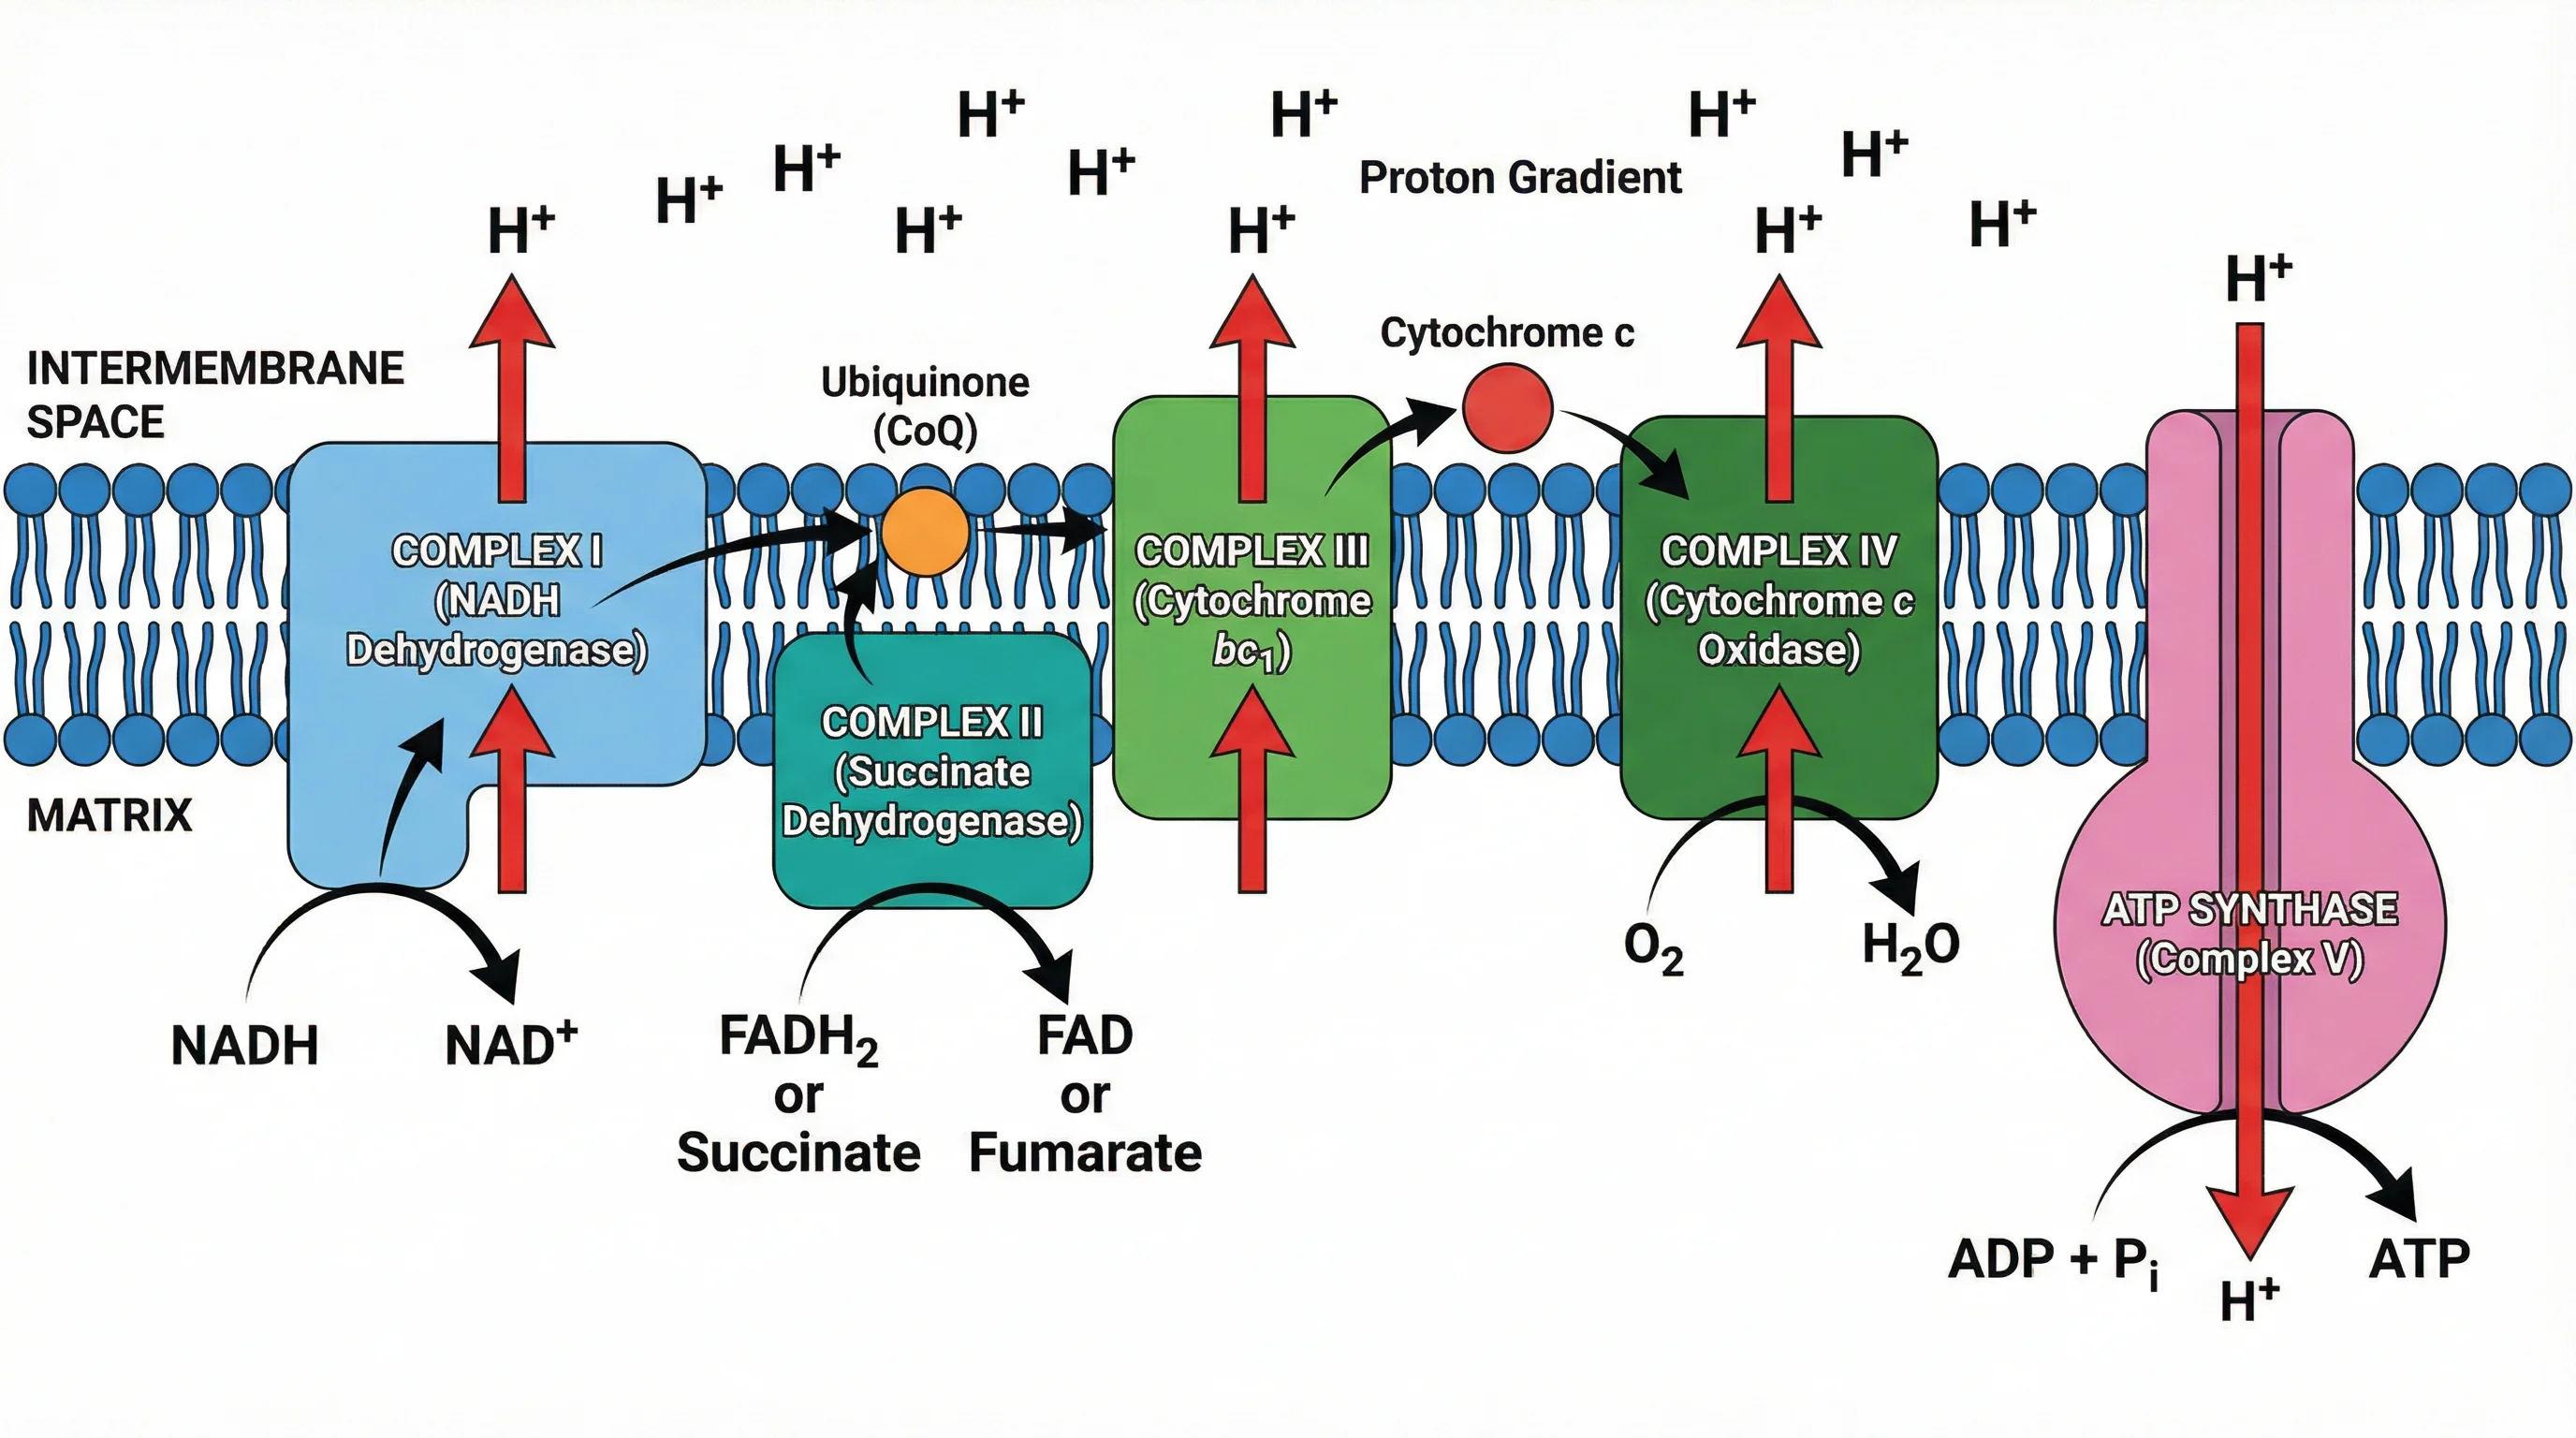
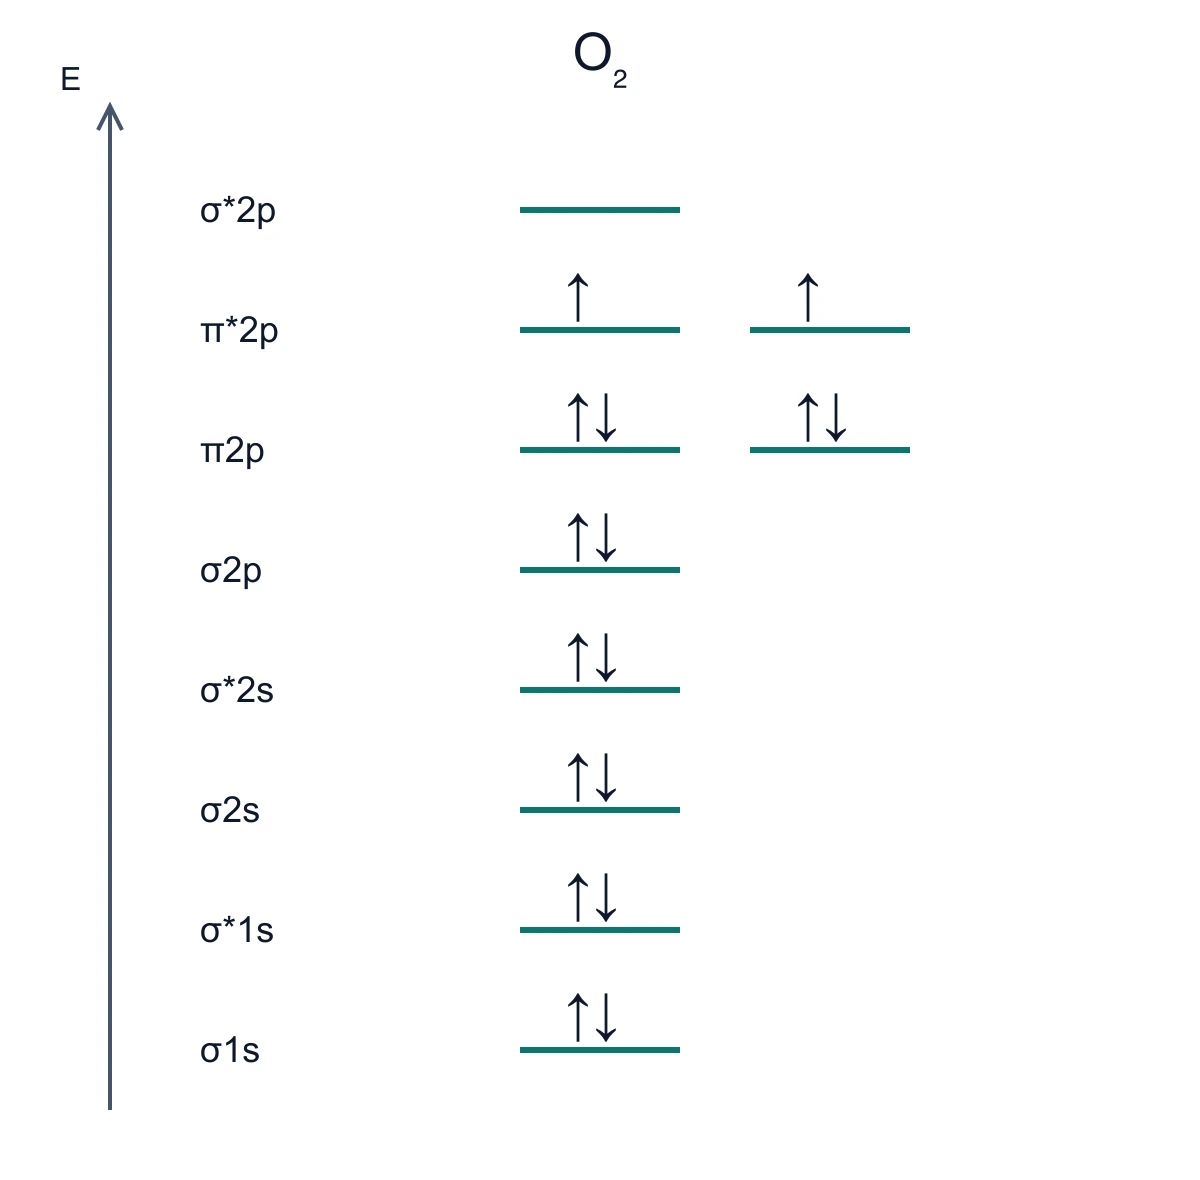
Mitochondrial electron transport chain with labeled complexes

Biological Pathway Diagrams

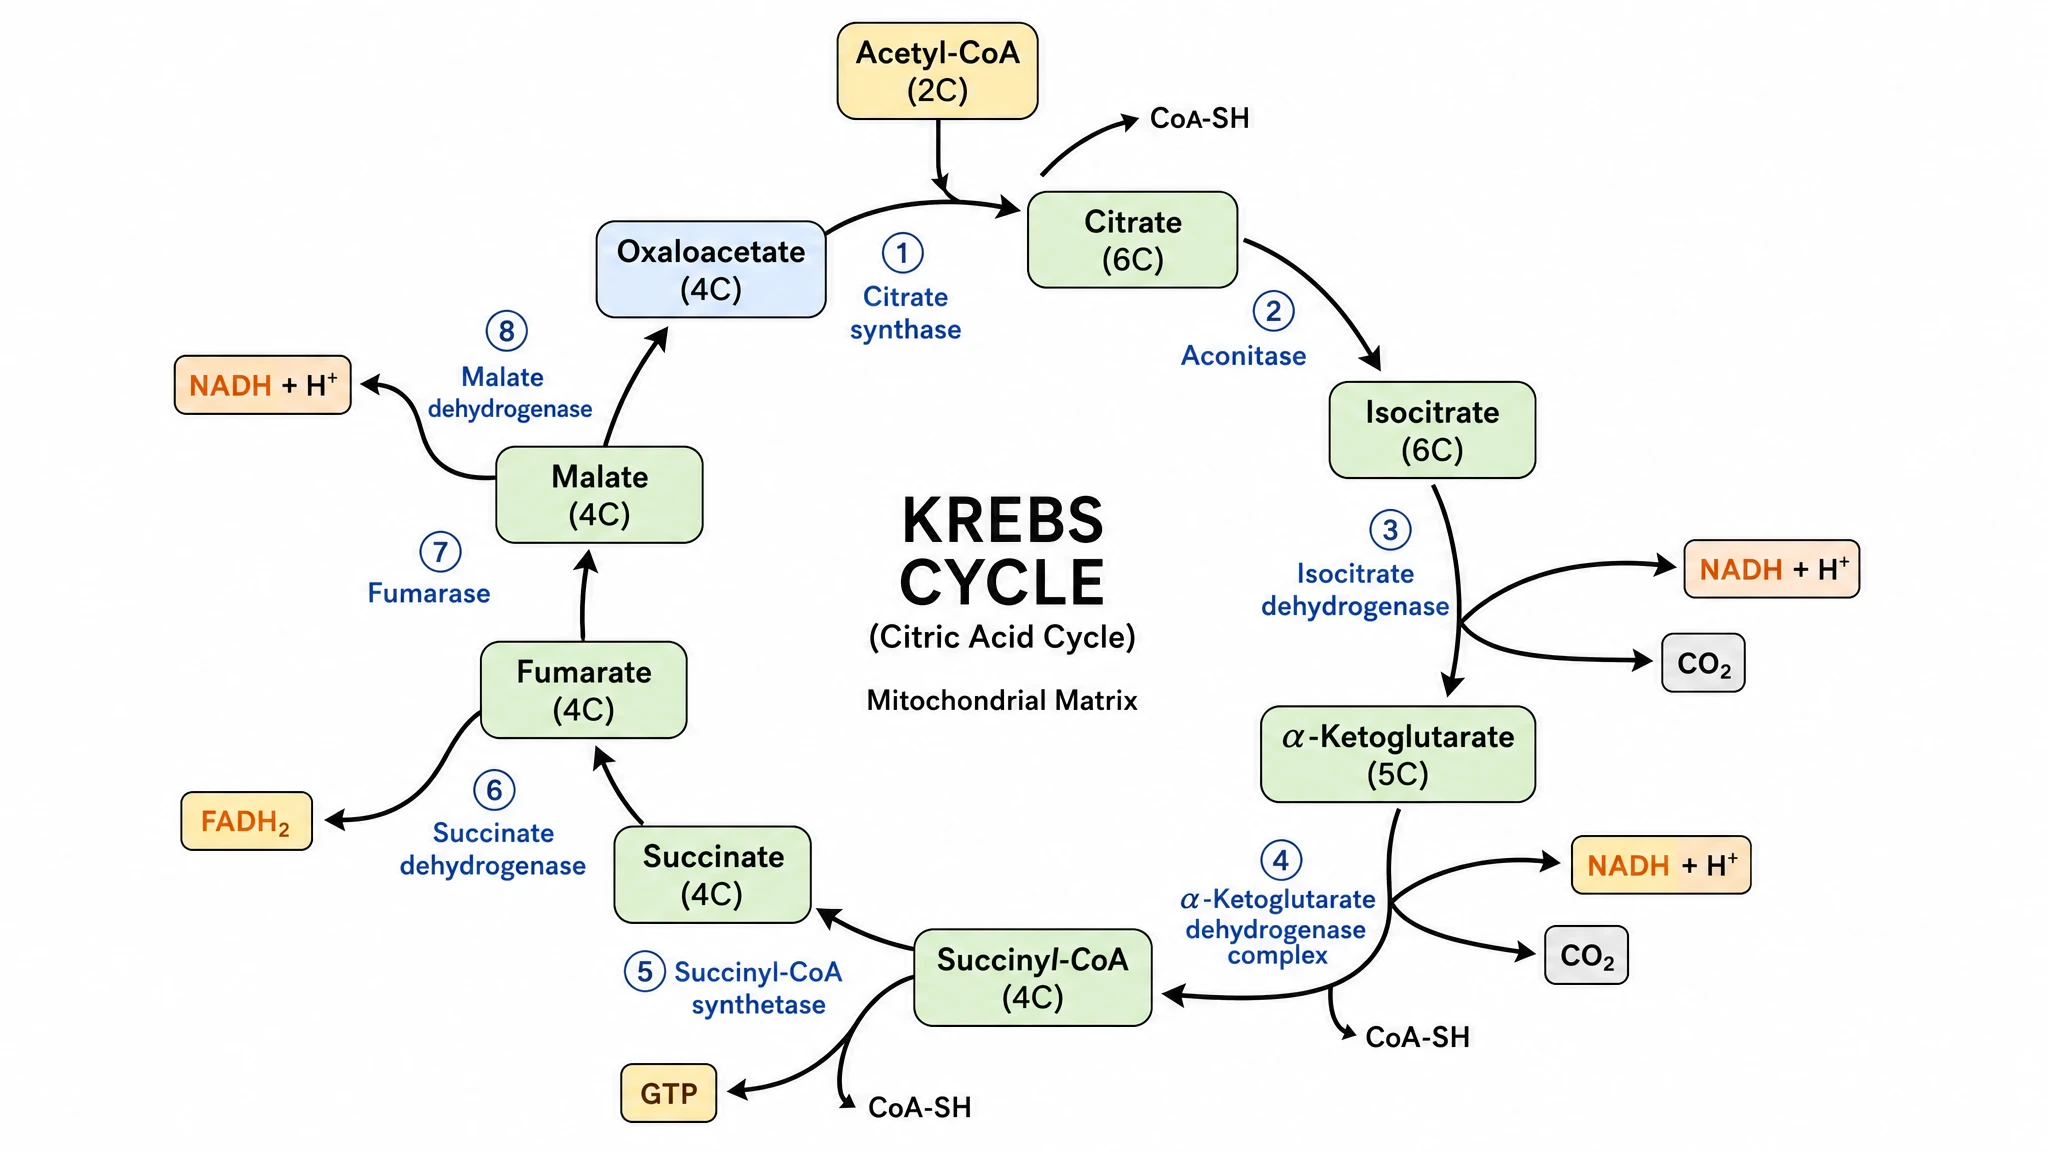
Make molecular interactions and cellular processes easier to explain in a paper or lecture. Start with a relevant pathway example, specify the components and arrow directions, and refine the labels. Illustration keeps every label and arrow editable, so the visual explanation follows the underlying mechanism.

Explore this example
CRISPR SHERLOCK diagnostic stages and readout methods

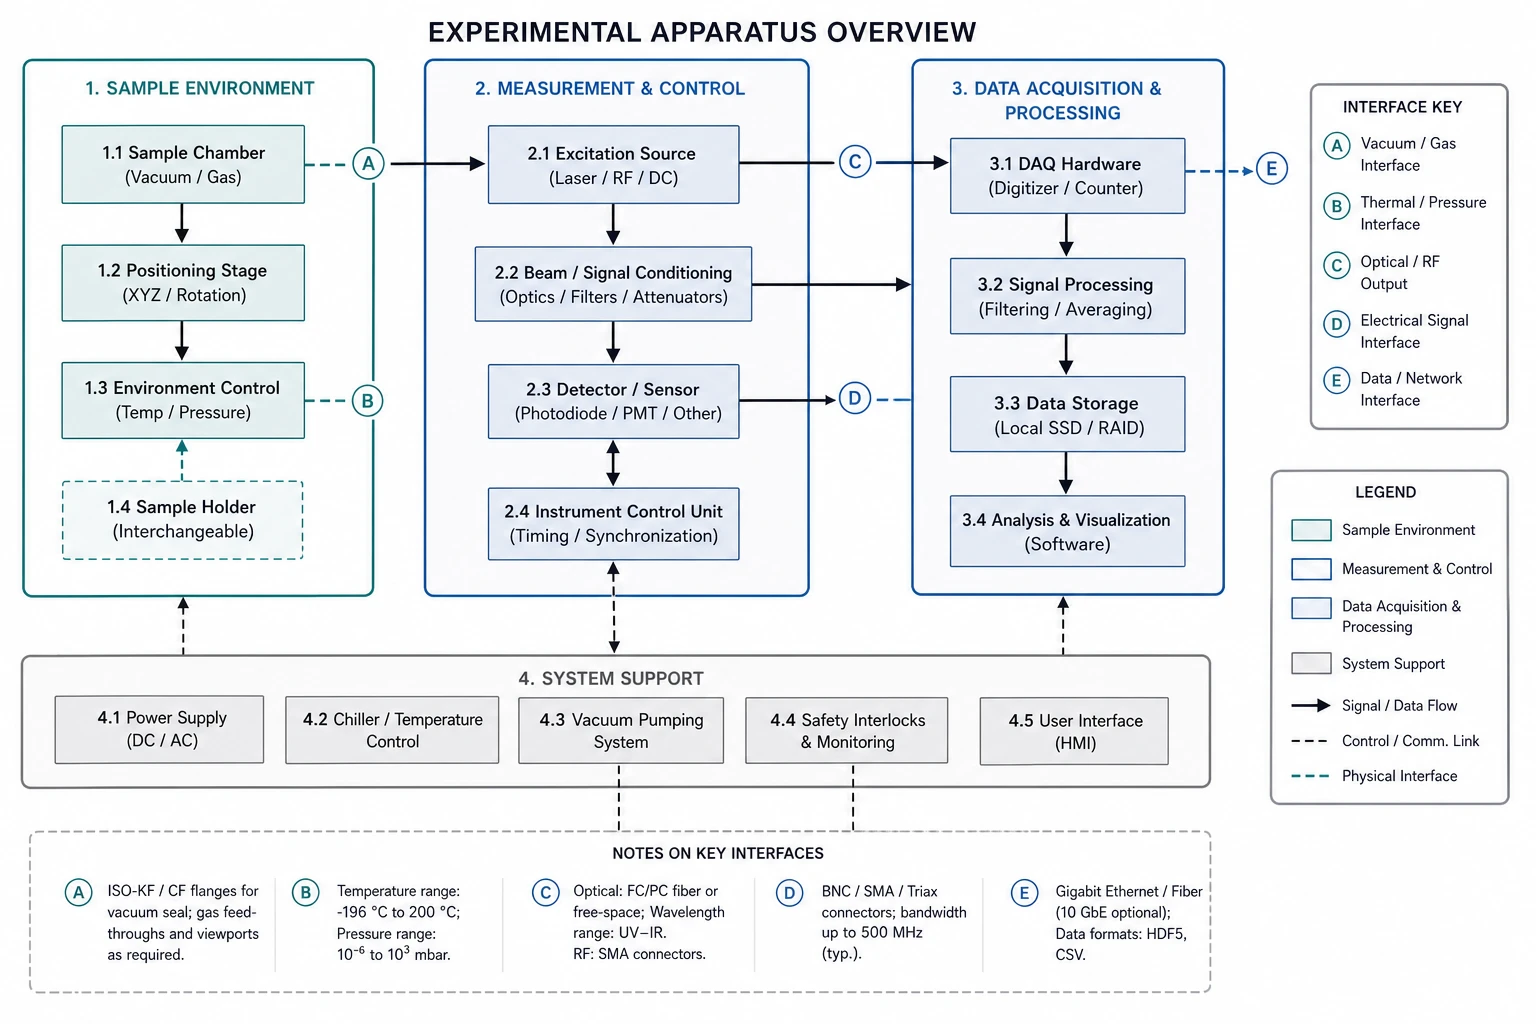
Experimental Protocol Illustrations

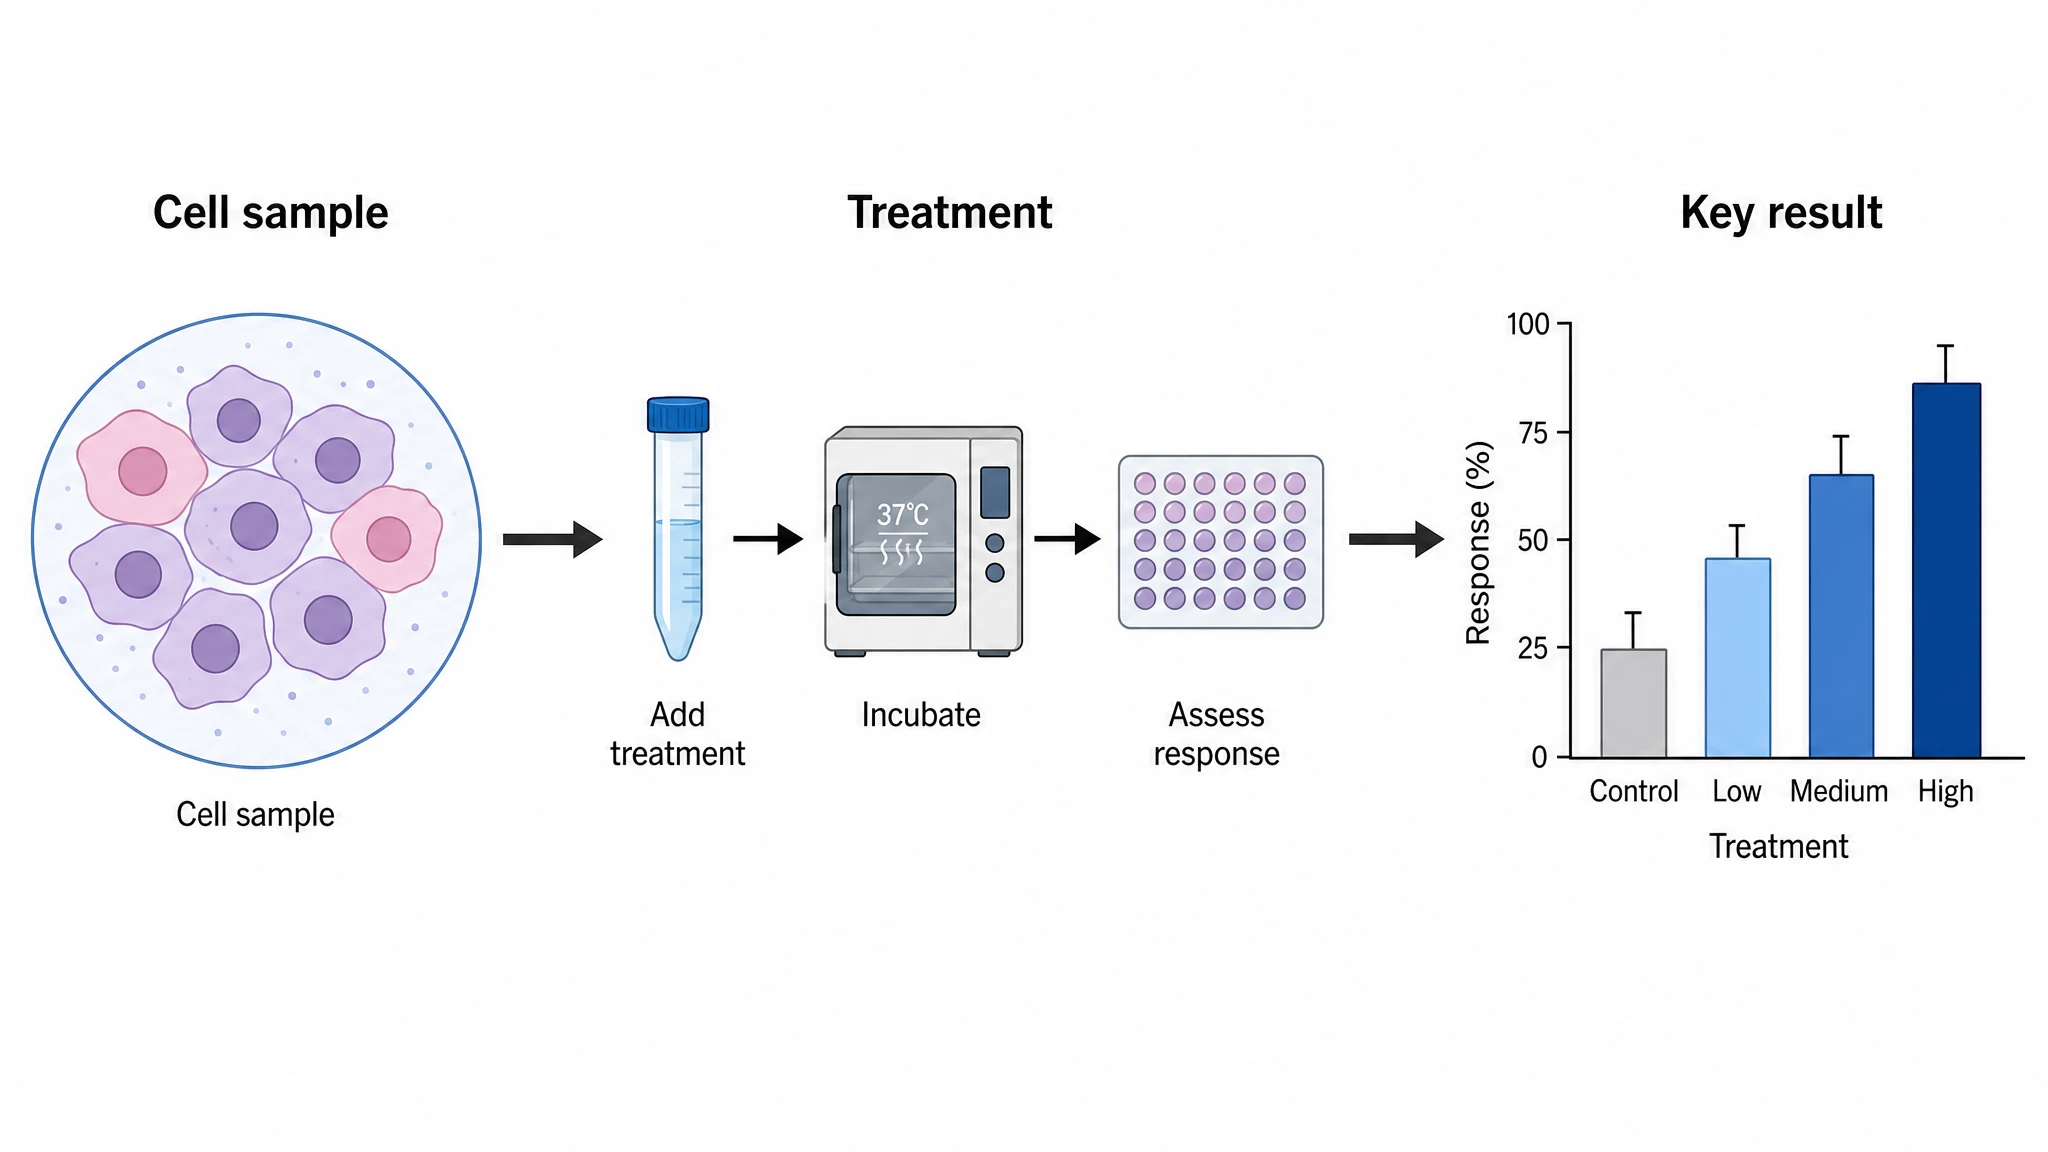
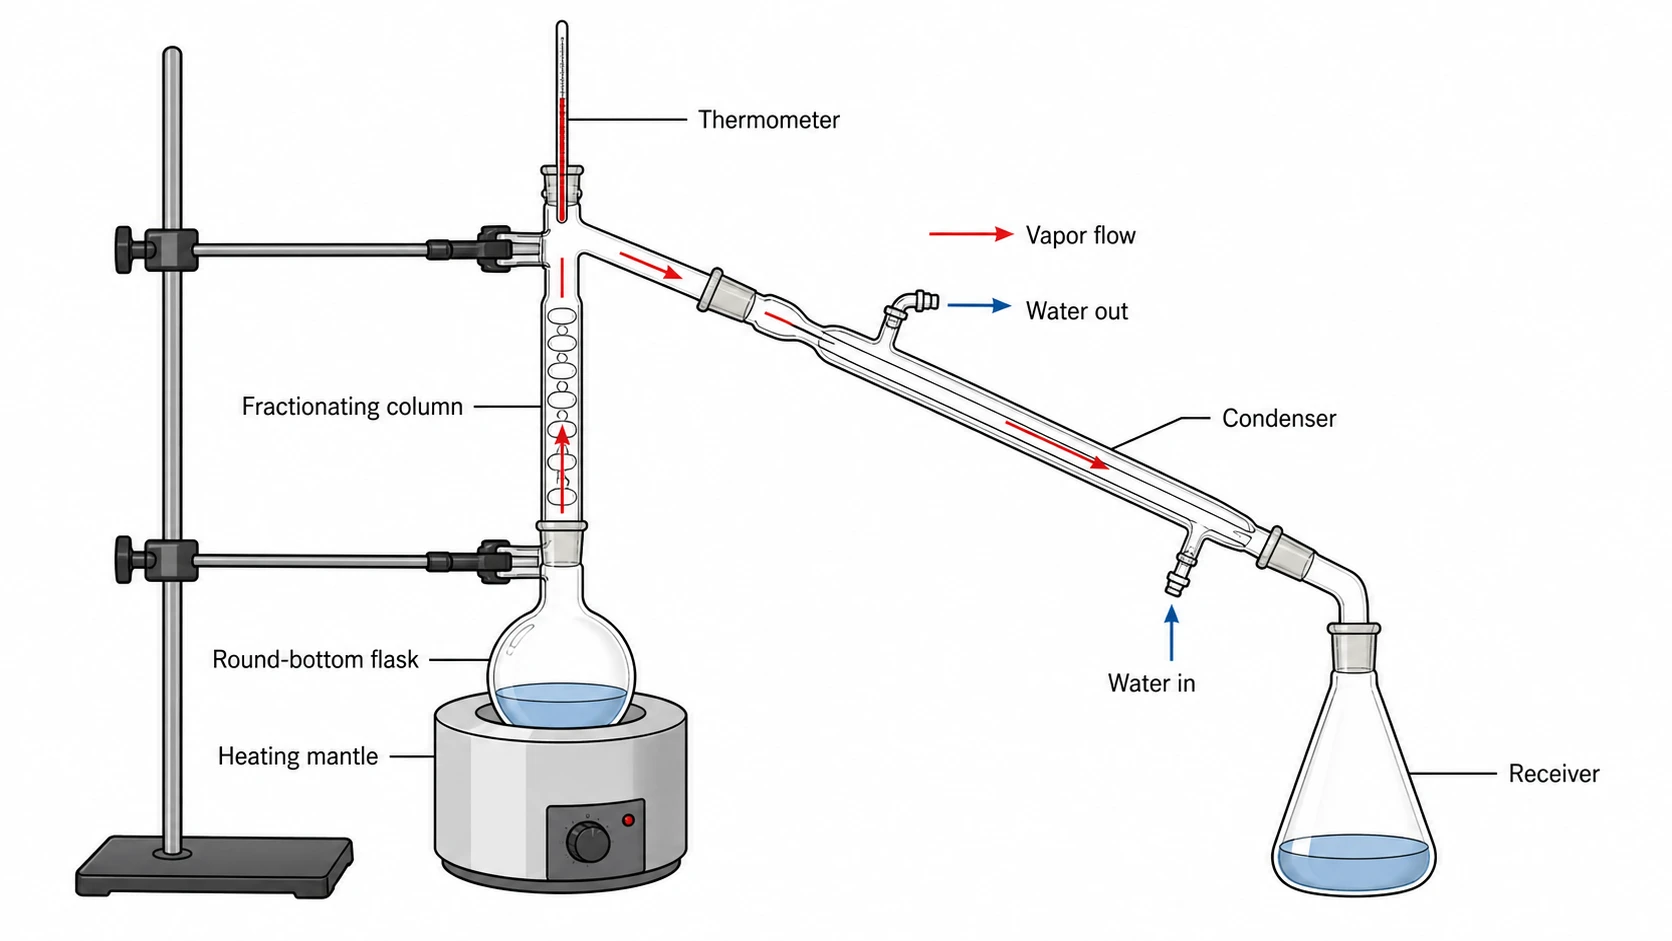
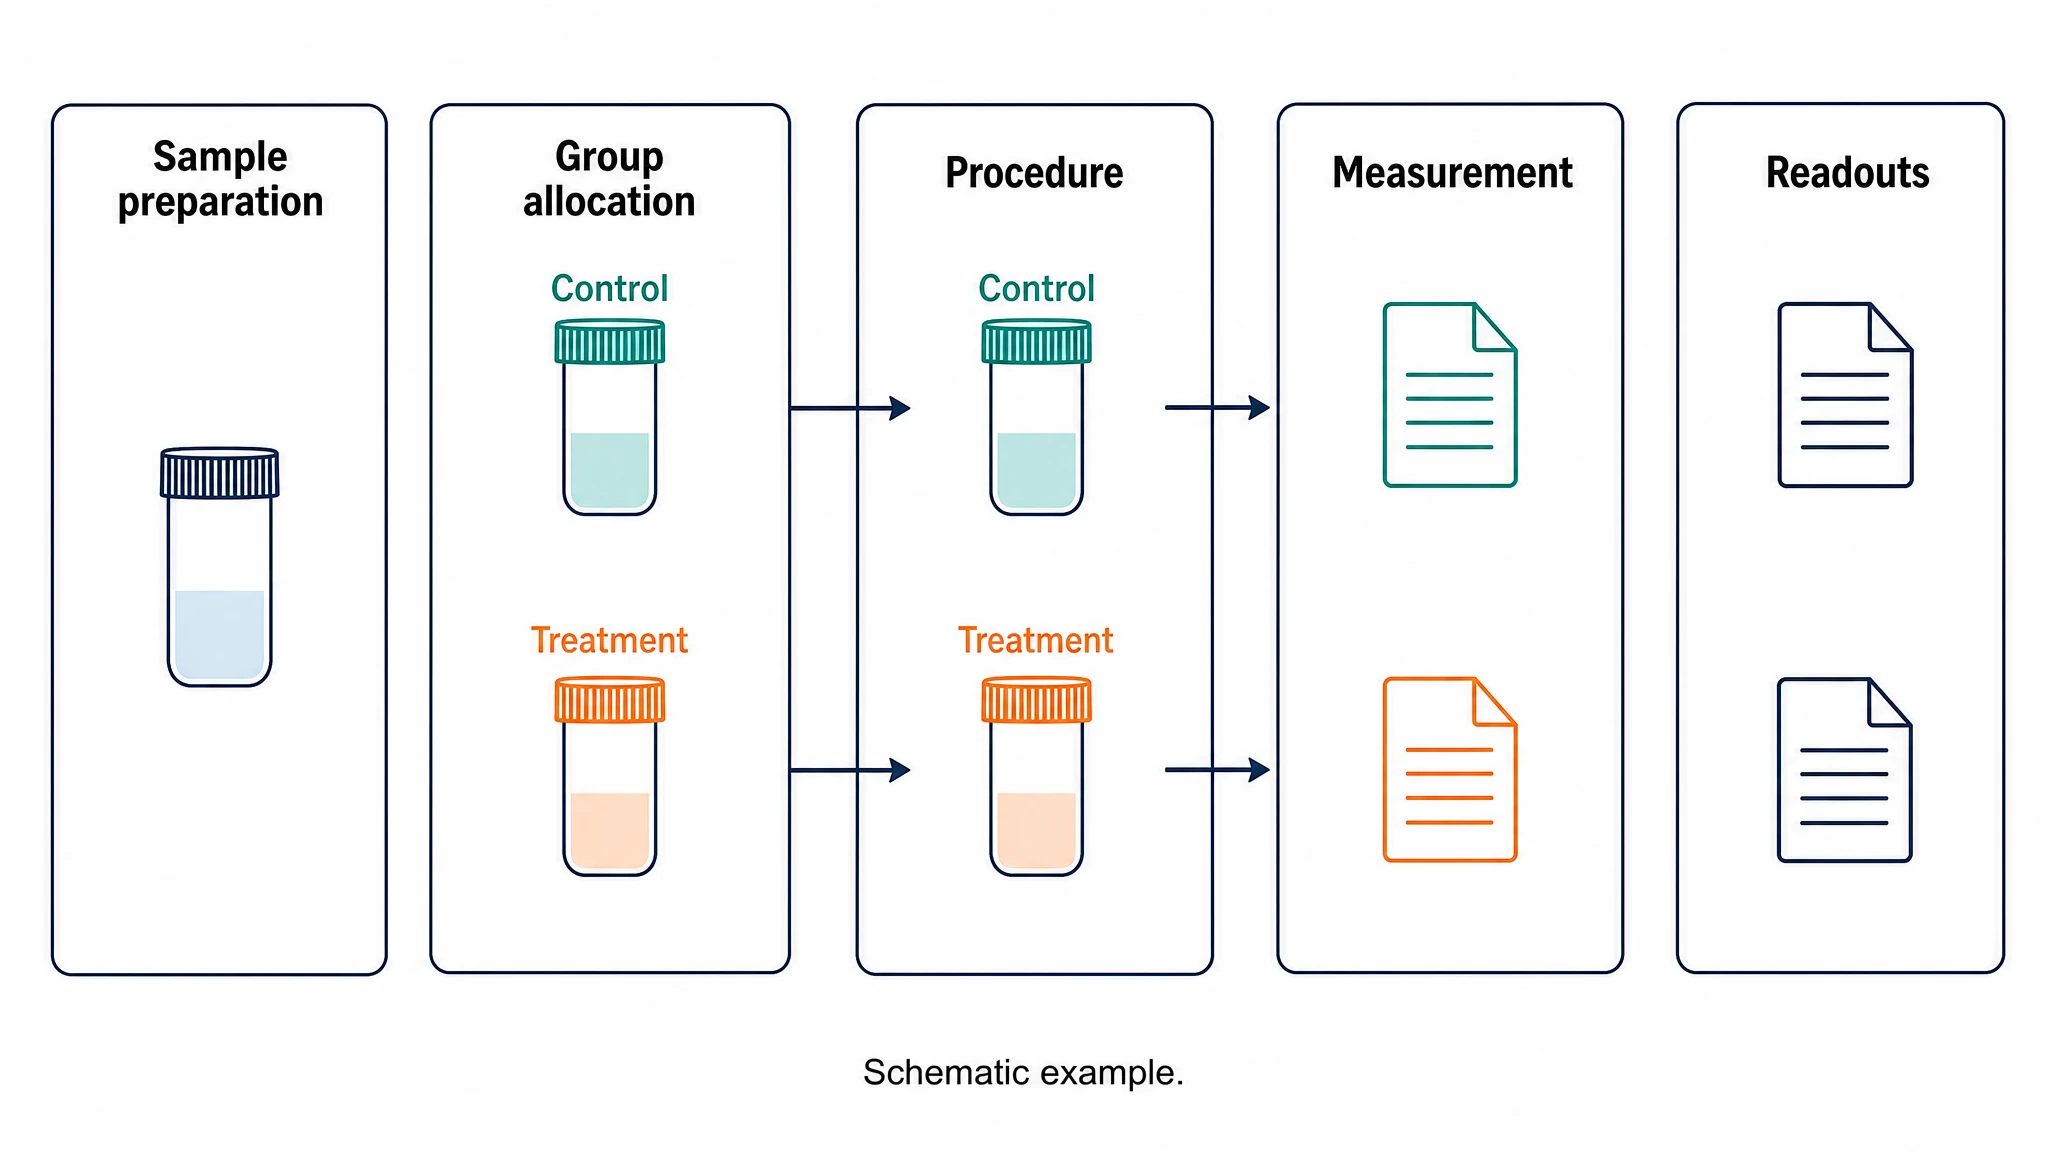
Show a laboratory procedure as a sequence of stages, materials and equipment. Provide the real protocol and identify the handoffs that need a visual explanation. Illustration builds a diagram for a methods slide or training document that follows your procedure step by step.

Explore this example
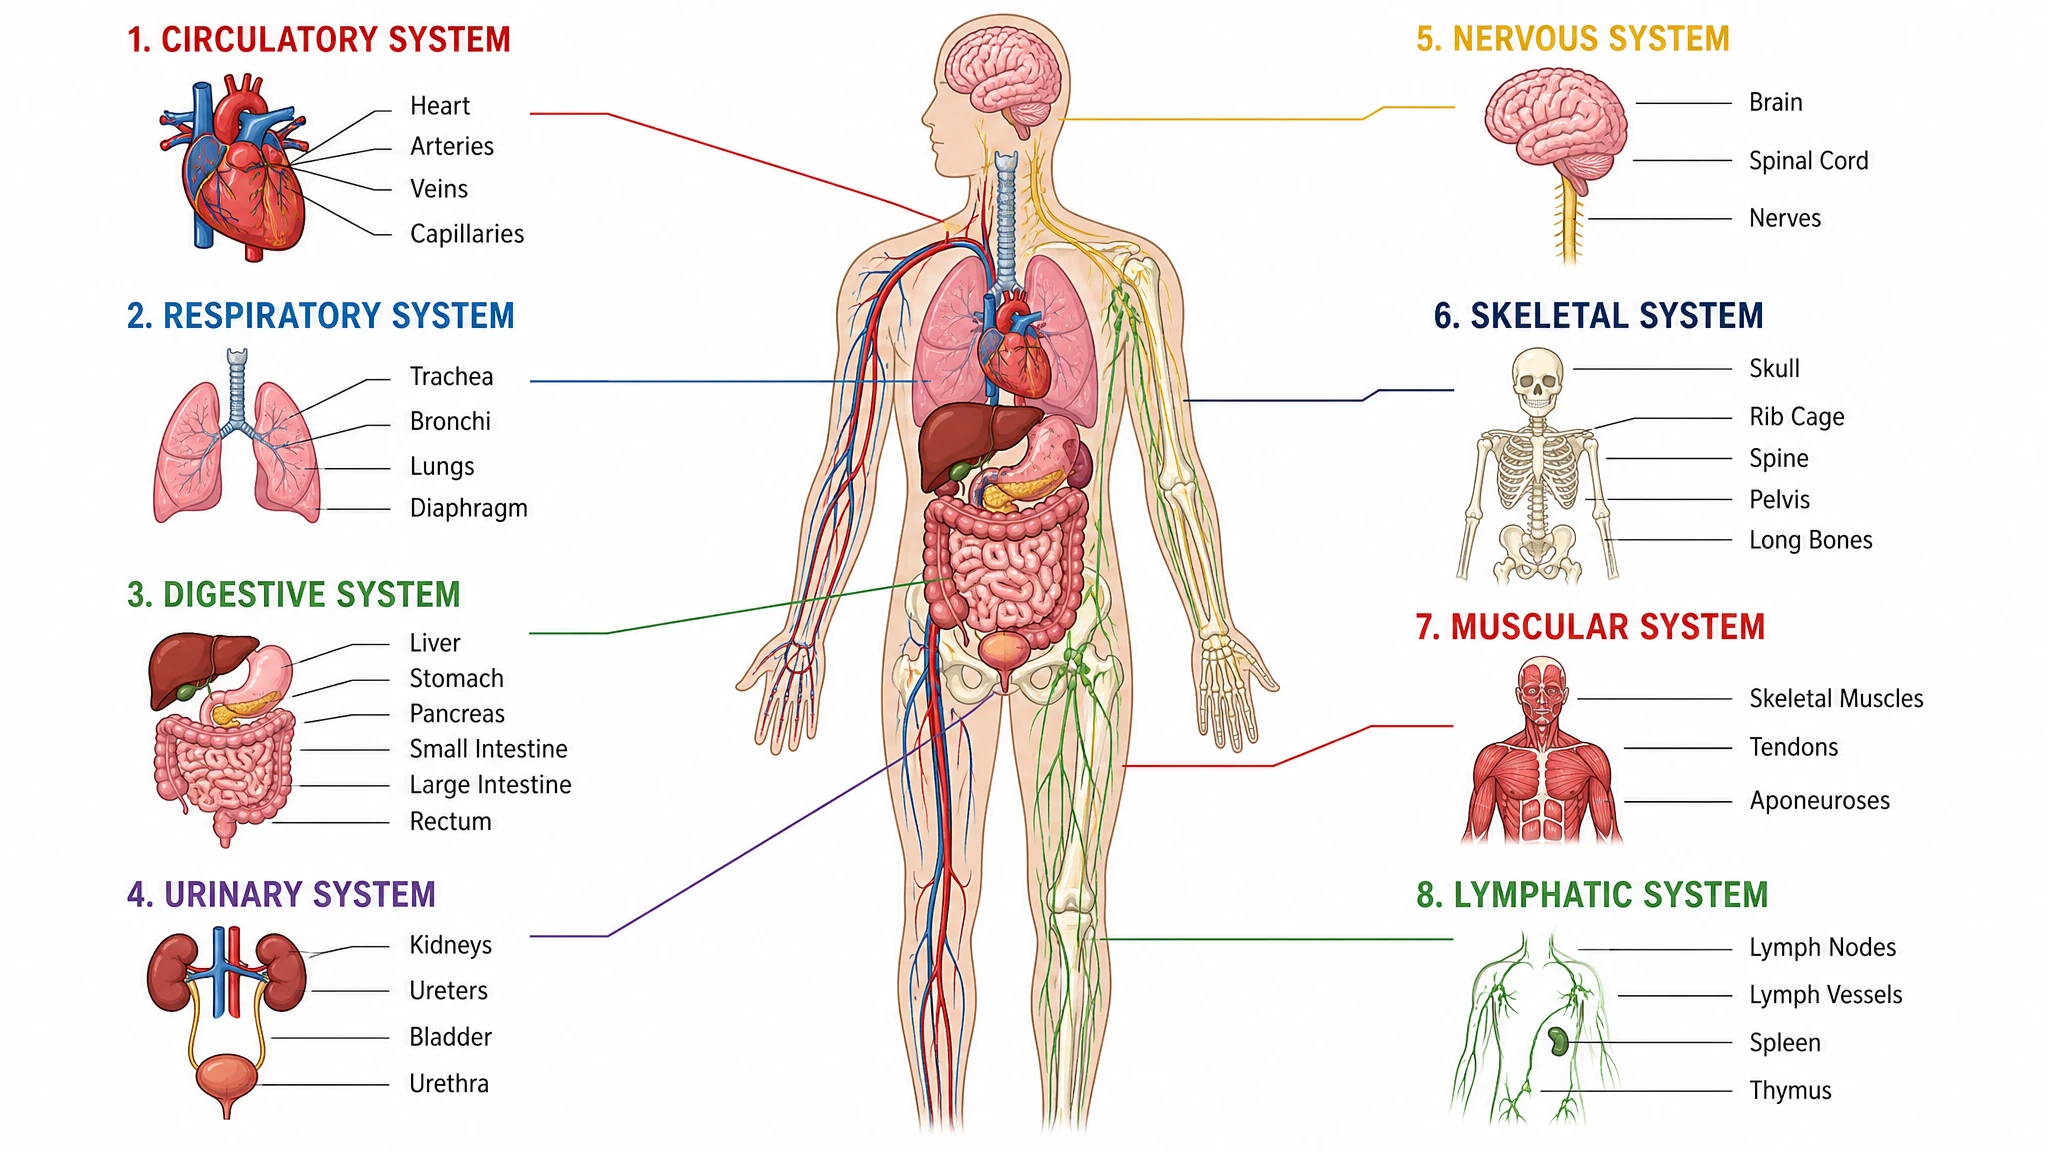
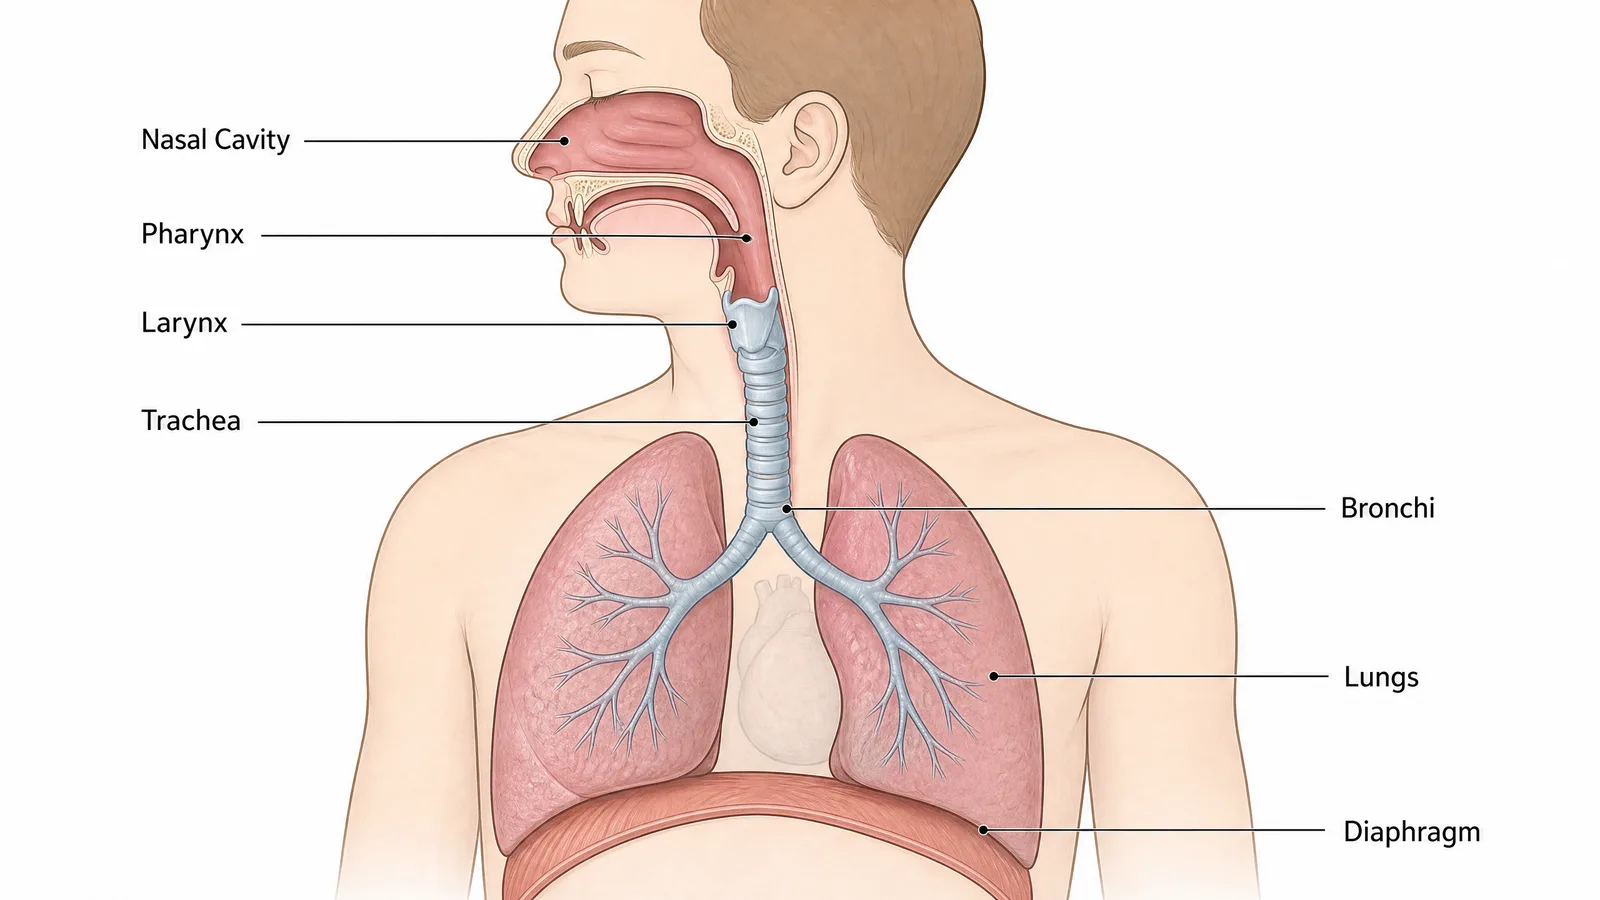
Anatomical concept diagram with English labels

Medical and Anatomical Teaching

Give an educational or research figure a clear anatomical focus. Name the structures, viewpoint and labels, then develop a composition that fits the reader’s level of knowledge. Every label stays editable, so the diagram is ready for a handout, poster or presentation.

Explore this example
Lipid nanoparticle uptake and mRNA translation in a dendritic cell

Figures for Lessons and Seminars

Explain a complex scientific idea at the level your audience needs. Select the essential structures and relationships, then refine the visual hierarchy and label size for the teaching format. The resulting figure can support discussion while keeping the meaning of simplified elements clear.

Explore this example
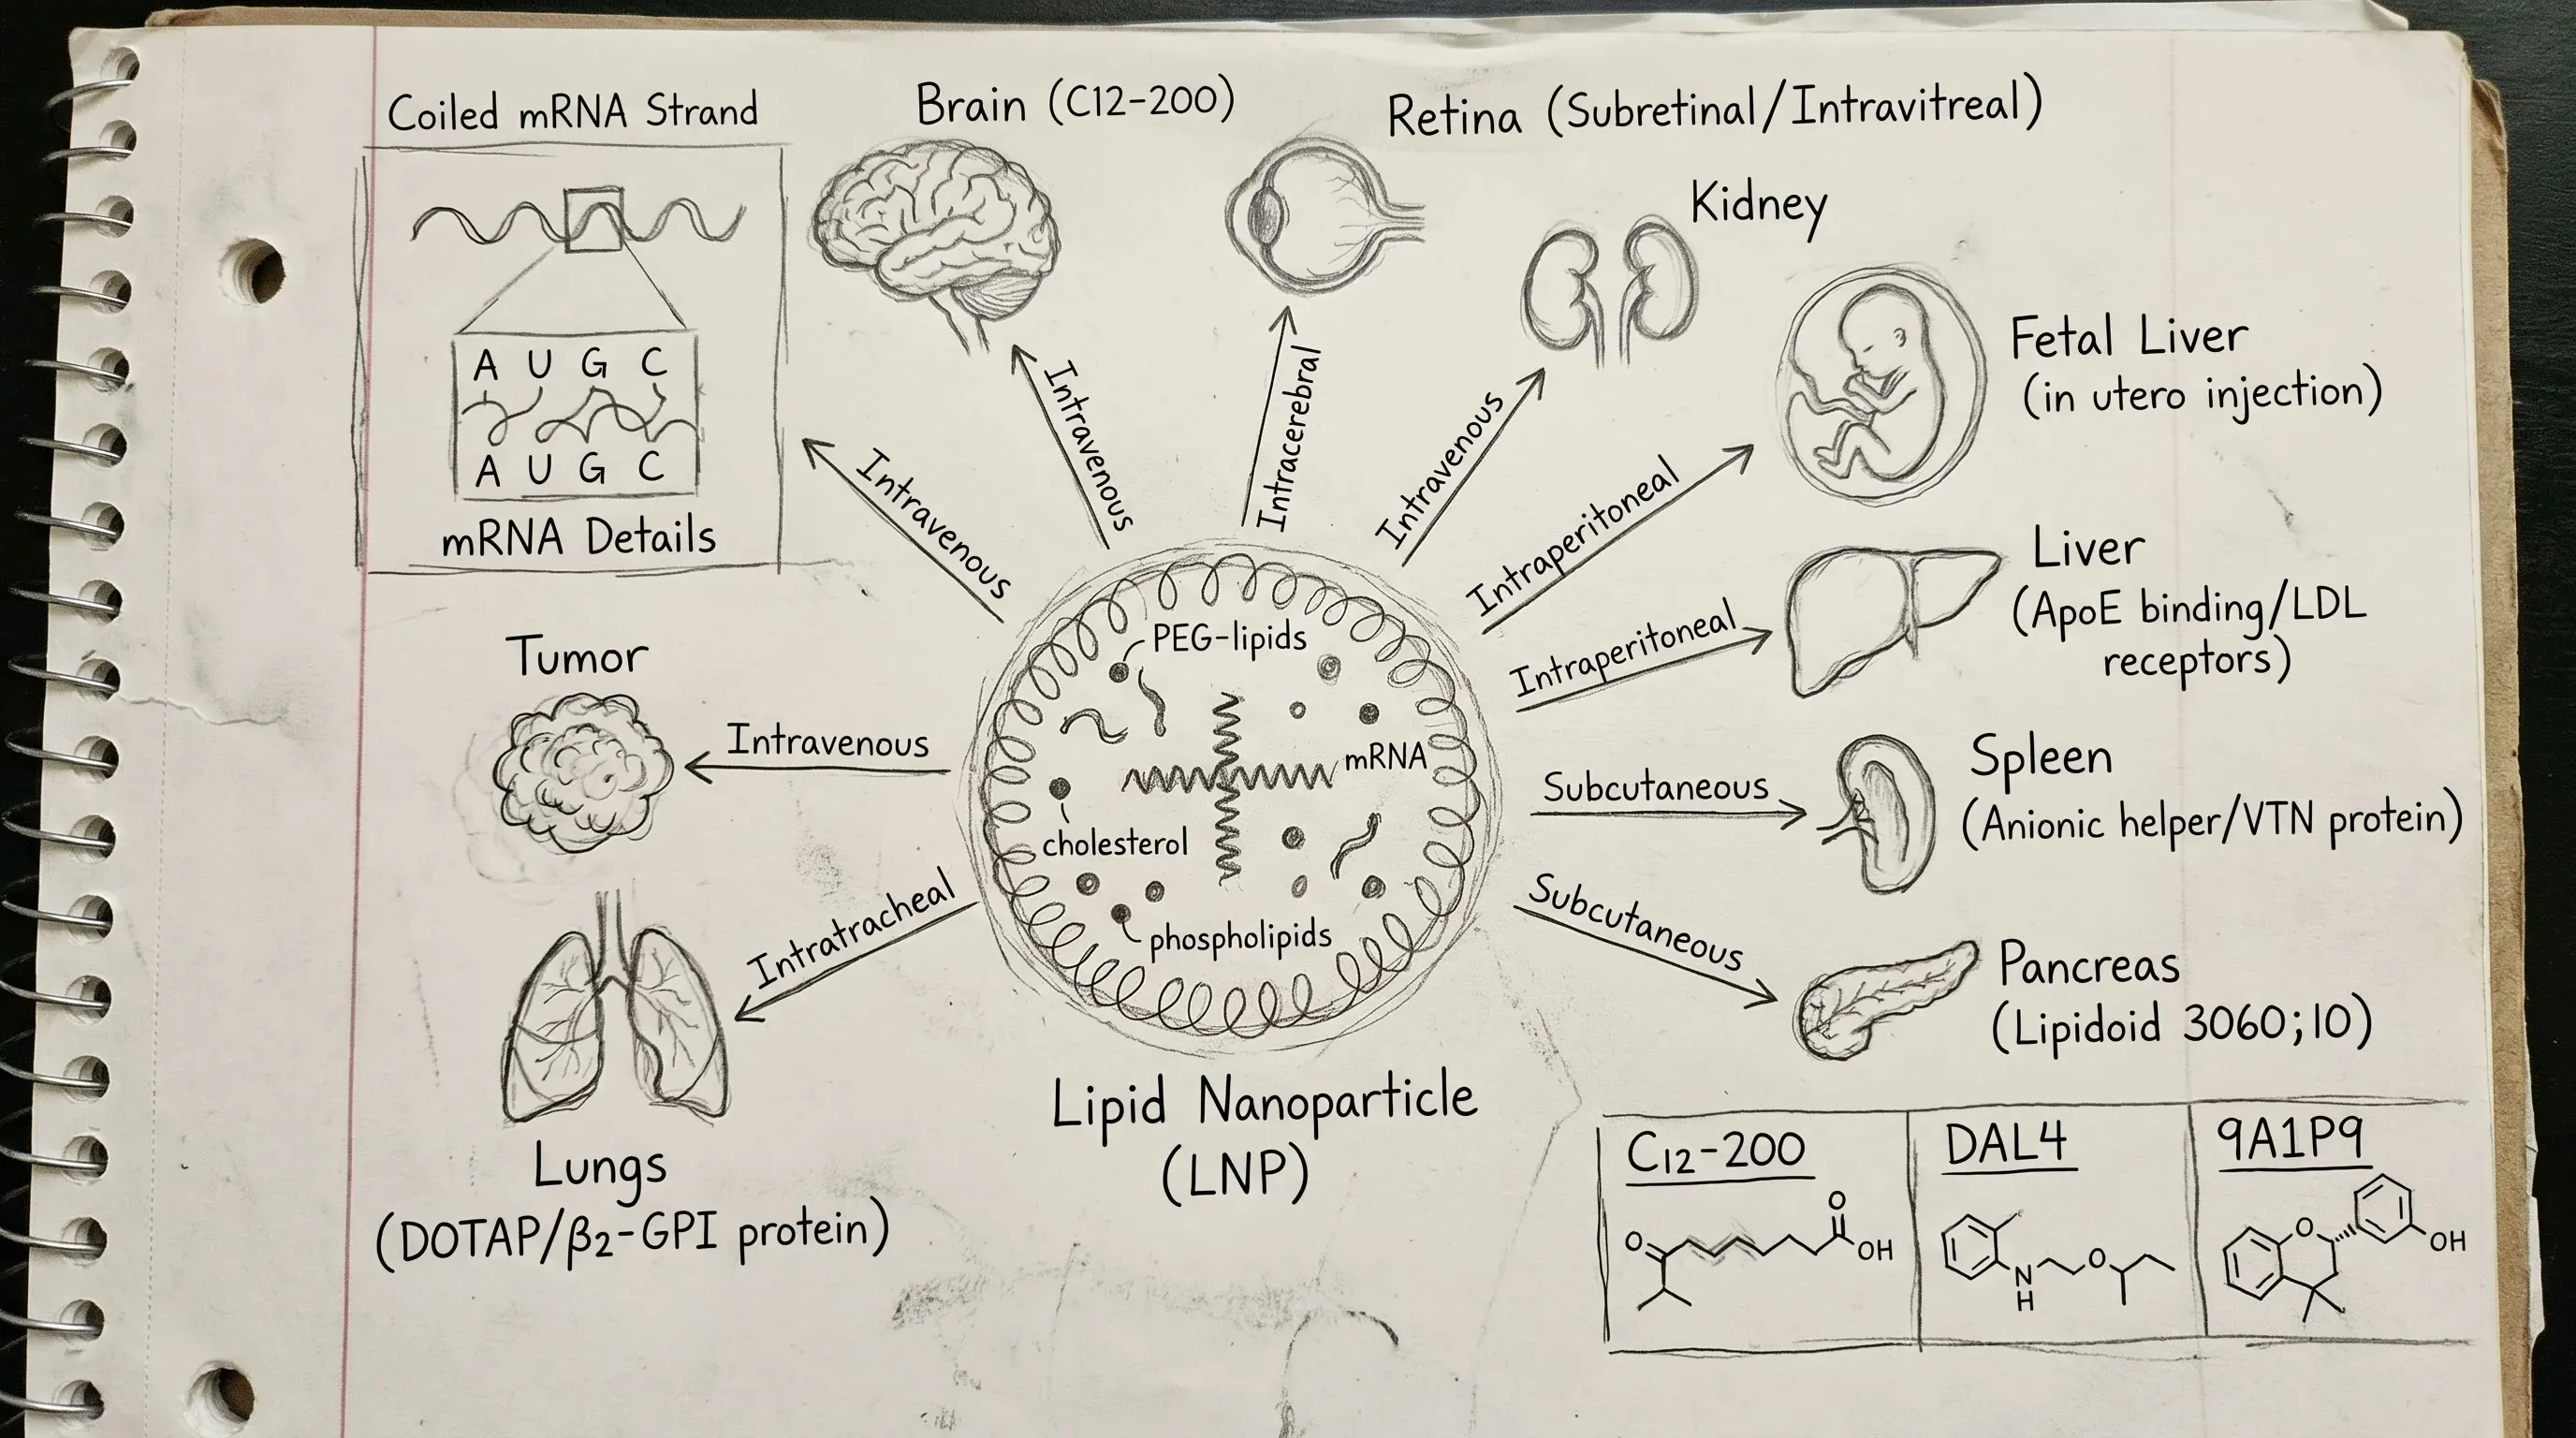
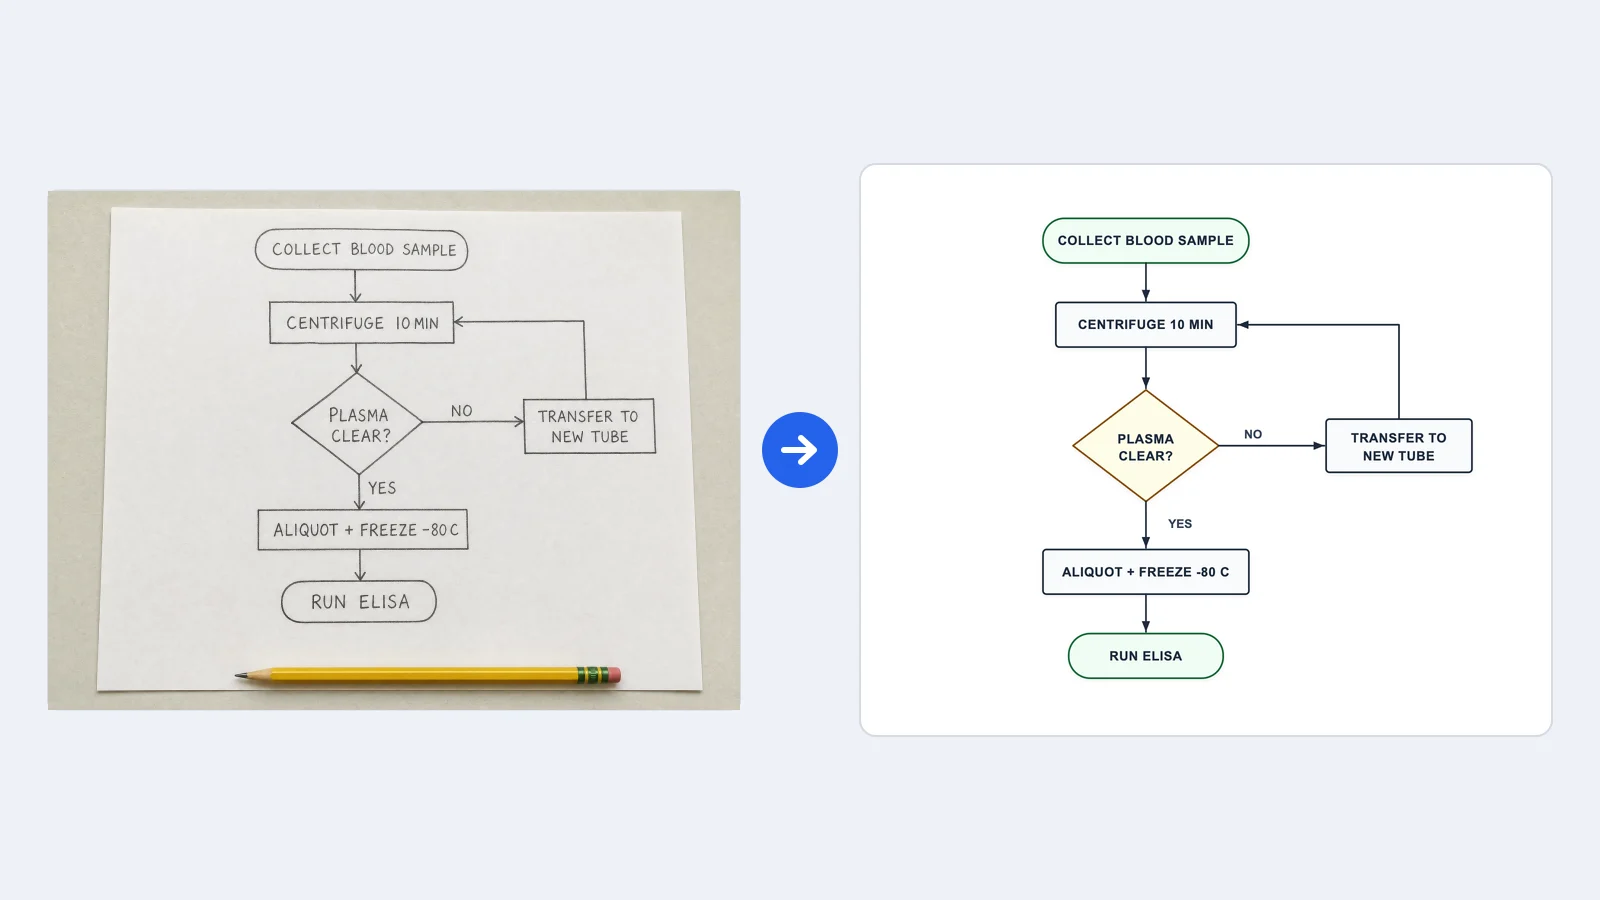
Sketch input used to describe a scientific figure
Scientific figure produced from the matching sketch example

Scientific Figures from Sketches

Bring a rough sketch showing the objects, arrows and layout you have in mind. Use the sketch-to-figure mode and explain which relationships to retain as Illustration develops the image. The resulting scientific figure gives collaborators a shared composition for a methods slide or research discussion.

Explore this example
AI Illustration Generator User Reviews

Research, teaching and presentation perspectives on using SciFig.

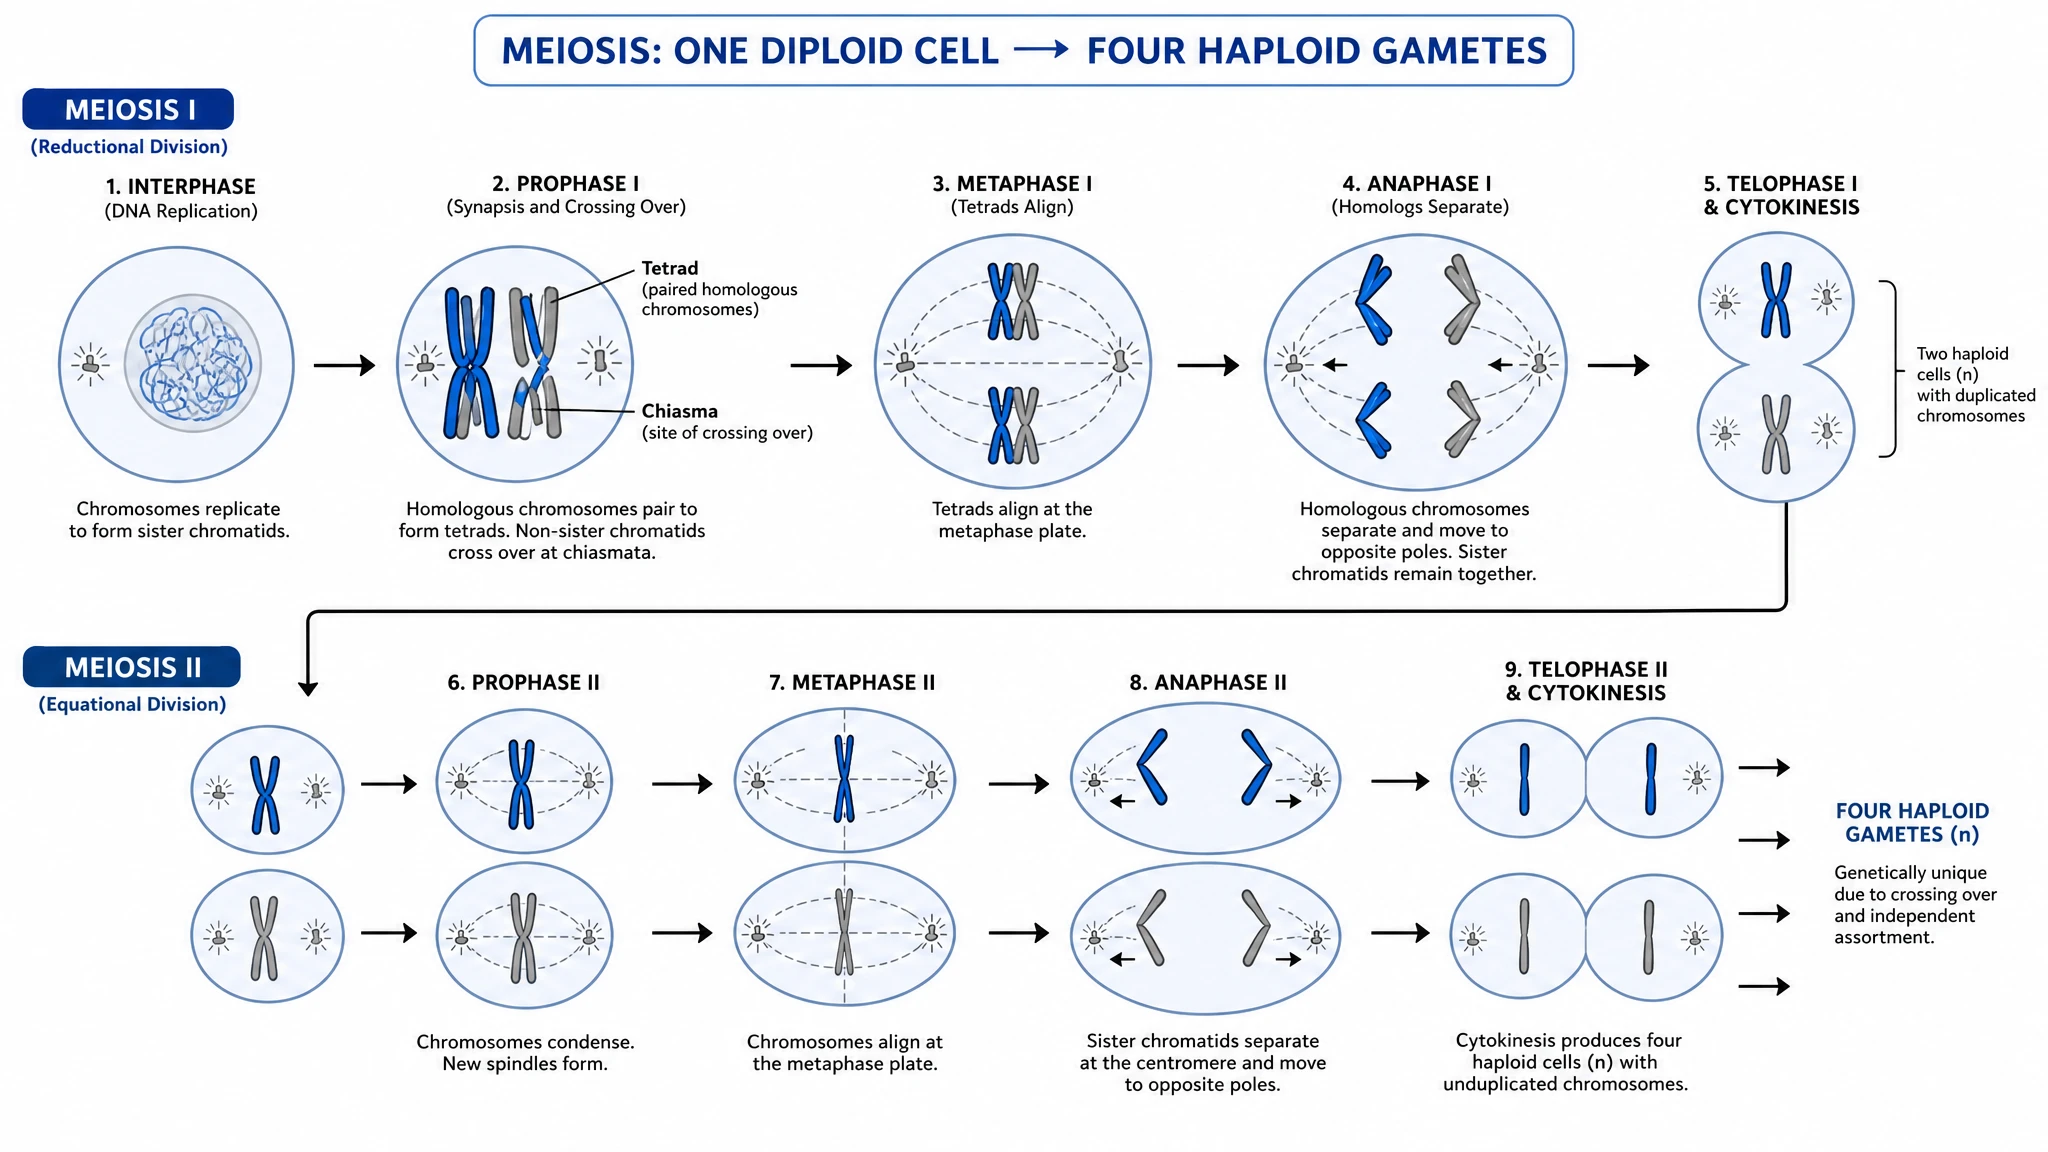
My project introduction needed an illustration that connected the tissue view with the cellular process. I gave the AI illustration generator a detailed brief and refined the labels and composition after the first draft. The final image gave our presentation a visual thread, making it easier to explain how the different scales related to the research question.
Ada Morgan

Neuroscience doctoral researcher, UCL

Free tools

A tool for every scientific figure

105 focused generators for the scientific figure you need — each opens in the right workspace with a matching example.

AI Illustration Generator FAQs

1.

2.

3.

4.

5.

6.

Call to action background

Your Next Scientific Figure

Create Your Next Scientific Illustration

Describe Your Figure

Free to start · No credit card required · Built for researchers