Ends Dec 1, PT
SciFig

Free 384-Well Plate Template and Layout Maker

Lay out screening plates, qPCR runs and 96-to-384 quadrant transfers on an editable 16x24 grid, from A1 to P24, and export the plate map.

Describe what you need in the box above.

Start with up to 150 free credits|No credit card required

Get up to 250 free credits on day one when you join through an invite.

3 figure engines · 500+ templatesEvery label editable · 60+ color schemesEditable PPTX · Layered SVG · 8K PNG / JPG

Free 384-Well Plate Template and Layout Maker— templates & examples

Updated

Sixteen rows, twenty-four columns

Free 384-Well Plate Template and Layout Maker

Turn 384 positions into a readable plan, with control columns, compound blocks and quadrants visible at a glance.

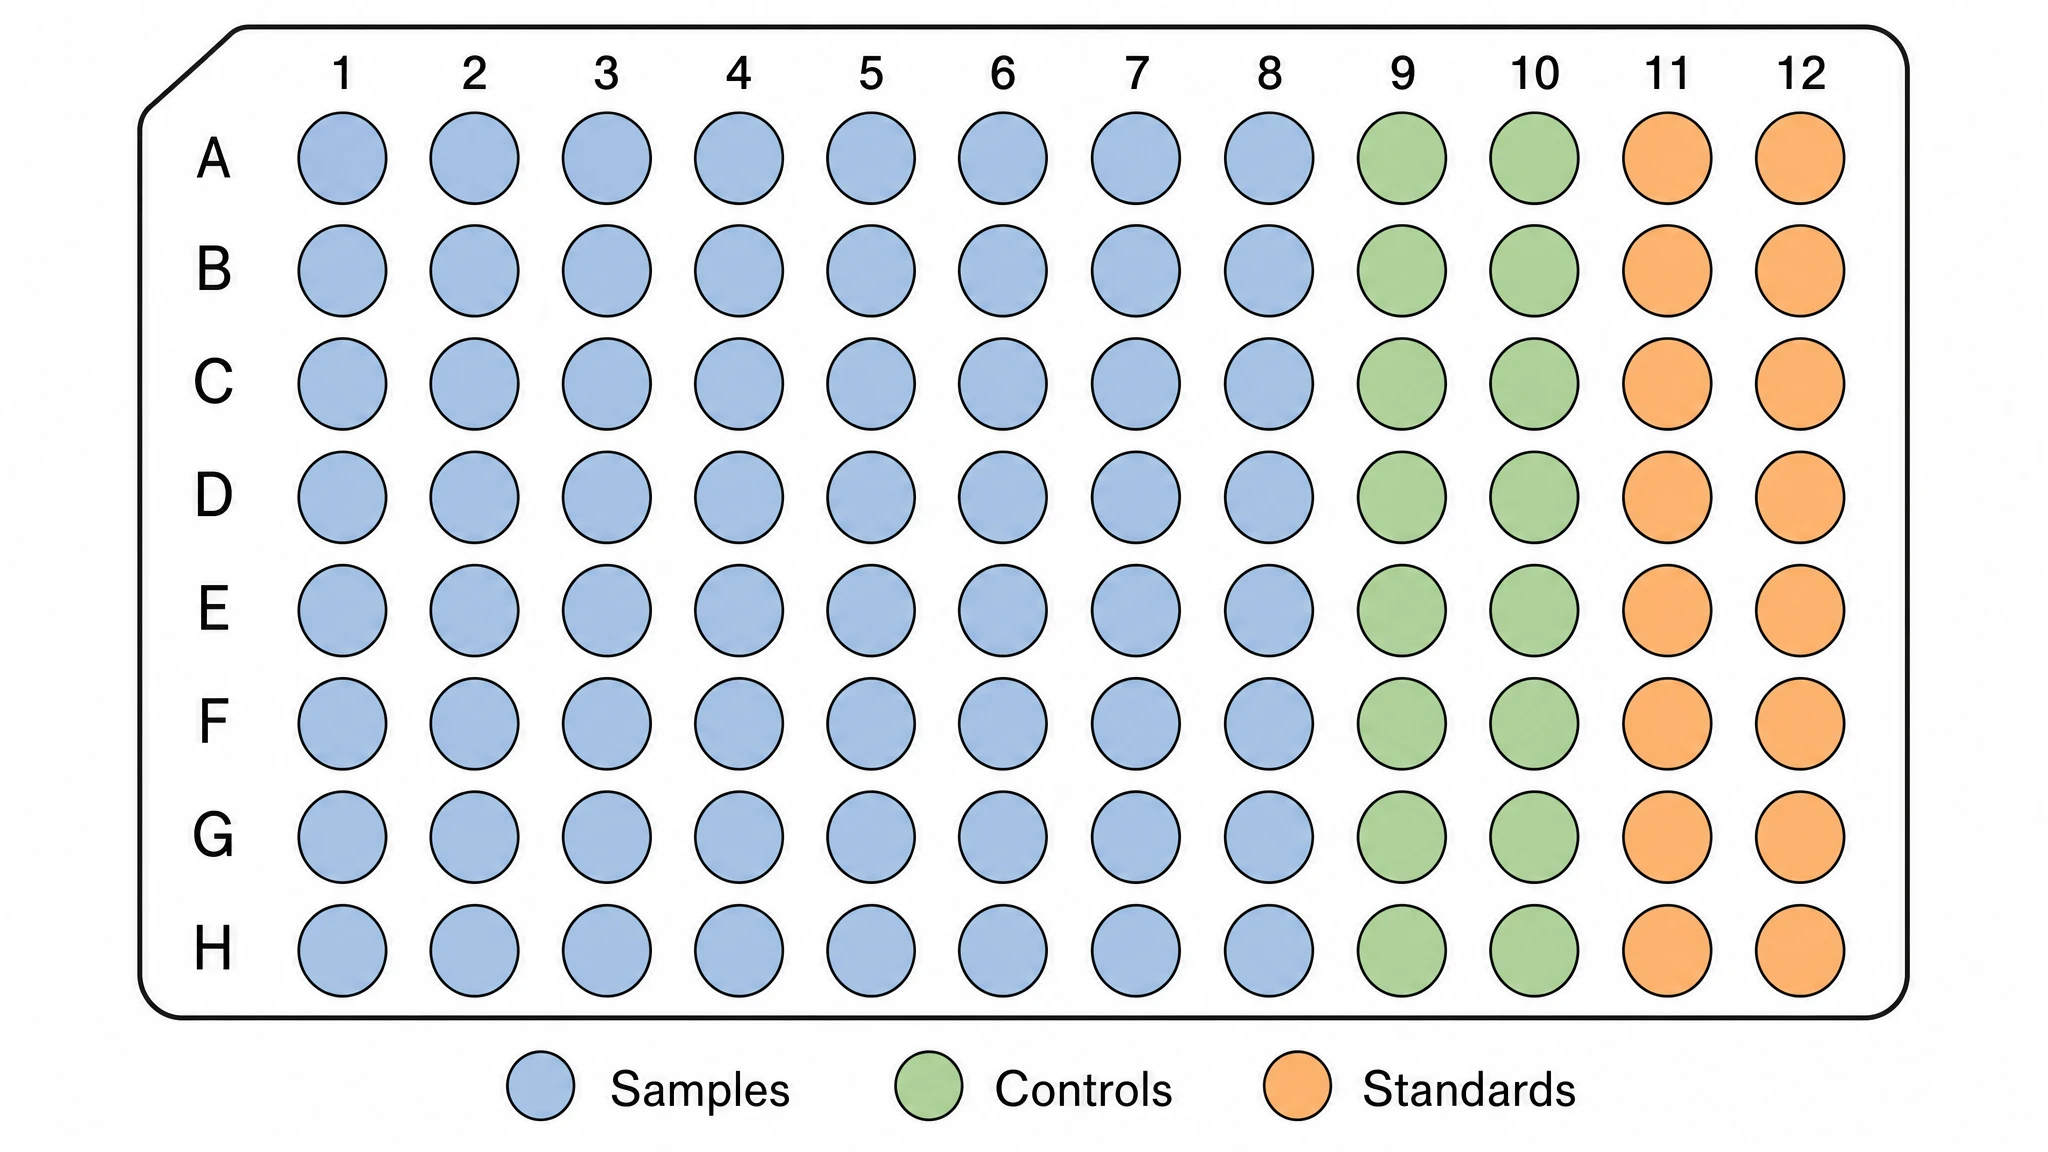
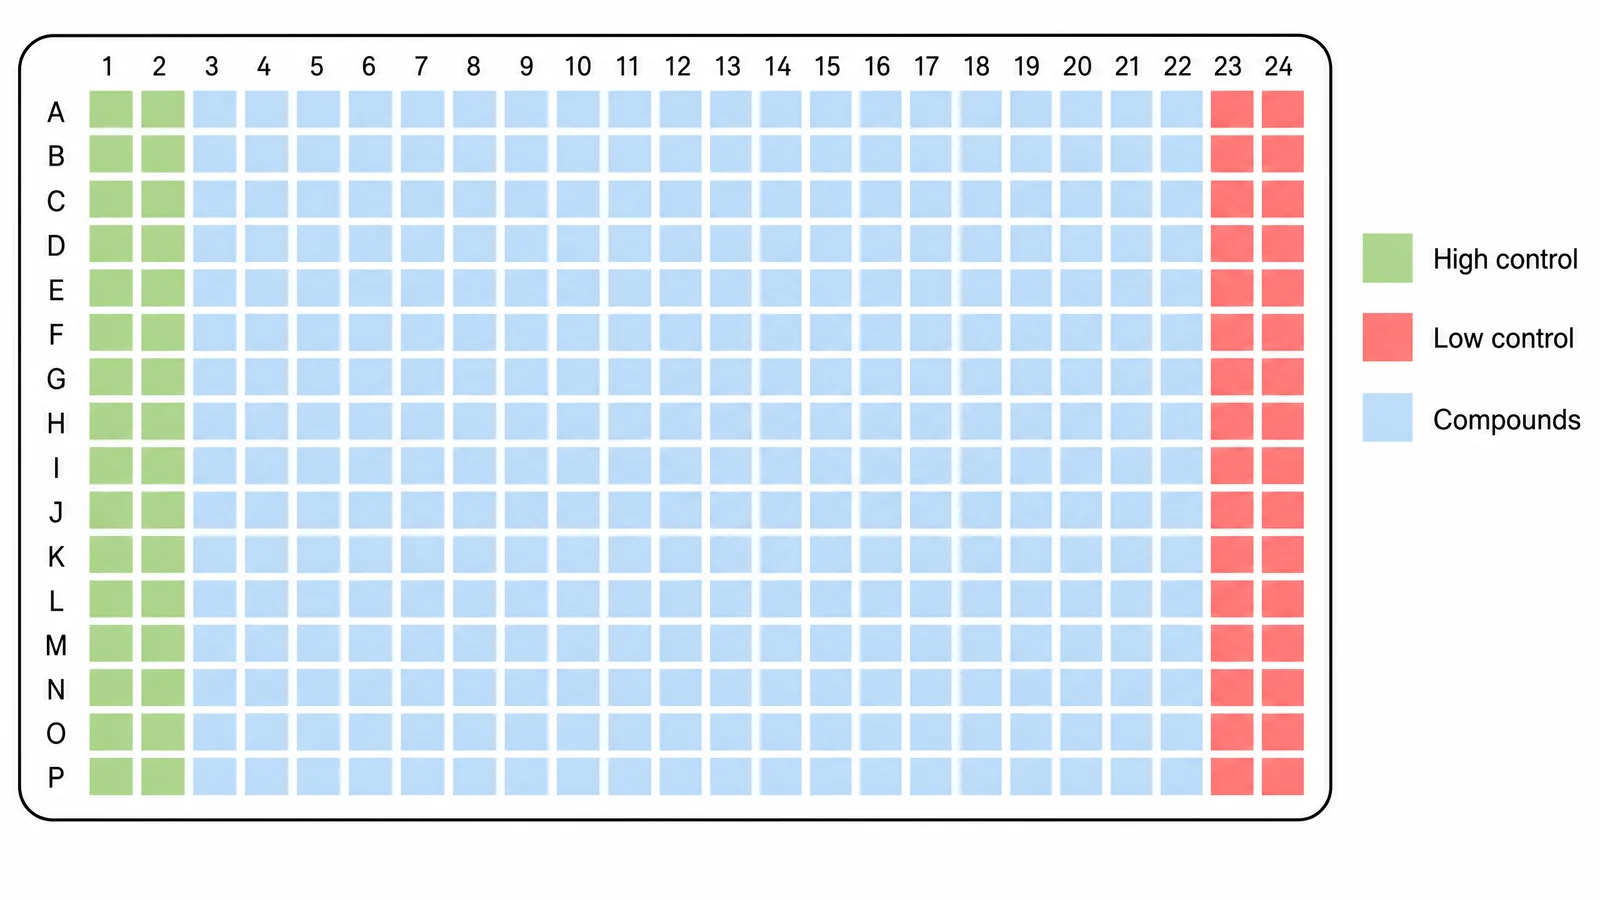
A 384-well plate template is a labeled 16x24 map of a 384-well plate, with rows A to P and columns 1 to 24, giving wells A1 to P24. With 384 positions, the template is how a screen keeps track of compounds, controls and replicates. SciFig AI Illustration (AI scientific illustration) generates the plate layout from your description and keeps it editable for export. At 384 wells, figures usually show blocks rather than single well labels: control columns at the edges, compound regions in the middle, or the four quadrants that receive a 96-well plate each.

384 well plate template with a 16x24 grid, rows A to P, columns 1 to 24 and control columns at both edges
  • Draw the 16x24 grid from A1 to P24
  • Block out control columns and compounds
  • Show 96-to-384 quadrant transfers
  • Export SVG, PNG, JPG or PPTX

384 Well Plate Template Features

A 384-well plate has too many wells to label one by one, so a useful figure shows structure: blocks, columns, quadrants and the data that come back.

Draw the full 16x24 grid with rows A to P

Describe the plate and SciFig AI Illustration draws 384 wells in sixteen rows (A to P) and twenty-four columns (1 to 24), at the 4.5 mm spacing of the standard format. The 384 well plate template keeps row letters and column numbers readable even at this density.

  • Rows A to P, columns 1 to 24
  • Square or round wells
  • Readable row and column labels
Draw the 16x24 grid

Block out control columns and compound regions

Many screening layouts keep controls in the outer columns, for example columns 1, 2, 23 and 24, and place test compounds in columns 3 to 22. A 384 well plate layout drawn this way shows high and low controls, DMSO wells and sample regions as colored blocks with a legend.

  • High and low control columns
  • Vehicle or DMSO wells
  • Compound regions as blocks
Block out the plate

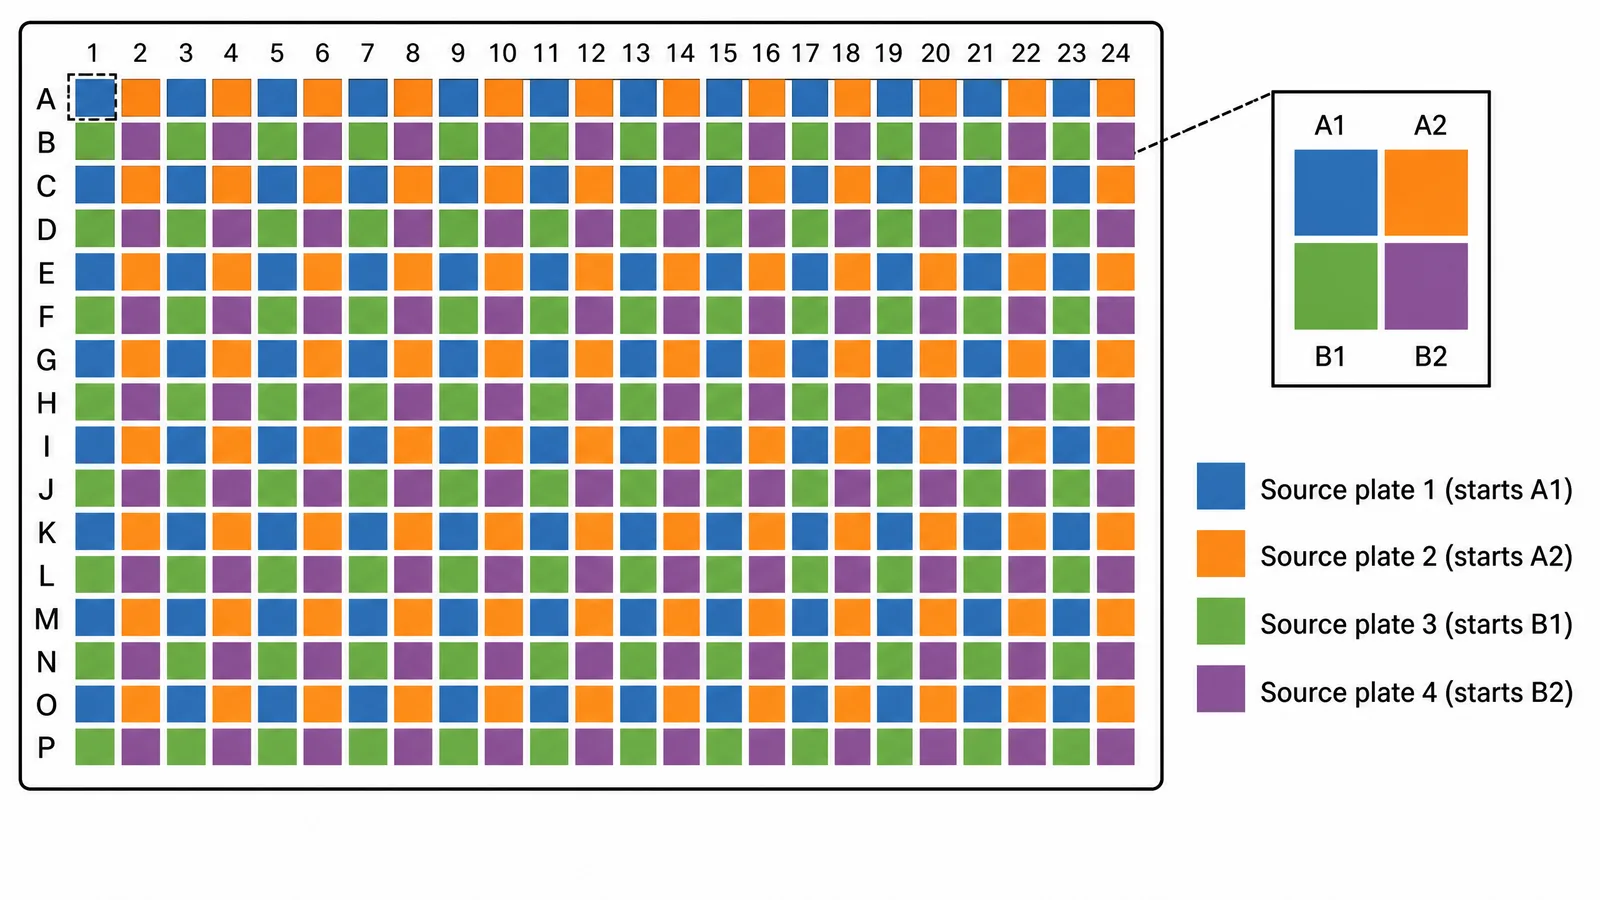
Show how four 96-well plates map into 384

Because the well spacing is half that of a 96-well plate, each 96-well position maps to a 2x2 block of 384 wells. Color the four quadrants that start at A1, A2, B1 and B2, and the 384 well plate map documents which source plate went where. Working with 48 wells? Choose the 48-well plate template to describe that layout.

  • Quadrant offsets A1, A2, B1, B2
  • Source plate per quadrant
  • Interleaved 2x2 blocks
View the 48-well plate template

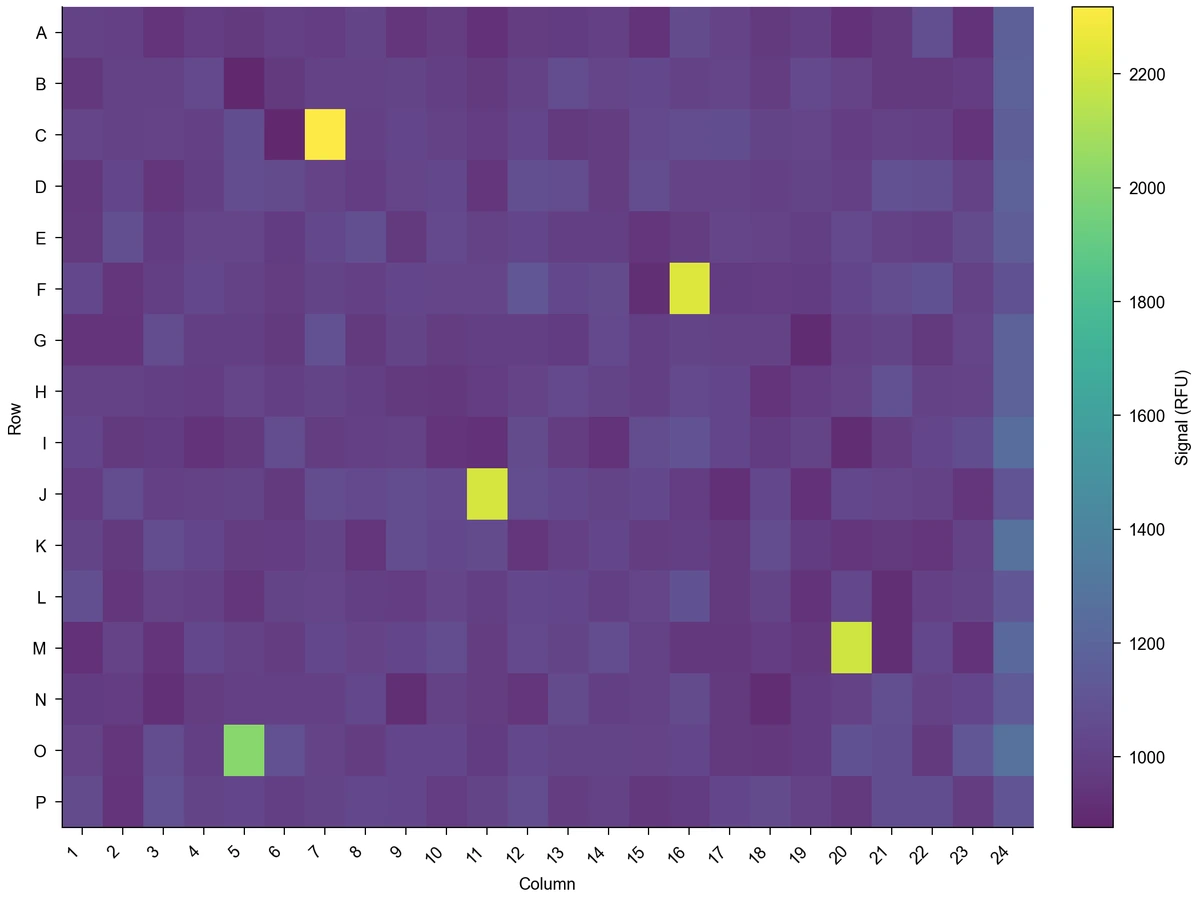
Plot reader values as a plate heatmap

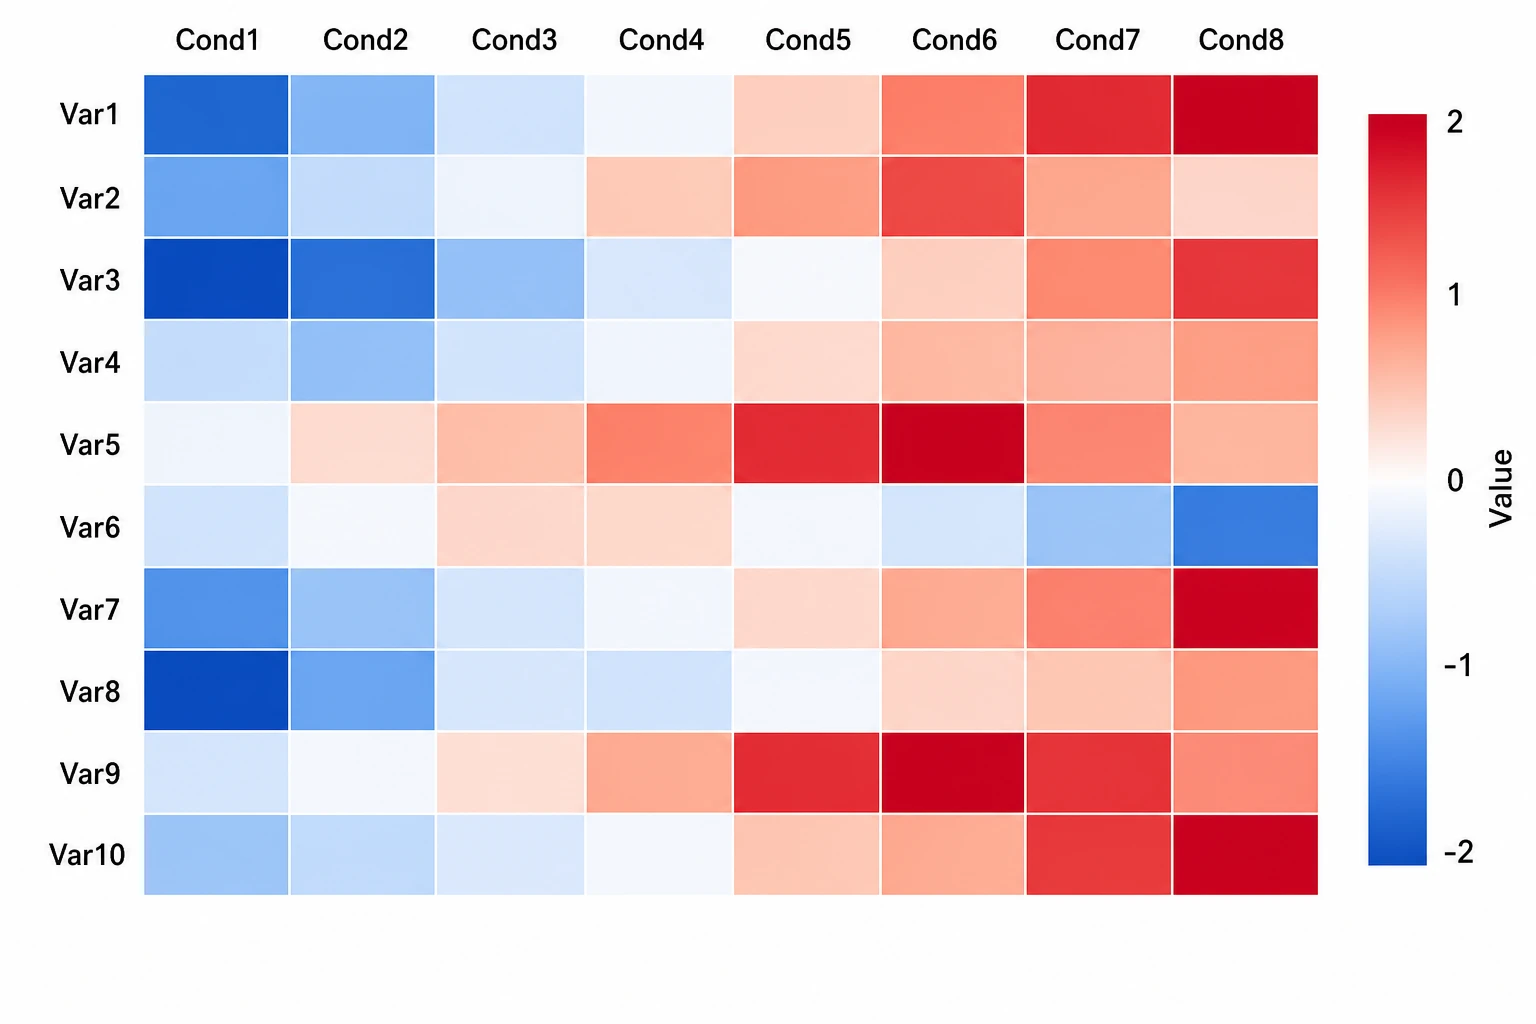
When the plate comes off the reader, SciFig DataChart (charts and graphs from your data) can draw the values as a heatmap: rows A to P as labels and columns 1 to 24 as numeric columns from a CSV or Excel file, with optional values printed in each cell, so edge effects and hits stand out. Working with 96 wells? Choose the 96-well plate template to describe that layout.

  • CSV or Excel reader export
  • 16 labeled rows by 24 columns
  • Optional value labels in cells
View the 96-well plate template

384 Well Plate Layout: How to Plan One

Plan the plate as regions first, then let the figure carry the detail.

  1. Define regions, not single wells

    Write the plate as column and row ranges: controls in columns 1, 2, 23 and 24, compounds in columns 3 to 22, or four source plates in the quadrants starting at A1, A2, B1 and B2. Note replicate patterns and any edge rows left empty.

  2. Describe the plate in the composer

    Paste the ranges into the composer above and ask for a 384-well plate with rows A to P and columns 1 to 24. Name each region with a short label, such as high control, low control or compound block, so the legend stays compact.

  3. Generate the 384-well plate figure

    SciFig AI Illustration generates the plate with regions colored and a legend. For a printable blank grid or a version that highlights only the quadrants, describe that variant and generate again.

  4. Refine and export

    Use Edit in Canvas to convert the figure to SVG and adjust labels, colors and the legend. Export SVG for a methods figure, PNG or JPG for a run sheet, or PPTX for a screening review meeting.

384 Well Plate Map Uses

Wherever 384-well plates run, someone needs a map that a robot operator, an analyst and a reviewer can all read the same way.

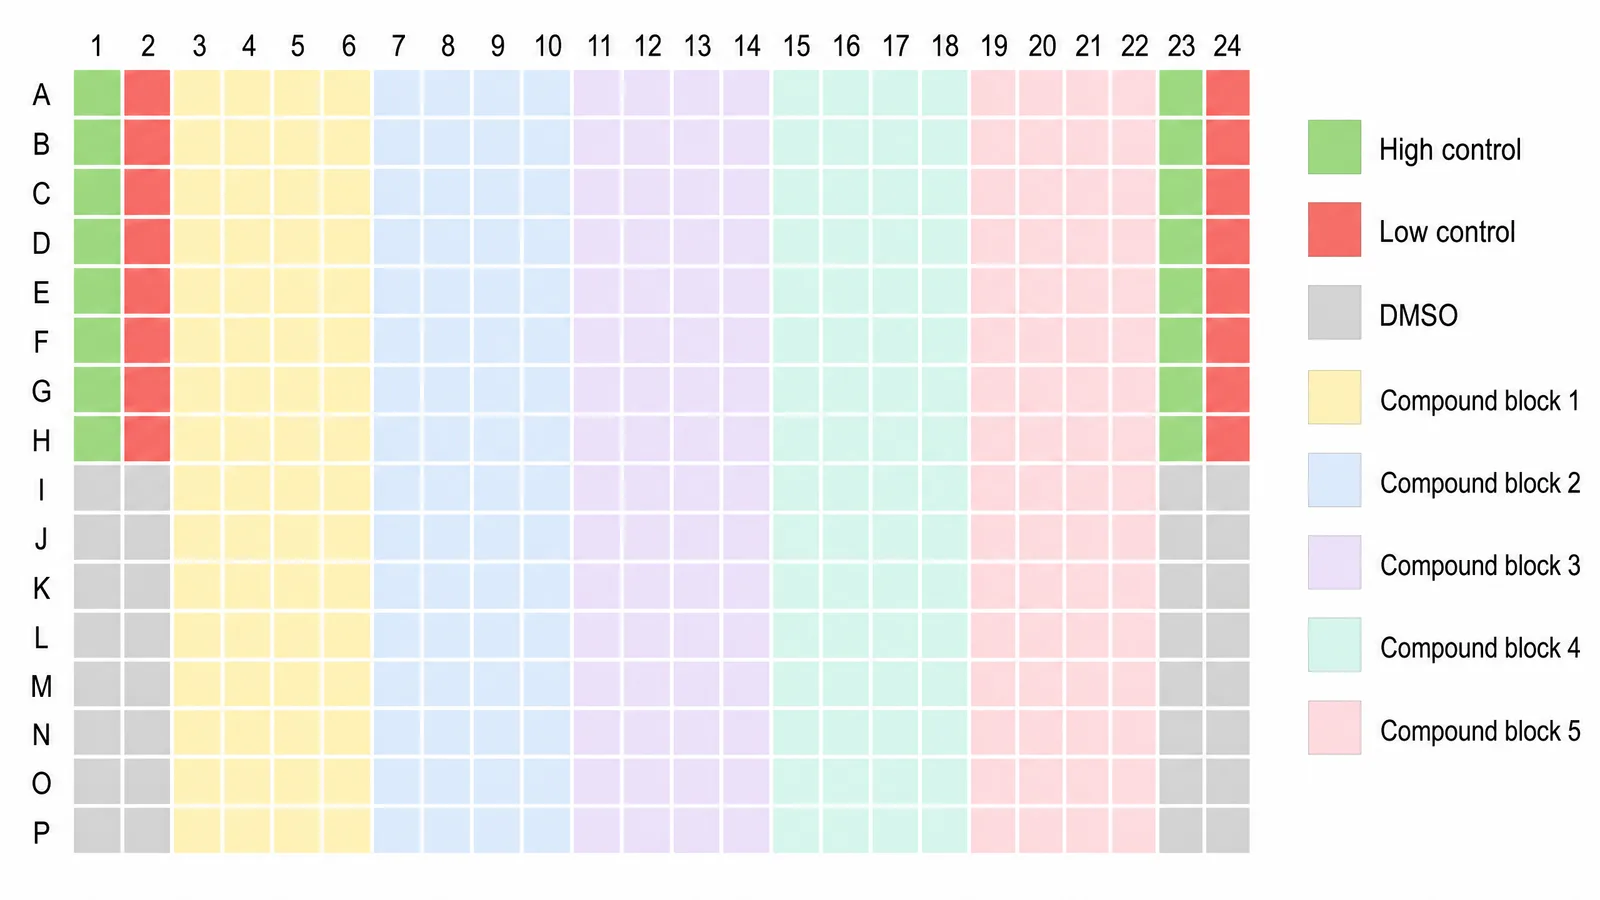
384 well plate layout with control columns, DMSO wells and five compound blocks for a screen

Plan a compound screening plate

Show where test compounds, high and low controls and DMSO wells sit so the plate passes the controls-based quality check you use, such as Z-prime. The 384 well plate layout becomes the reference for liquid handling and analysis.

Explore this example
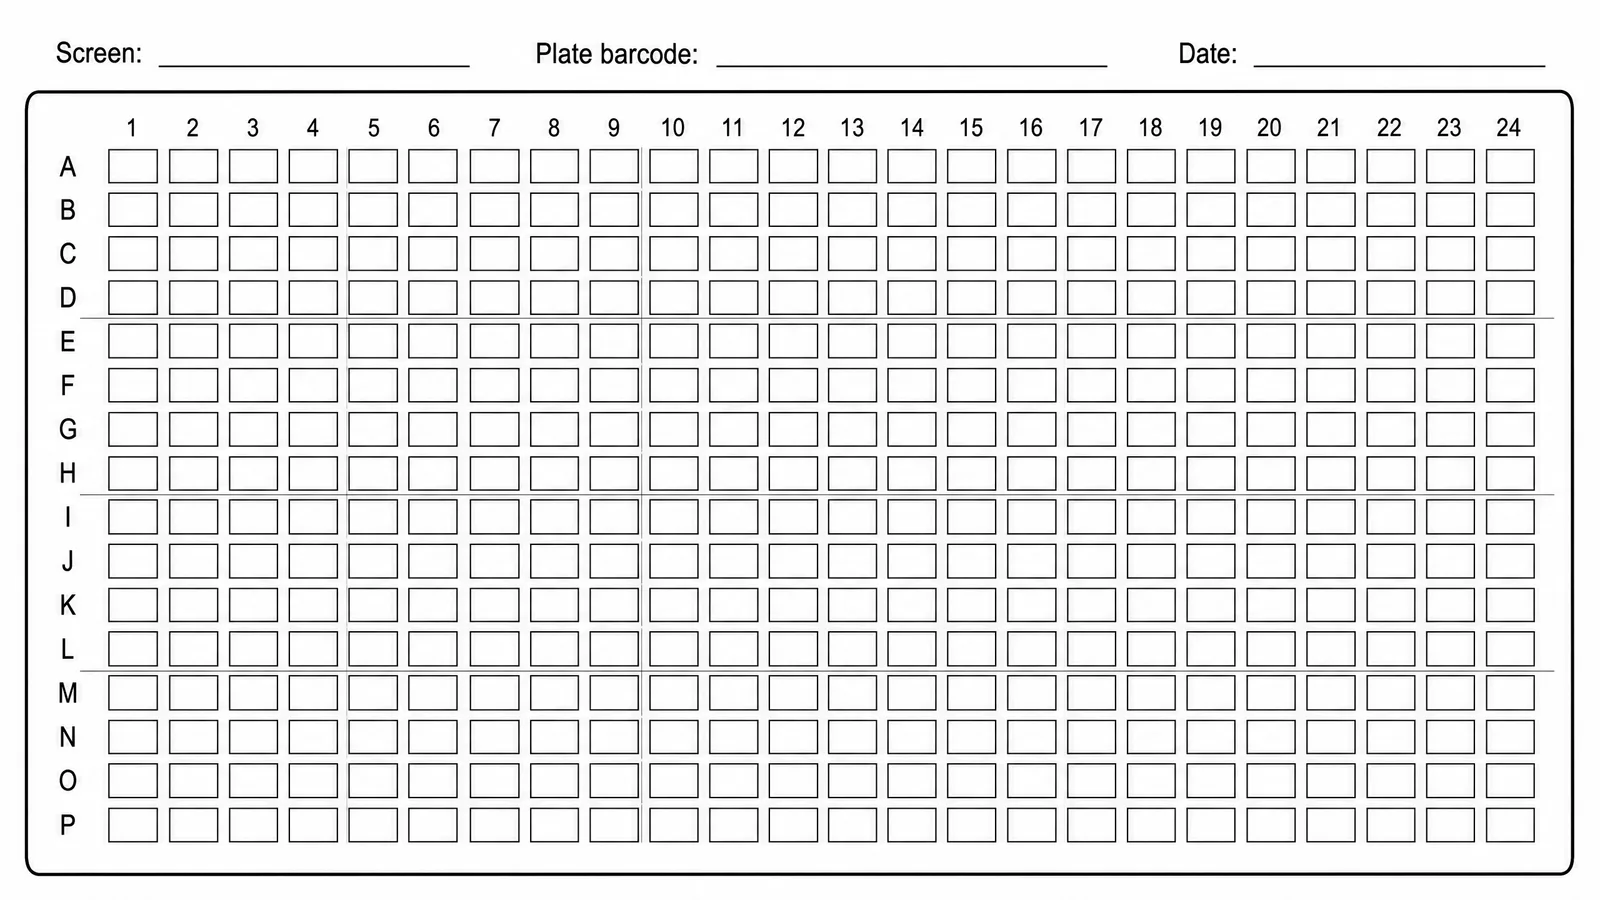
Blank printable 384 well plate template with empty wells, rows A to P and columns 1 to 24

Prepare a 384-well qPCR run

Map targets, samples, no-template controls and replicates across the plate before loading. A labeled run sheet keeps the plate and the instrument setup file in agreement.

Explore this example
384 well plate map showing four interleaved quadrants starting at A1, A2, B1 and B2 for four 96-well source plates

Document a 96-to-384 reformatting step

When four 96-well source plates are combined, the quadrant map shows which source plate fills each interleaved 2x2 position, so downstream data join back to the right samples.

Explore this example
384-well plate heatmap of reader values with rows A to P and columns 1 to 24 and a color bar

Visualise a plate as a heatmap

Load the reader export with rows A to P and columns 1 to 24 into SciFig DataChart and draw it as a heatmap to spot edge effects, gradients and hits across the whole plate.

Explore this example
384 well plate layout with control columns, DMSO wells and five compound blocks for a screen

Plan dose-response curves on one plate

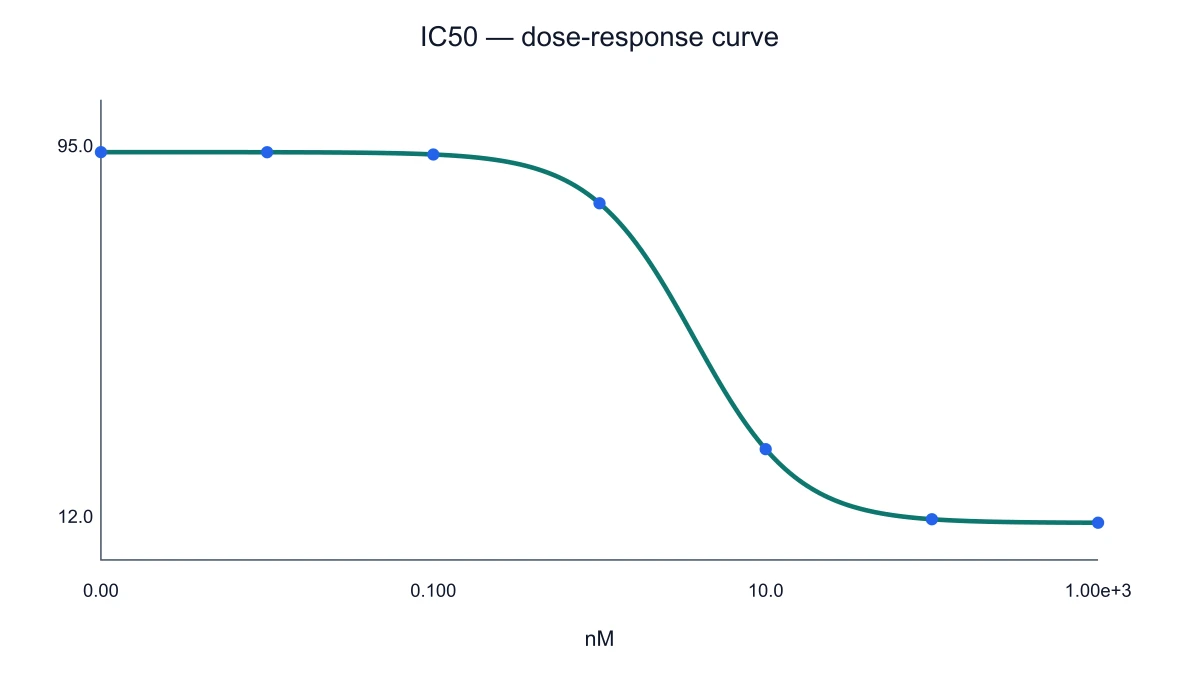
Ten-point dilutions in replicate fit along rows of a 384-well plate. After the run, the curves themselves can be fitted and plotted on the dose-response curve page.

Explore this example
384 well plate template with a 16x24 grid, rows A to P, columns 1 to 24 and control columns at both edges

Step back to a 96-well layout

Pilot assays and manual pipetting often stay in 96 wells. Build the 8x12 map on the editable 96-well plate page and keep the same labeling style when the assay scales to 384.

Explore this example
384 Well Plate Templates in Real Screens

Our screening plates follow one rule: controls in columns 1, 2, 23 and 24. I described that 384 well plate template once, exported the SVG, and it now heads every assay protocol. New operators see the control columns before they touch the liquid handler, and nobody has to ask where the controls go.

Marcus Holloway

High-throughput screening scientist · University of Dundee

Free tools

A tool for every scientific figure

156 focused generators for the scientific figure you need — each opens in the right workspace with a matching example.

Illustrations, structures and concept diagrams

87 tools
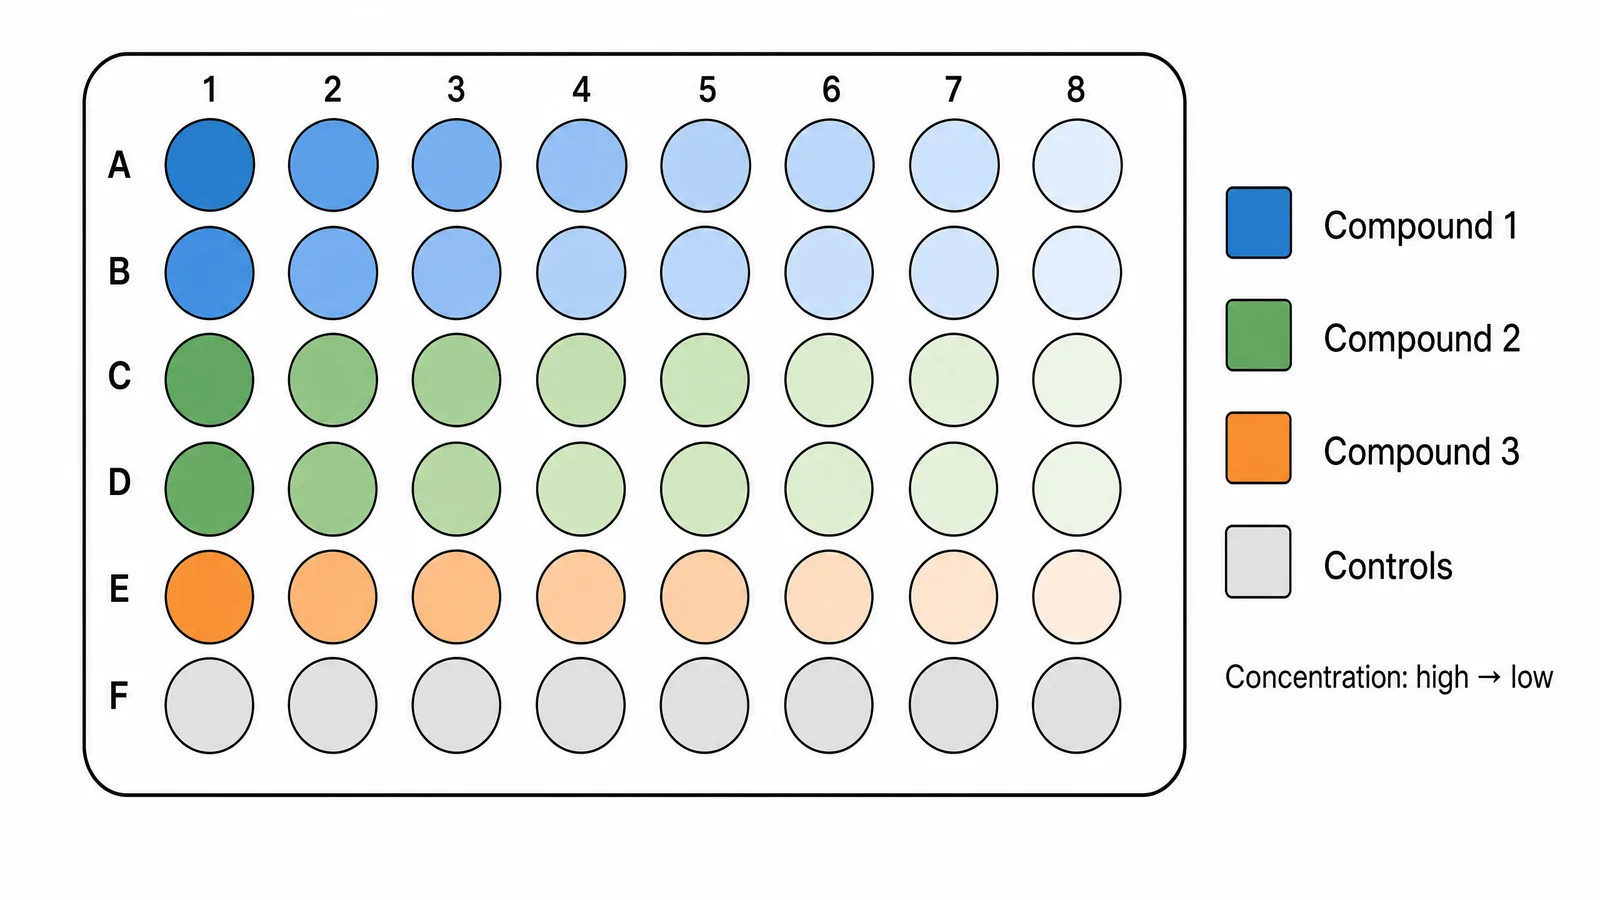
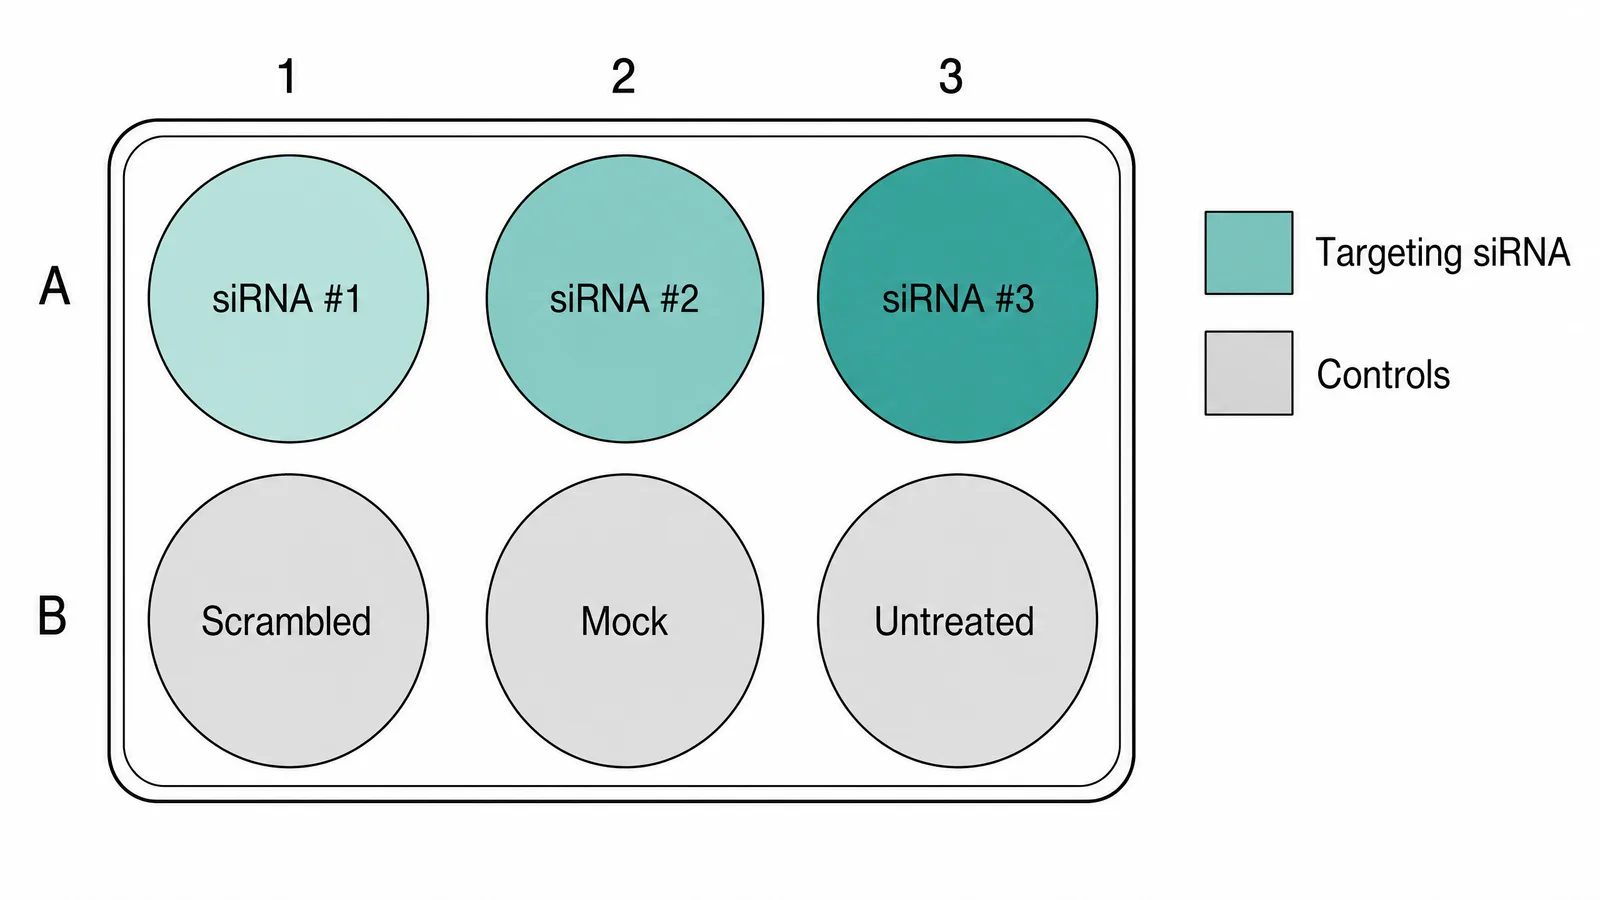
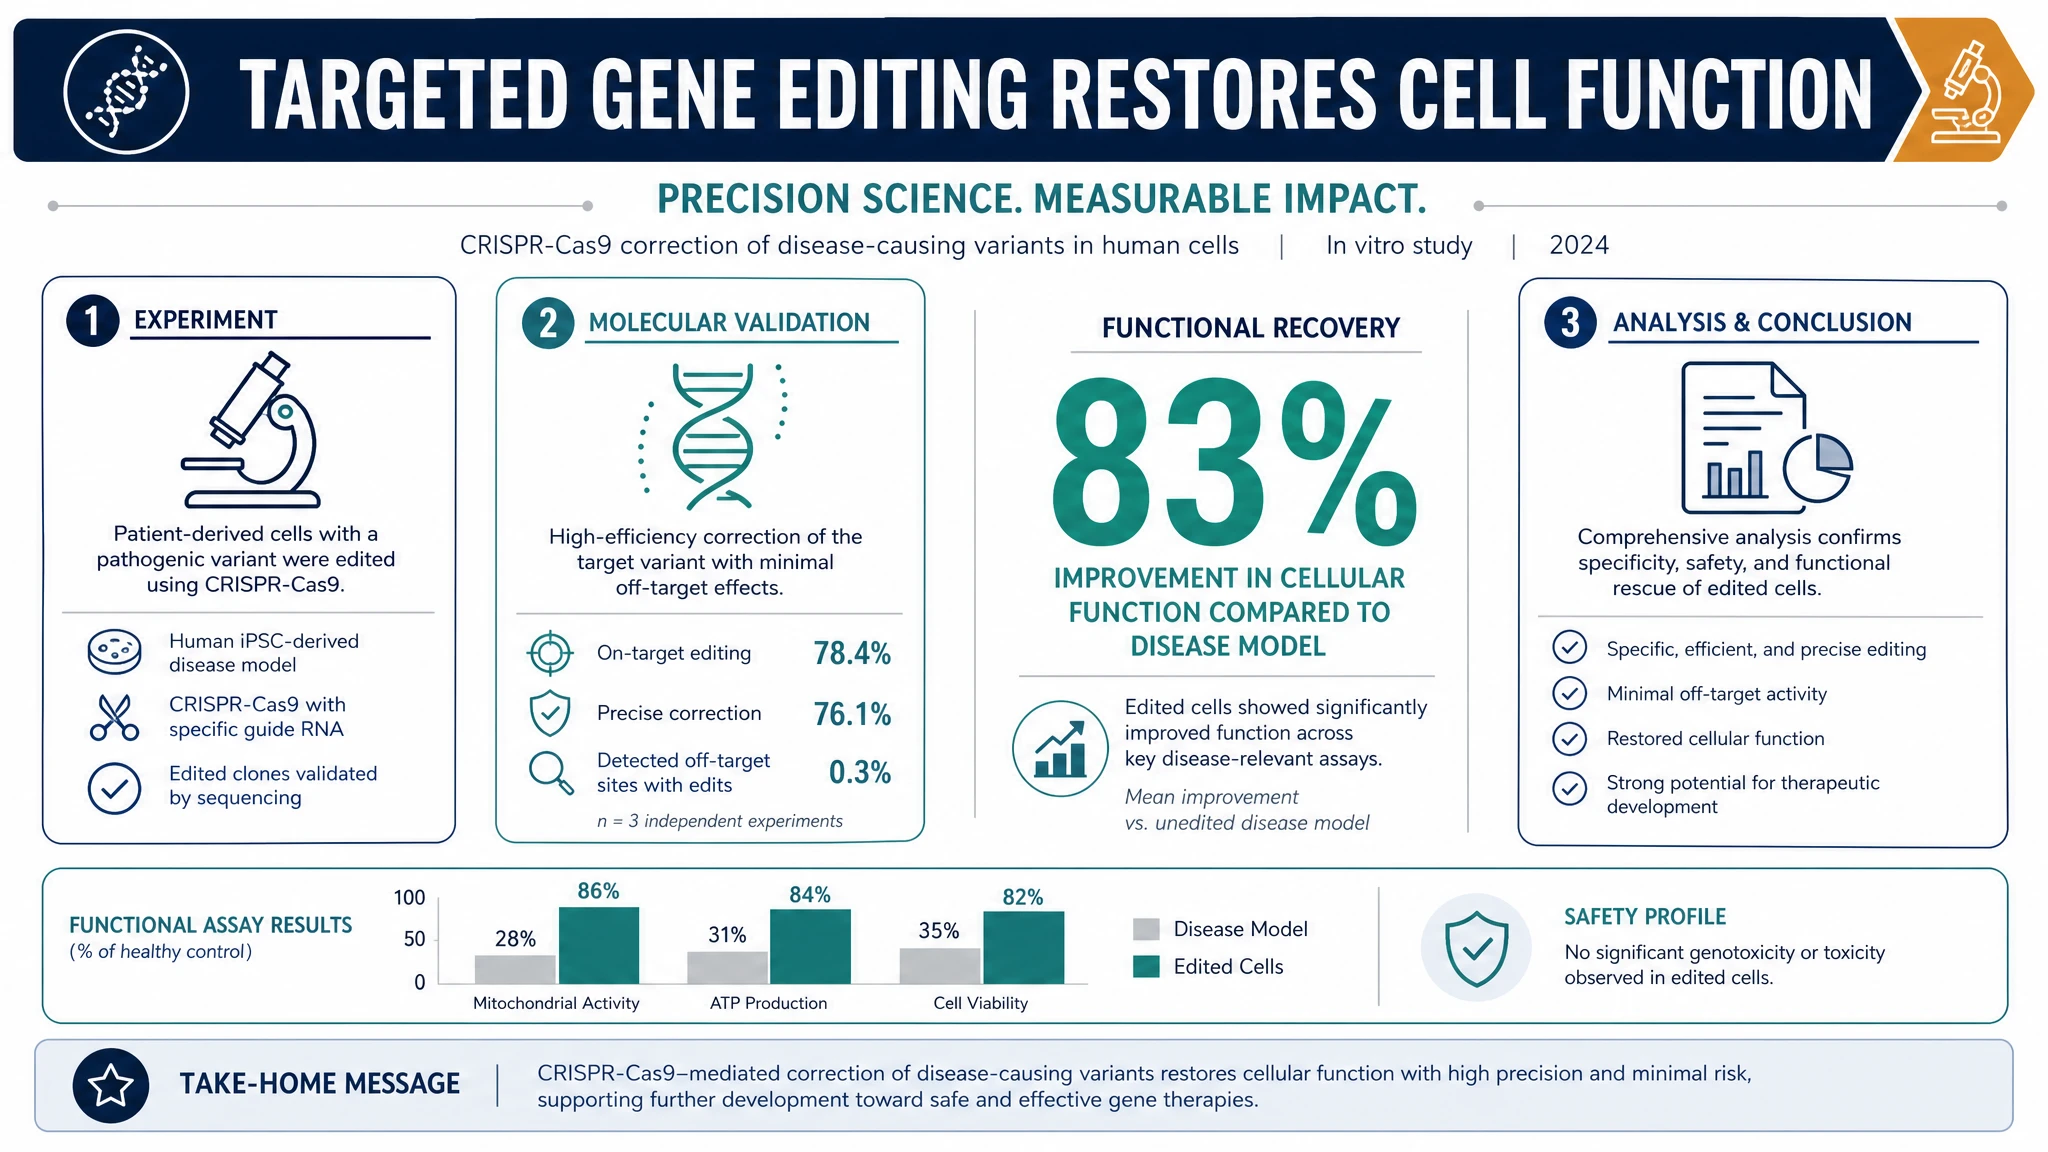
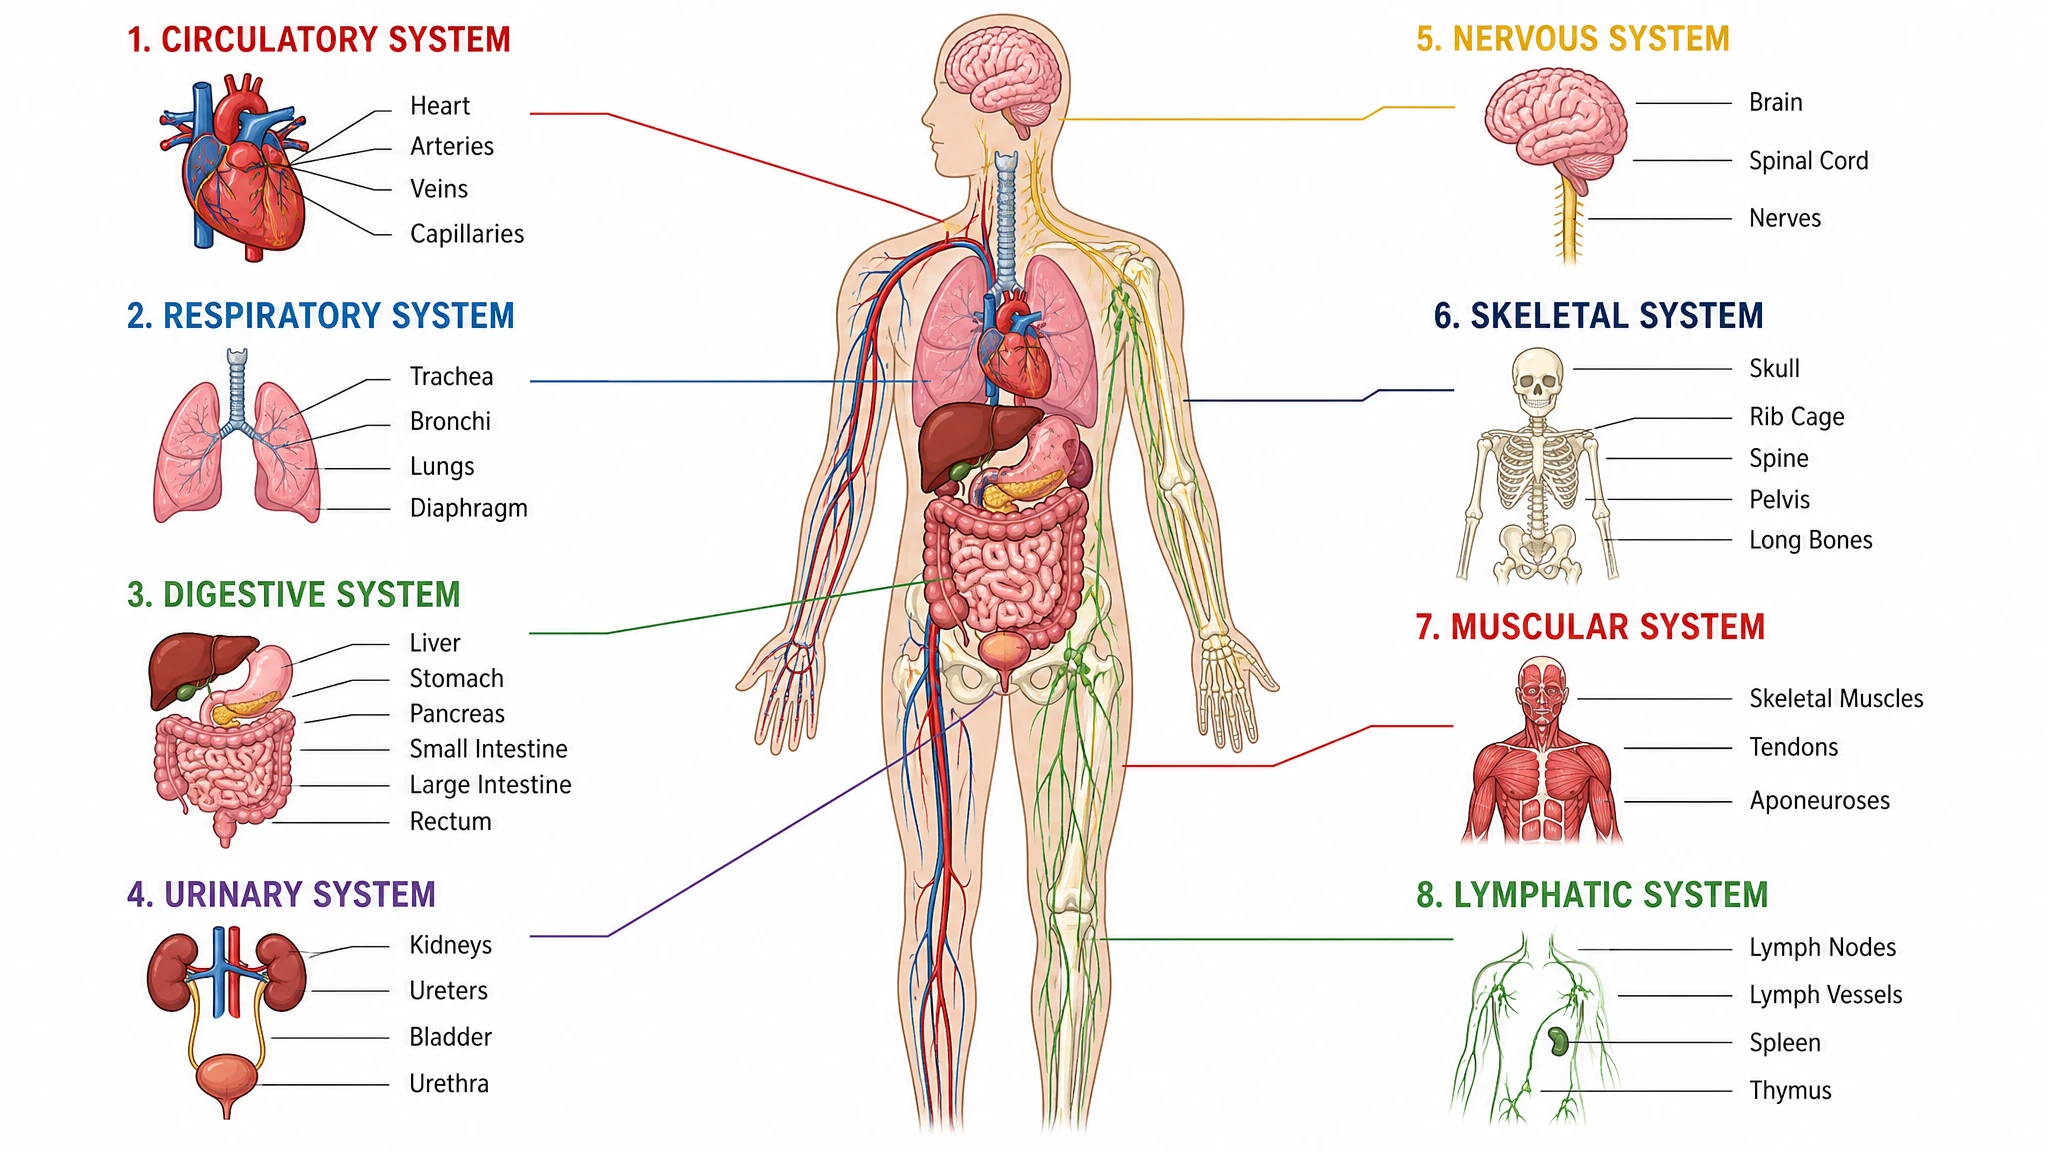
Chemistry Structure Generator example figureChemistry Structure GeneratorGraphical Abstract Maker example figureGraphical Abstract MakerFree Body Diagram Generator example figureFree Body Diagram GeneratorCircuit Diagram Maker example figureCircuit Diagram MakerAI Scientific Image Generator example figureAI Scientific Image GeneratorEditable 96-Well Plate example figureEditable 96-Well PlateLewis Dot Structure Generator example figureLewis Dot Structure GeneratorDNA Structure Diagram Generator example figureDNA Structure Diagram GeneratorWiring Diagram Maker example figureWiring Diagram MakerP&ID Diagram Generator example figureP&ID Diagram GeneratorScientific Poster Generator example figureScientific Poster GeneratorCladogram Maker example figureCladogram MakerFood Web Maker example figureFood Web MakerMedical Illustration Generator example figureMedical Illustration GeneratorPCR Diagram Generator example figurePCR Diagram GeneratorPPT Text to Visual Converter example figurePPT Text to Visual ConverterMitosis Diagram Generator example figureMitosis Diagram GeneratorDog Lymph Nodes Diagram example figureDog Lymph Nodes DiagramCSF Circulation Diagram example figureCSF Circulation DiagramEditable 24-Well Plate example figureEditable 24-Well PlateEditable 384-Well Plate example figureEditable 384-Well PlateEditable 48-Well Plate example figureEditable 48-Well PlateEditable 6-Well Plate example figureEditable 6-Well PlateAI Infographic Generator example figureAI Infographic GeneratorAnatomical Drawing Generator example figureAnatomical Drawing GeneratorAnimal and Plant Cell Comparison example figureAnimal and Plant Cell ComparisonAnimal Cell Diagram Generator example figureAnimal Cell Diagram GeneratorAntibody Structure Diagram Generator example figureAntibody Structure Diagram GeneratorApoptosis Diagram Generator example figureApoptosis Diagram GeneratorAutophagy Diagram Generator example figureAutophagy Diagram GeneratorBacteria Diagram Generator example figureBacteria Diagram GeneratorBlueprint Maker example figureBlueprint MakerBohr Model Maker example figureBohr Model MakerBrain Anatomy Diagram example figureBrain Anatomy DiagramCalvin Cycle Diagram Generator example figureCalvin Cycle Diagram GeneratorCarbon Cycle Diagram Generator example figureCarbon Cycle Diagram GeneratorCell Cycle Diagram Generator example figureCell Cycle Diagram GeneratorCell Membrane Diagram example figureCell Membrane DiagramCellular Respiration Diagram Generator example figureCellular Respiration Diagram GeneratorComplement System Diagram Generator example figureComplement System Diagram GeneratorCRISPR-Cas9 Diagram Generator example figureCRISPR-Cas9 Diagram GeneratorDNA Replication Diagram Generator example figureDNA Replication Diagram GeneratorEar Anatomy Diagram example figureEar Anatomy DiagramElectron Configuration Diagram Generator example figureElectron Configuration Diagram GeneratorElectron Transport Chain Diagram Generator example figureElectron Transport Chain Diagram GeneratorELISA Diagram Generator example figureELISA Diagram GeneratorEye Anatomy Diagram example figureEye Anatomy DiagramFoot Anatomy Diagram example figureFoot Anatomy DiagramGel Electrophoresis Diagram Generator example figureGel Electrophoresis Diagram GeneratorGene Regulation Diagram Generator example figureGene Regulation Diagram GeneratorGlycolysis Diagram Generator example figureGlycolysis Diagram GeneratorHeart Diagram example figureHeart DiagramImage to Editable SVG Converter example figureImage to Editable SVG ConverterImmune Checkpoint Diagram Generator example figureImmune Checkpoint Diagram GeneratorImmune Response Diagram Generator example figureImmune Response Diagram GeneratorInflammasome Diagram Generator example figureInflammasome Diagram GeneratorKrebs Cycle Diagram Generator example figureKrebs Cycle Diagram GeneratorLab Diagram Maker example figureLab Diagram MakerMeiosis Diagram Generator example figureMeiosis Diagram GeneratorMetabolic Pathway Diagram Generator example figureMetabolic Pathway Diagram GeneratorMicroscope Diagram example figureMicroscope DiagramMolecular Orbital Diagram Generator example figureMolecular Orbital Diagram GeneratorNitrogen Cycle Diagram Generator example figureNitrogen Cycle Diagram GeneratorPedigree Chart Maker example figurePedigree Chart MakerPhospholipid Diagram Generator example figurePhospholipid Diagram GeneratorPhosphorus Cycle Diagram Generator example figurePhosphorus Cycle Diagram GeneratorPhotosynthesis Diagram Generator example figurePhotosynthesis Diagram GeneratorPhylogenetic Tree Maker example figurePhylogenetic Tree MakerPhysics Vector Diagram Maker example figurePhysics Vector Diagram MakerPlant Cell Diagram Generator example figurePlant Cell Diagram GeneratorPlasmid Map Maker example figurePlasmid Map MakerProtein Synthesis Diagram Generator example figureProtein Synthesis Diagram GeneratorPunnett Square Maker example figurePunnett Square MakerRay Diagram Maker example figureRay Diagram MakerRNA Structure Diagram Generator example figureRNA Structure Diagram GeneratorScientific Color Palette Generator example figureScientific Color Palette GeneratorSignaling Pathway Diagram Generator example figureSignaling Pathway Diagram GeneratorSingle Line Diagram Generator example figureSingle Line Diagram GeneratorT-Cell Activation Diagram Generator example figureT-Cell Activation Diagram GeneratorWater Cycle Diagram Generator example figureWater Cycle Diagram GeneratorWestern Blot Diagram Generator example figureWestern Blot Diagram GeneratorFungal Cell Diagram example figureFungal Cell DiagramGibson Assembly Diagram example figureGibson Assembly DiagramHigh-Pressure Homogenizer Diagram example figureHigh-Pressure Homogenizer DiagramNeuron Diagram example figureNeuron DiagramSpinning Disk Confocal Optical Diagram example figureSpinning Disk Confocal Optical DiagramSwan-Neck Flask Experiment example figureSwan-Neck Flask Experiment
384 Well Plate Template Questions

1.

2.

3.

4.

5.

6.

Call to action background

Plan your 384 wells

Free 384 Well Plate Template for Your Screen

Map my 384-well plate

Free to start · No credit card required · Built for researchers