SciFig

Free IC50 Calculator and Dose Response Curve Generator

Fit concentration-response measurements with a 3PL or 4PL model. Read the relative IC50 or EC50 and export the points with the fitted curve.

Import a data file to continue.

Start with up to 150 free credits|No credit card required

Get up to 350 free credits on day one when you join through an invite.

3 figure engines · 500+ templatesEvery label editable · 60+ color schemesEditable PPTX · Layered SVG · 8K PNG / JPG

Free IC50 Calculator and Dose Response Curve Generator— templates & examples

Updated

Dose response curve tools

Free IC50 Calculator and Dose Response Curve Generator

Fit your measured responses and show the midpoint, plateaus and curve together.

An IC50 calculator fits a dose response curve to estimate the concentration halfway between its response plateaus. Enter concentration and response measurements to fit an increasing or decreasing dose response curve. Compare 3PL and 4PL fits, read the relative IC50 or EC50, and export the plotted measurements with the fitted line.

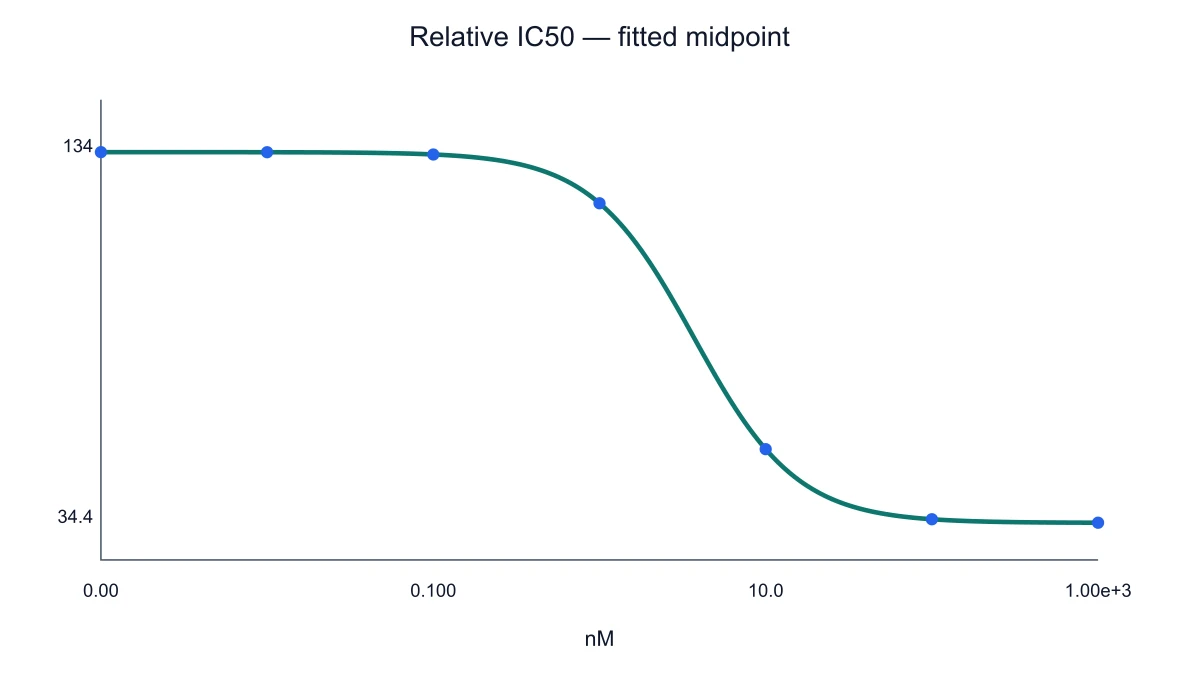
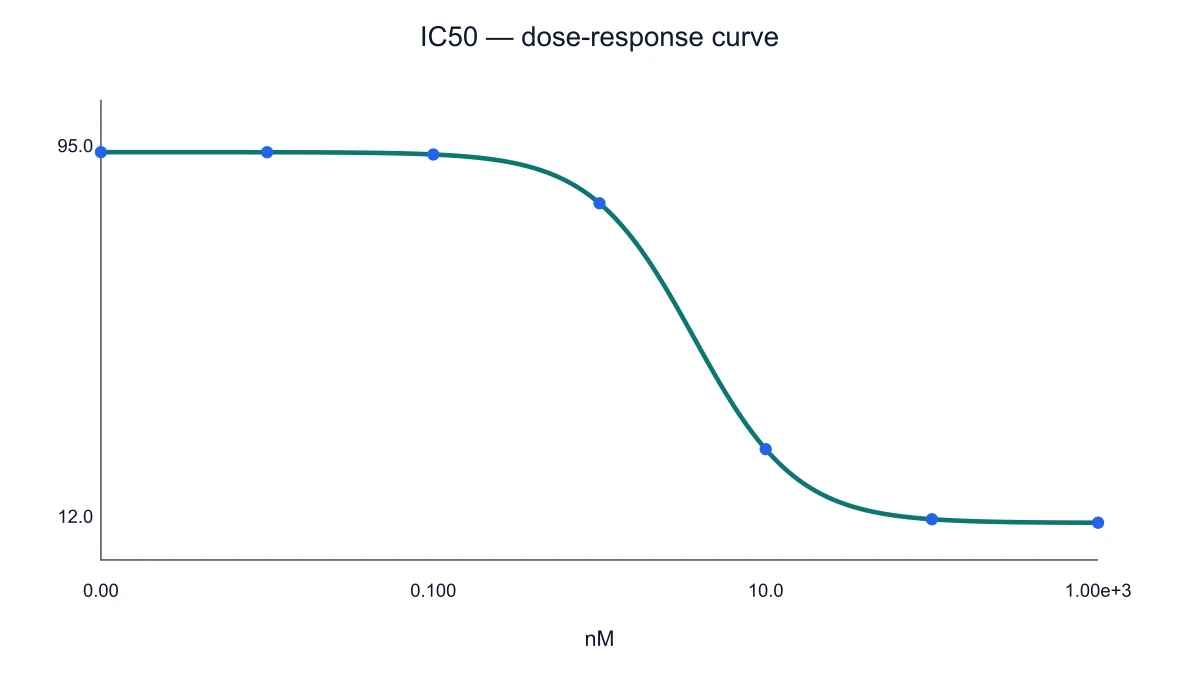
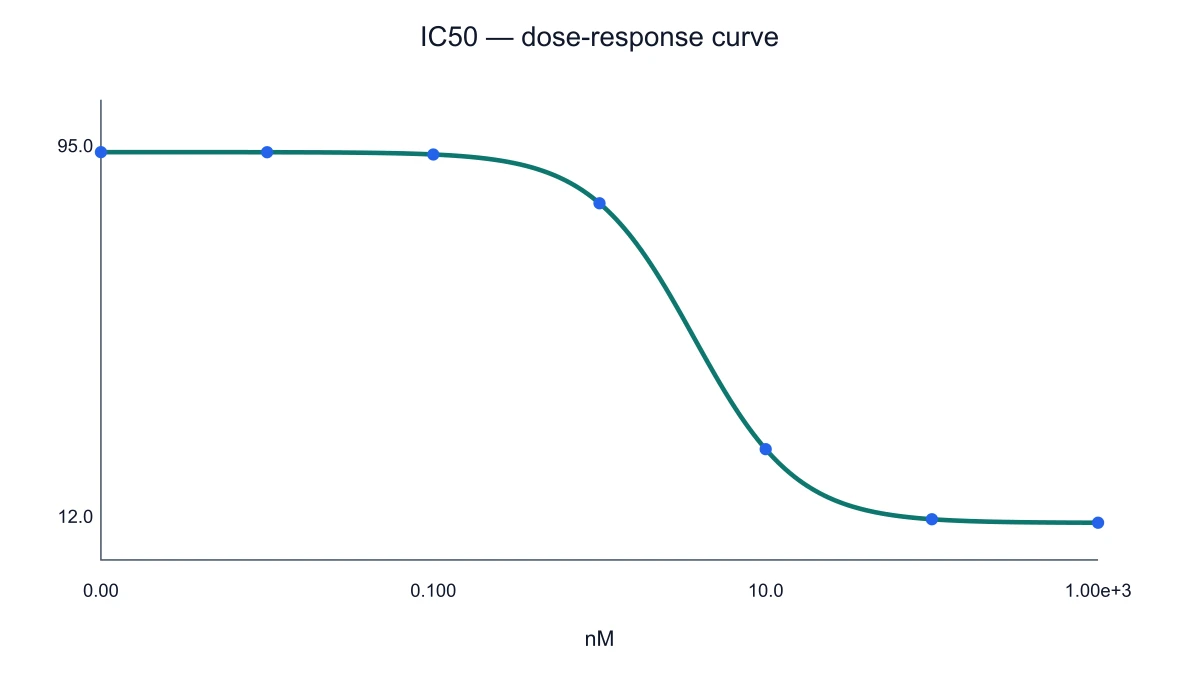
IC50 dose-response example with decreasing observations and a fitted 4PL curve on a concentration axis in nM
  • Enter at least five distinct concentrations
  • Use four fitted parameters in 4PL
  • Identify the fitted midpoint
  • Export SVG or PNG

Dose Response Curve Features

SciFig’s IC50 calculator fits measured concentration-response points and shows the curve alongside its parameters.

Fit concentration and response measurements

Paste numerical concentration and response values into SciFig’s IC50 calculator. The local fit uses your measurements to draw the points and dose response curve together. Distinct concentrations establish the x positions, while repeat measurements show observations at the same dose. Keep the concentration unit with the figure so that the midpoint has an explicit scale.

  • Enter at least five distinct concentrations
  • Include repeat measurements
  • Keep concentration units visible
Fit a dose response curve

Choose a 3PL or 4PL model

Select the model that matches the comparison you want to make. SciFig’s 4PL curve fitting estimates the lower plateau, upper plateau, midpoint and Hill slope. Its 3PL option fixes the Hill slope at one. Displaying the model beside the result makes that choice part of the figure rather than a hidden calculation.

  • Use four fitted parameters in 4PL
  • Fix Hill slope to one in 3PL
  • Compare the model with the points
Choose a fitting model

Read a relative IC50 or EC50

The reported midpoint is the concentration halfway between the fitted plateaus. A decreasing response can express inhibition as a relative IC50; an increasing response can express stimulation as an EC50. The midpoint is not necessarily the concentration at a raw response value of fifty, so the fitted bounds remain useful context.

  • Identify the fitted midpoint
  • Retain increasing or decreasing direction
  • Show the response plateaus
Calculate the relative midpoint

Export the points and fitted line

Download a dose response figure as SVG or PNG with the concentration axis, response values and fitted curve together. Use the plot in an assay discussion or presentation while keeping the input data available for another fit. A log concentration view emphasizes relative dose spacing; a linear view also accommodates zero-concentration observations.

  • Export SVG or PNG
  • Set the concentration unit
  • Choose an appropriate axis view
Export the fitted curve

How to Create the Figure

Use the IC50 calculator to enter measurements, choose the fitting model and export the curve.

  1. Enter concentration-response pairs

    Paste your measurements with numerical concentrations and responses. Include at least five distinct nonnegative concentration values and keep repeated measurements as separate observations. Set a concentration unit that matches your experiment so that the fitted midpoint is expressed on the same scale.

  2. Choose the fitting model

    Select 3PL or 4PL. The fit estimates whether the measured response increases or decreases. SciFig’s 3PL fixes Hill slope to one; 4PL estimates the slope. These choices define the curve fitted to the observations rather than changing the measured response values.

  3. Fit and read the parameters

    Run the fit to see the curve, data points and estimated parameters. Read the midpoint together with the fitted lower and upper plateaus. Constant responses, insufficient concentrations and nonconvergent fits produce a visible error instead of a fabricated midpoint.

  4. Set units and export the figure

    Set the concentration unit and axis view, then download SVG or PNG. Keep the data table with the figure to support later comparisons. The relative IC50 or EC50 uses the concentration unit entered with the observations.

Dose Response Curve Uses

Use the dose response curve generator to present concentration-response measurements in assay discussions and teaching material.

IC50 dose-response example with decreasing observations and a fitted 4PL curve on a concentration axis in nM

Summarize an inhibition experiment

An assay discussion often needs both the measured responses and the fitted inhibition curve. Enter the concentration series, fit a decreasing model and export a figure with its relative IC50. Keeping the plateaus visible explains which response range defines the halfway point.

Explore this example
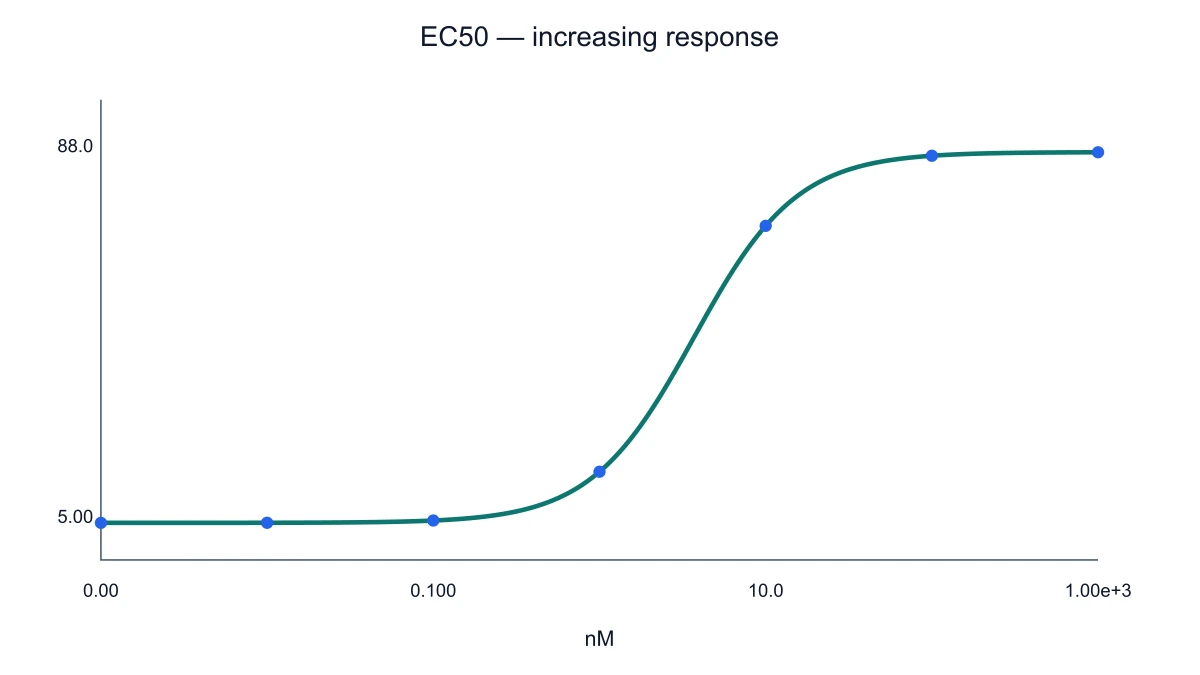
EC50 example with increasing response observations and a fitted 4PL curve

Show an increasing response

Use an increasing curve when the measured response rises with concentration. The fitted EC50 marks the midpoint between the model’s plateaus. Place the exported figure alongside the experiment description so the response direction and concentration unit are explicit to the reader.

Explore this example
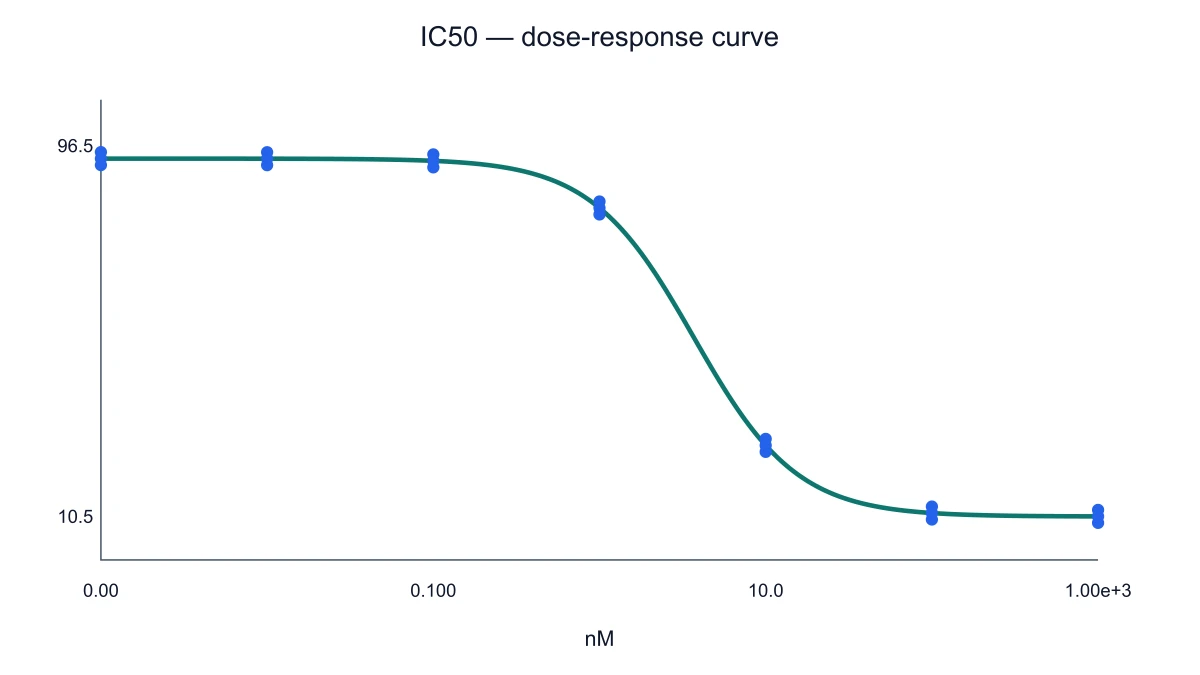
IC50 curve fitted to replicate observations at each concentration

Discuss repeated measurements

Repeat observations at a concentration provide context for the fitted line. Keep those measurements in the input rather than replacing the whole series with an illustrative curve. The plotted points let a laboratory meeting discuss the observed pattern alongside the model result.

Explore this example
Relative IC50 dose-response example with two nonzero fitted plateaus

Explain relative and absolute midpoint

Teaching material can use a curve whose lower plateau is above zero. Show that a relative IC50 is halfway between the fitted bounds, rather than automatically at a response of fifty. The labeled plot connects the definition to a concrete curve shape.

Explore this example
Decreasing IC50 dose-response observations with a fitted 4PL curve

Compare model assumptions

A methods presentation can compare 4PL curve fitting with SciFig’s 3PL model, which fixes the Hill slope at one. Use the same measurements for both fits and retain the model label with each export. The figures communicate what changed in the calculation.

Explore this example
IC50 dose-response example with decreasing observations and a fitted 4PL curve on a concentration axis in nM

Prepare a pharmacology figure

Export a concentration-response plot for an experiment summary or presentation. Retain axis labels and units with the data points so the curve can be read independently. For a wider figure set built from your measurements, continue with SciFig DataChart (charts and graphs from your data).

Explore this example
How Researchers Use SciFig

I brought a concentration series and repeated response measurements to our assay meeting. The IC50 calculator put the observations beside the fitted curve and its plateaus. Reading the relative midpoint with those bounds made it easier to explain exactly which response range our comparison referred to in the exported figure.

Marta V.

Pharmacology doctoral researcher, University of Barcelona

Free tools

A tool for every scientific figure

120 focused generators for the scientific figure you need — each opens in the right workspace with a matching example.

Illustrations, structures and concept diagrams

60 tools
Chemistry Structure Generator example figureChemistry Structure GeneratorGraphical Abstract Maker example figureGraphical Abstract MakerFree Body Diagram Generator example figureFree Body Diagram GeneratorCircuit Diagram Maker example figureCircuit Diagram MakerAI Scientific Image Generator example figureAI Scientific Image GeneratorEditable 96-Well Plate example figureEditable 96-Well PlateLewis Dot Structure Generator example figureLewis Dot Structure GeneratorDNA Structure Diagram Generator example figureDNA Structure Diagram GeneratorWiring Diagram Maker example figureWiring Diagram MakerP&ID Diagram Generator example figureP&ID Diagram GeneratorScientific Poster Generator example figureScientific Poster GeneratorCladogram Maker example figureCladogram MakerFood Web Maker example figureFood Web MakerMedical Illustration Generator example figureMedical Illustration GeneratorPCR Diagram Generator example figurePCR Diagram GeneratorPPT Text to Visual Converter example figurePPT Text to Visual ConverterMitosis Diagram Generator example figureMitosis Diagram GeneratorAI Infographic Generator example figureAI Infographic GeneratorAnatomical Drawing Generator example figureAnatomical Drawing GeneratorAnimal and Plant Cell Comparison example figureAnimal and Plant Cell ComparisonAnimal Cell Diagram Generator example figureAnimal Cell Diagram GeneratorAntibody Structure Diagram Generator example figureAntibody Structure Diagram GeneratorApoptosis Diagram Generator example figureApoptosis Diagram GeneratorBacteria Diagram Generator example figureBacteria Diagram GeneratorBlueprint Maker example figureBlueprint MakerBohr Model Maker example figureBohr Model MakerCalvin Cycle Diagram Generator example figureCalvin Cycle Diagram GeneratorCarbon Cycle Diagram Generator example figureCarbon Cycle Diagram GeneratorCell Cycle Diagram Generator example figureCell Cycle Diagram GeneratorCellular Respiration Diagram Generator example figureCellular Respiration Diagram GeneratorComplement System Diagram Generator example figureComplement System Diagram GeneratorCRISPR-Cas9 Diagram Generator example figureCRISPR-Cas9 Diagram GeneratorDNA Replication Diagram Generator example figureDNA Replication Diagram GeneratorElectron Configuration Diagram Generator example figureElectron Configuration Diagram GeneratorElectron Transport Chain Diagram Generator example figureElectron Transport Chain Diagram GeneratorGene Regulation Diagram Generator example figureGene Regulation Diagram GeneratorGlycolysis Diagram Generator example figureGlycolysis Diagram GeneratorImage to Editable SVG Converter example figureImage to Editable SVG ConverterImmune Response Diagram Generator example figureImmune Response Diagram GeneratorKrebs Cycle Diagram Generator example figureKrebs Cycle Diagram GeneratorLab Diagram Maker example figureLab Diagram MakerMeiosis Diagram Generator example figureMeiosis Diagram GeneratorMolecular Orbital Diagram Generator example figureMolecular Orbital Diagram GeneratorNitrogen Cycle Diagram Generator example figureNitrogen Cycle Diagram GeneratorPedigree Chart Maker example figurePedigree Chart MakerPhospholipid Diagram Generator example figurePhospholipid Diagram GeneratorPhosphorus Cycle Diagram Generator example figurePhosphorus Cycle Diagram GeneratorPhotosynthesis Diagram Generator example figurePhotosynthesis Diagram GeneratorPhylogenetic Tree Maker example figurePhylogenetic Tree MakerPhysics Vector Diagram Maker example figurePhysics Vector Diagram MakerPlant Cell Diagram Generator example figurePlant Cell Diagram GeneratorProtein Synthesis Diagram Generator example figureProtein Synthesis Diagram GeneratorPunnett Square Maker example figurePunnett Square MakerRay Diagram Maker example figureRay Diagram MakerScientific Color Palette Generator example figureScientific Color Palette GeneratorSignaling Pathway Diagram Generator example figureSignaling Pathway Diagram GeneratorSingle Line Diagram Generator example figureSingle Line Diagram GeneratorT-Cell Activation Diagram Generator example figureT-Cell Activation Diagram GeneratorWater Cycle Diagram Generator example figureWater Cycle Diagram GeneratorWestern Blot Diagram Generator example figureWestern Blot Diagram Generator
Dose Response Curve Questions

1.

2.

3.

4.

5.

6.

Call to action background

Dose response curve

Create a dose response curve

Create a dose response curve

Free to start · No credit card required · Built for researchers