Summarize repeated laboratory measurements
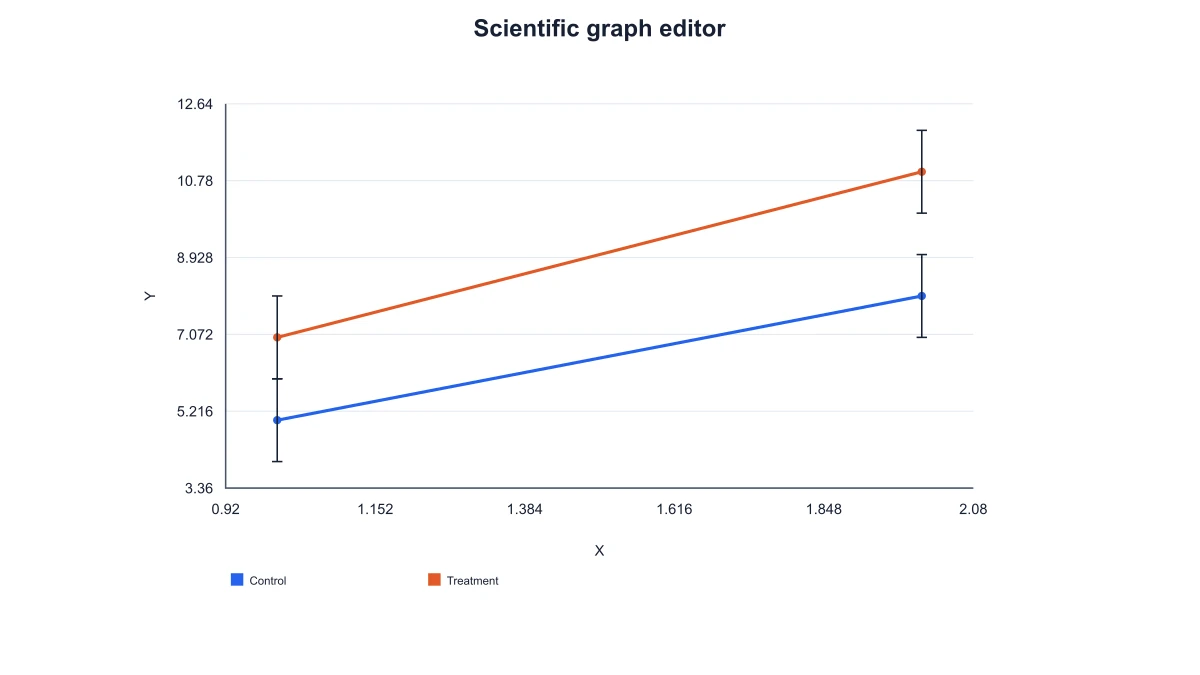
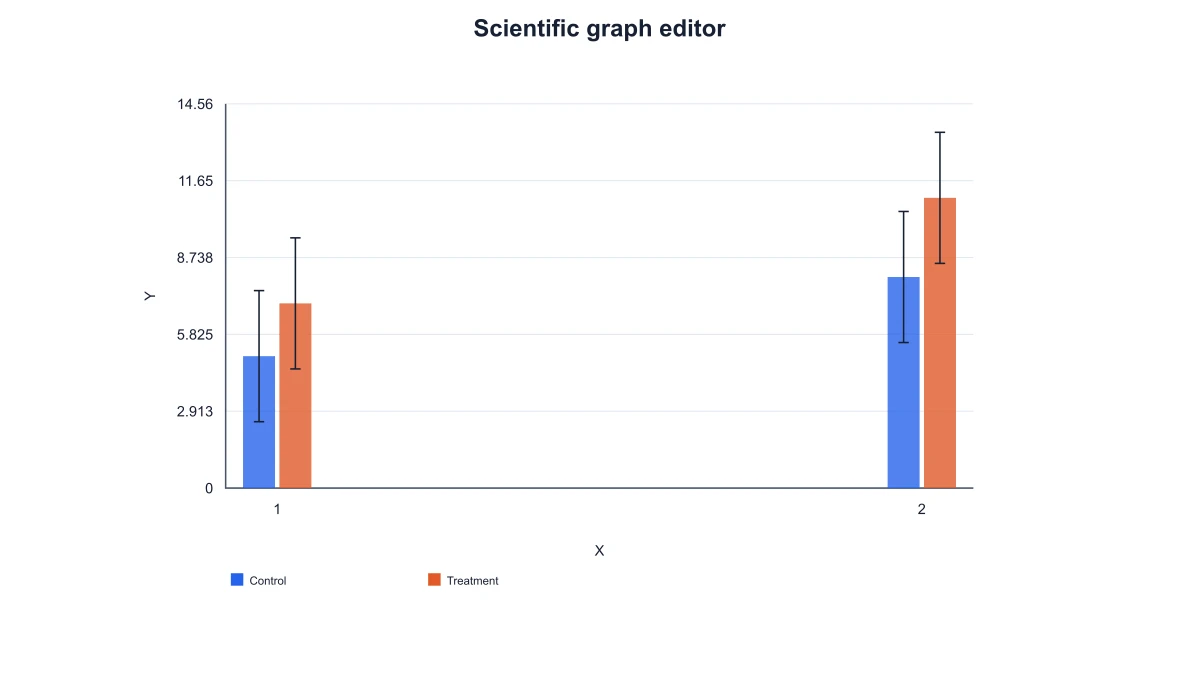
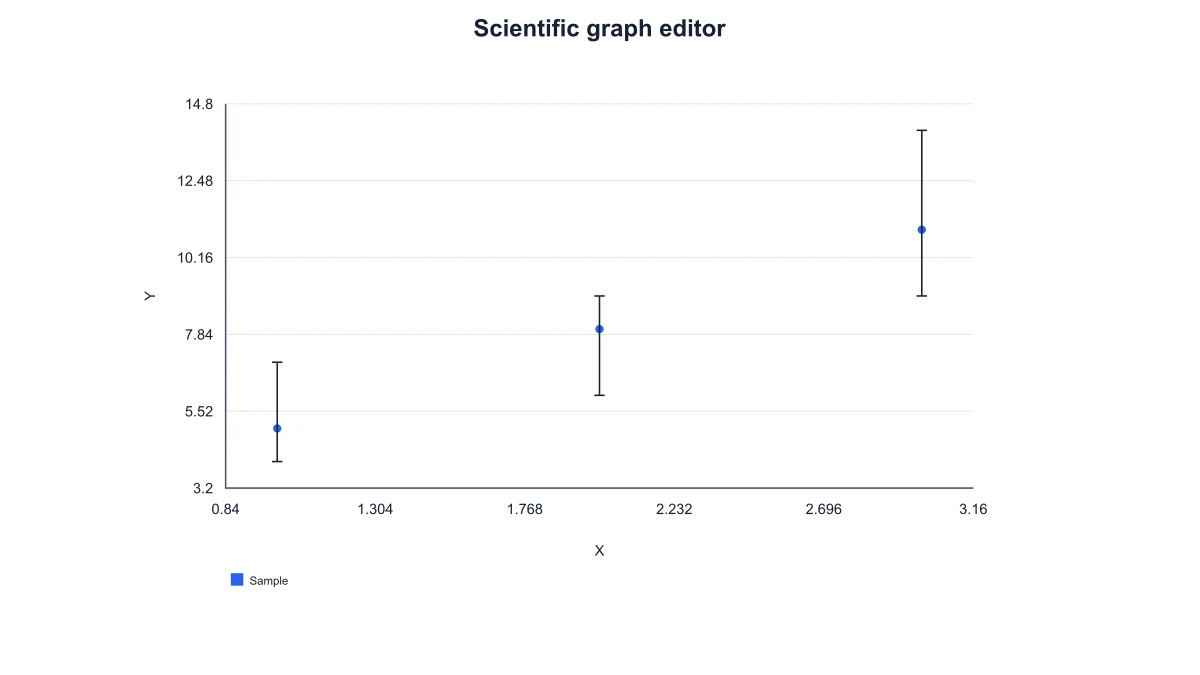
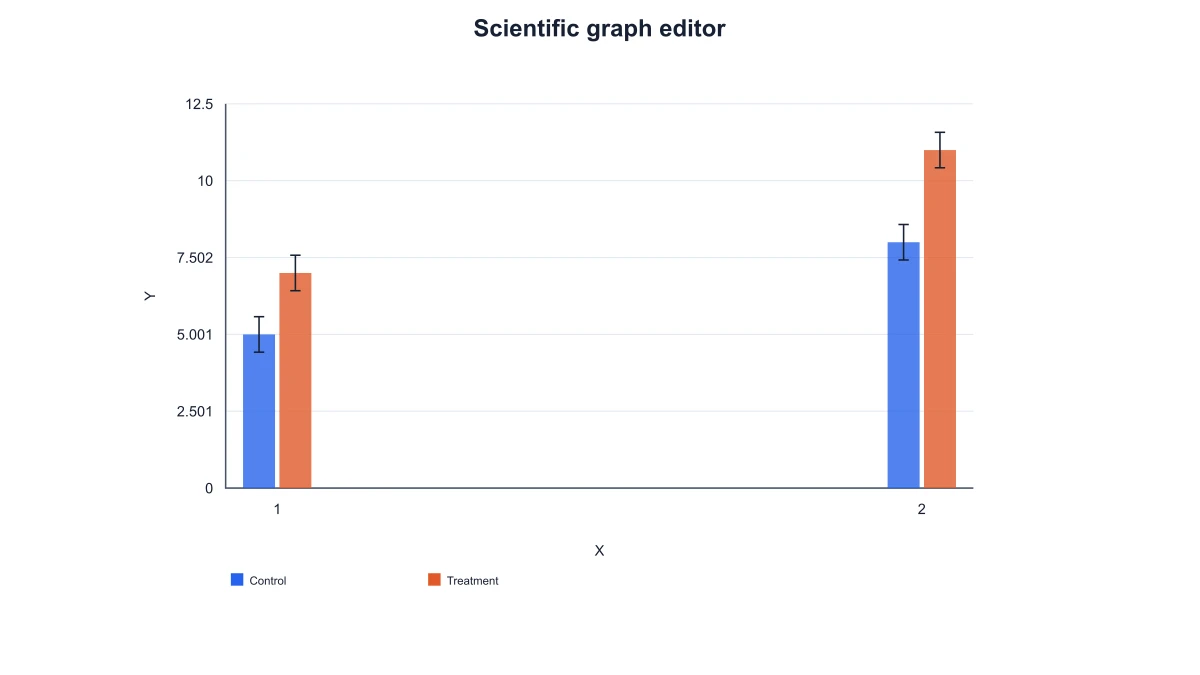
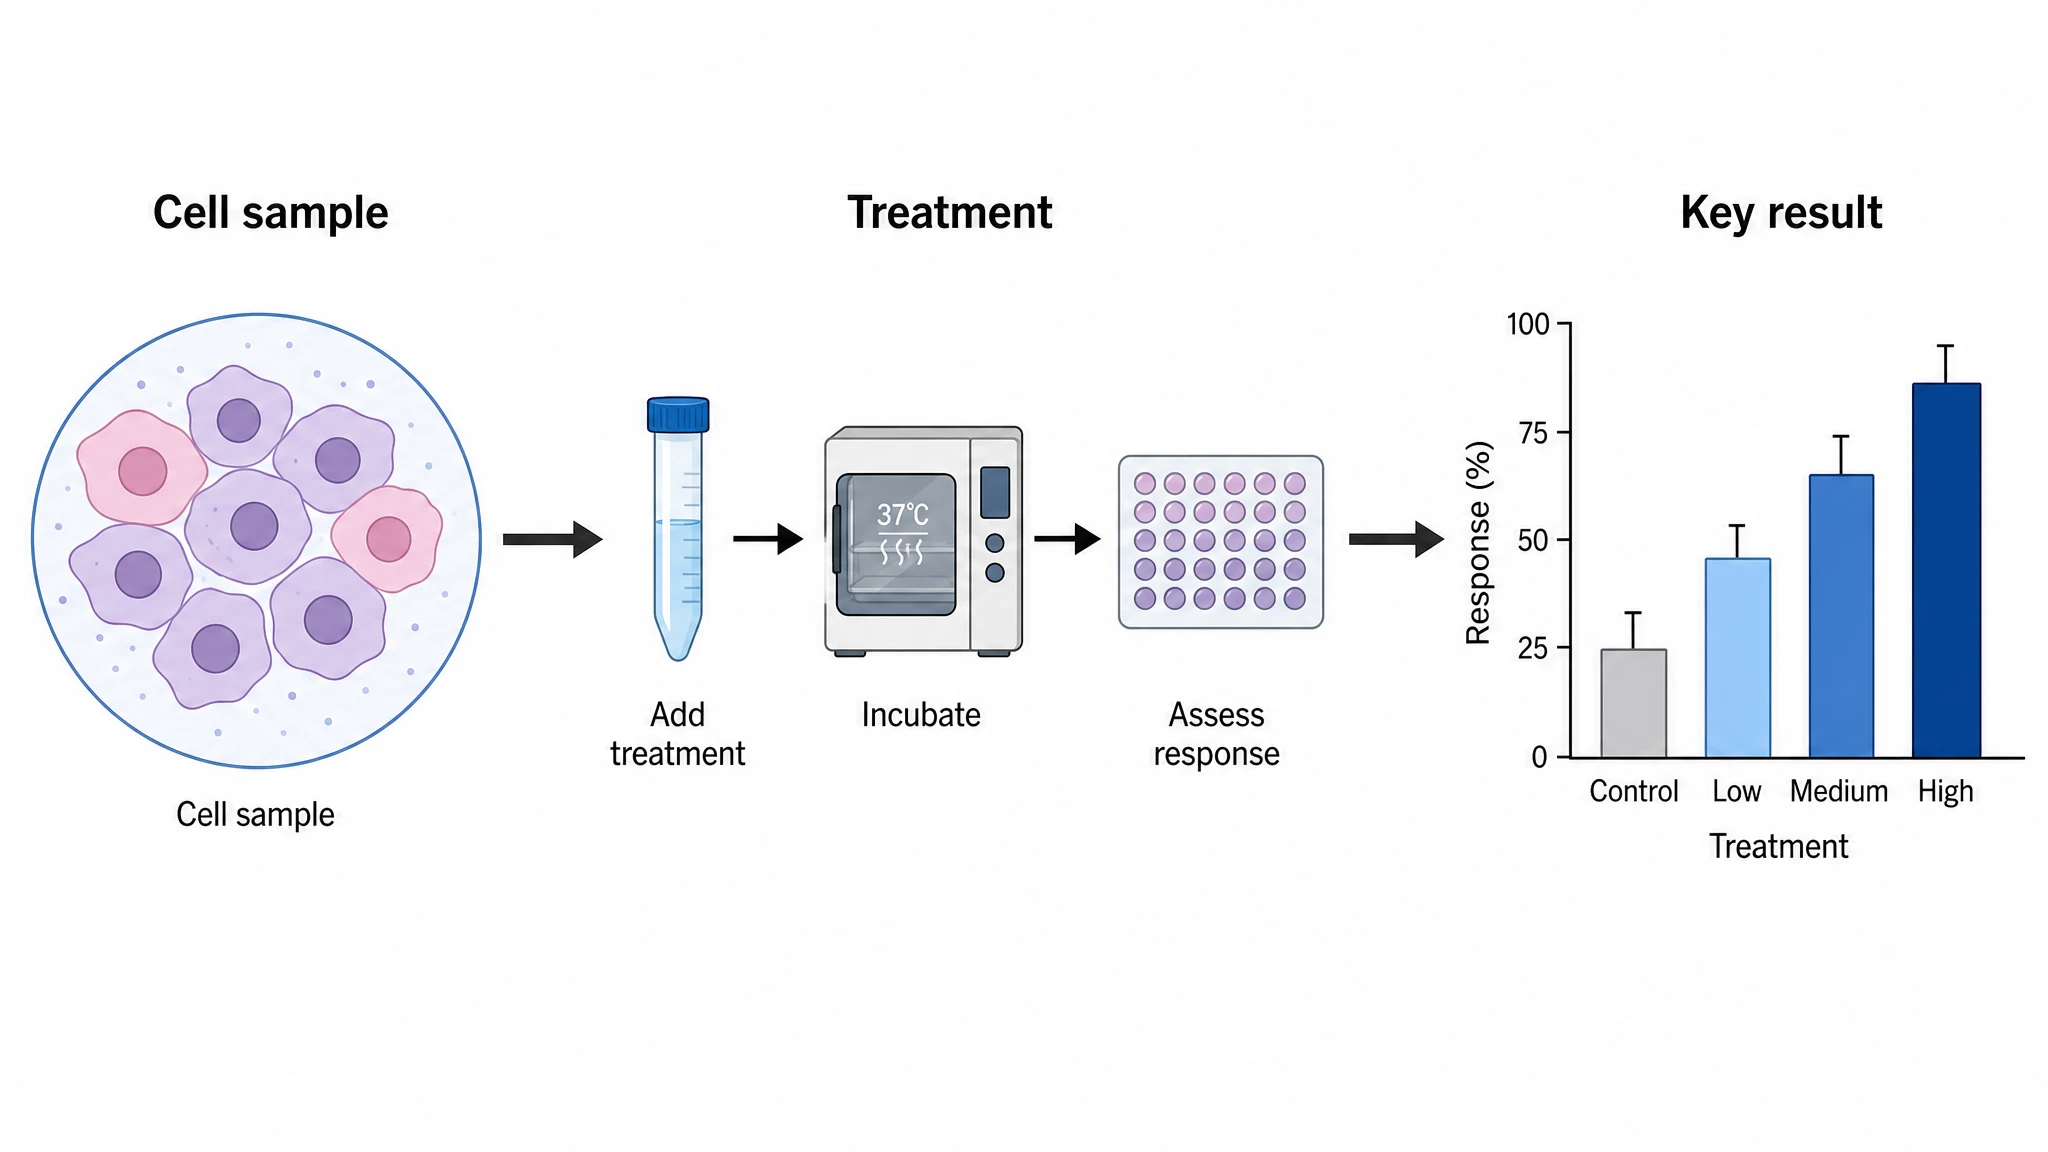
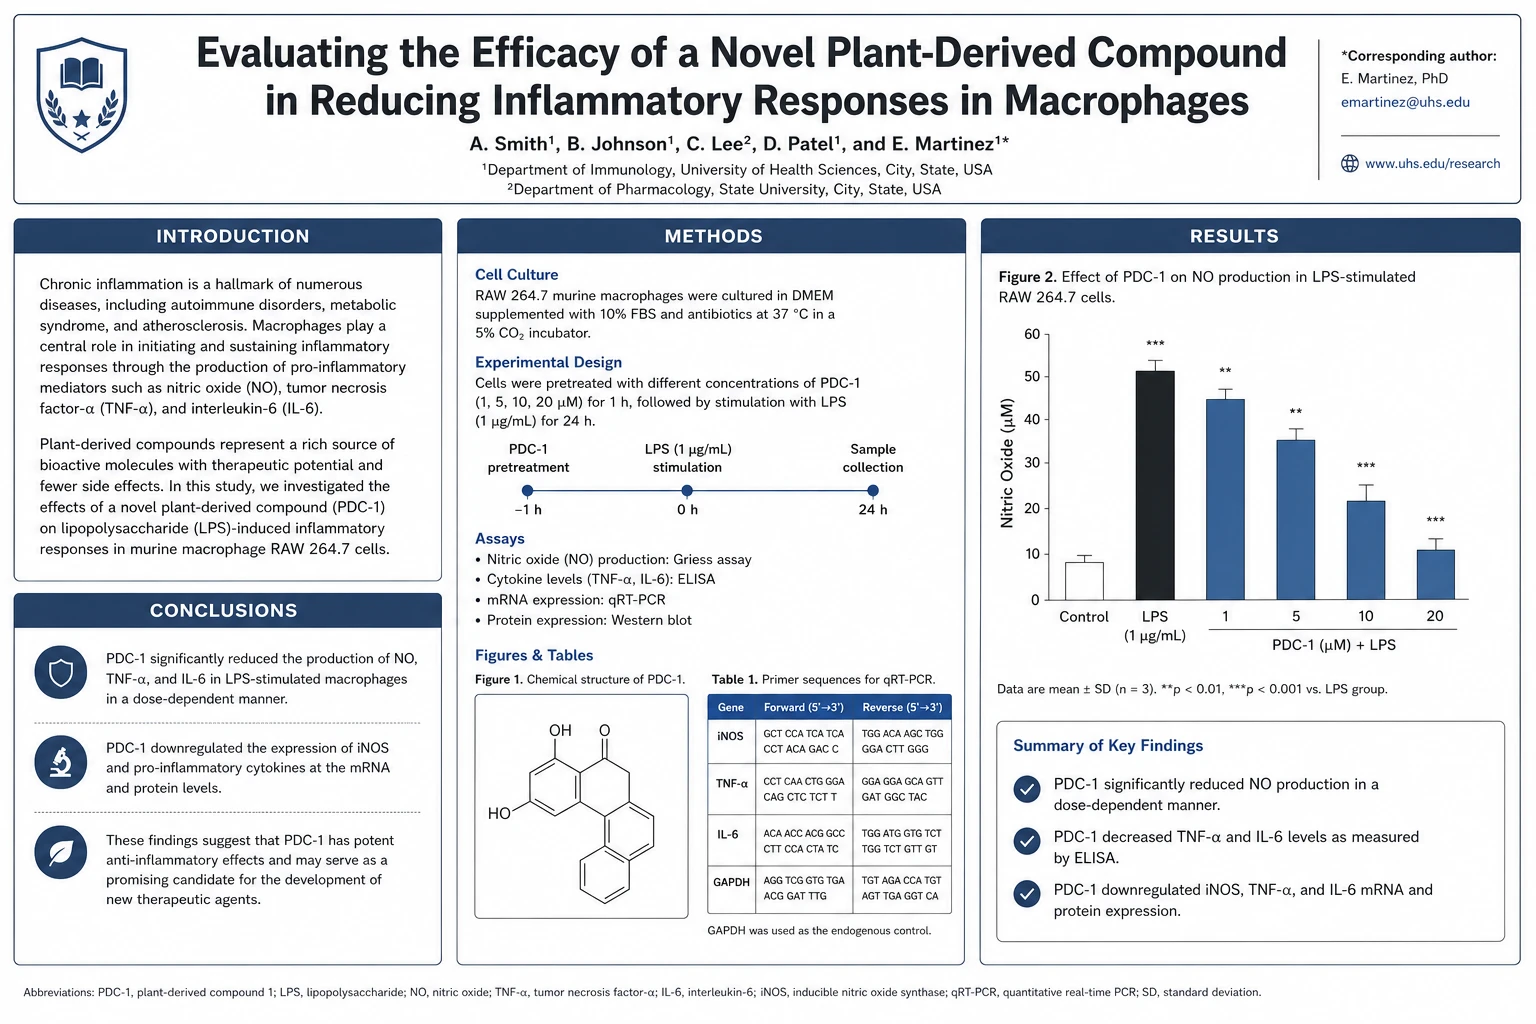
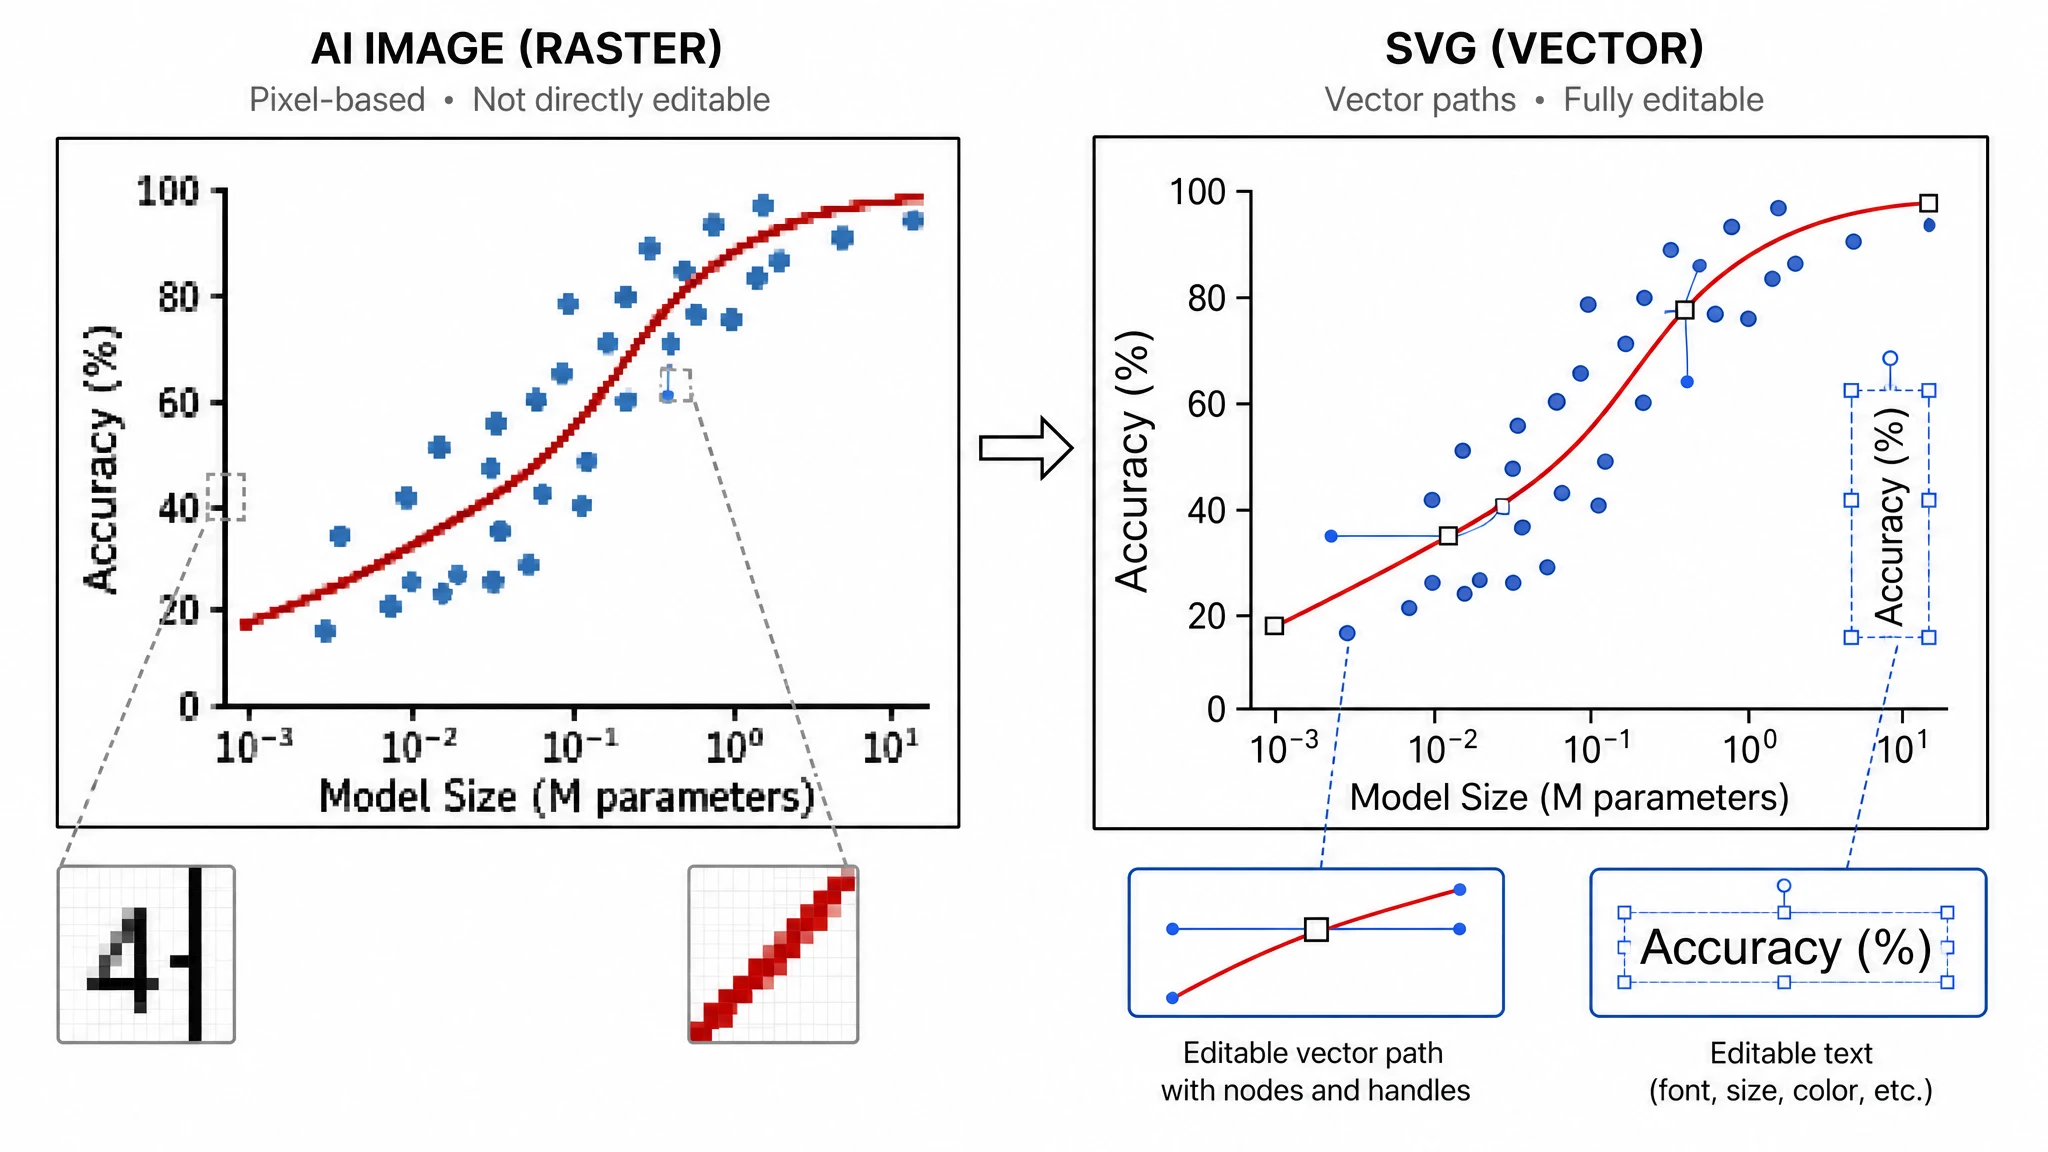
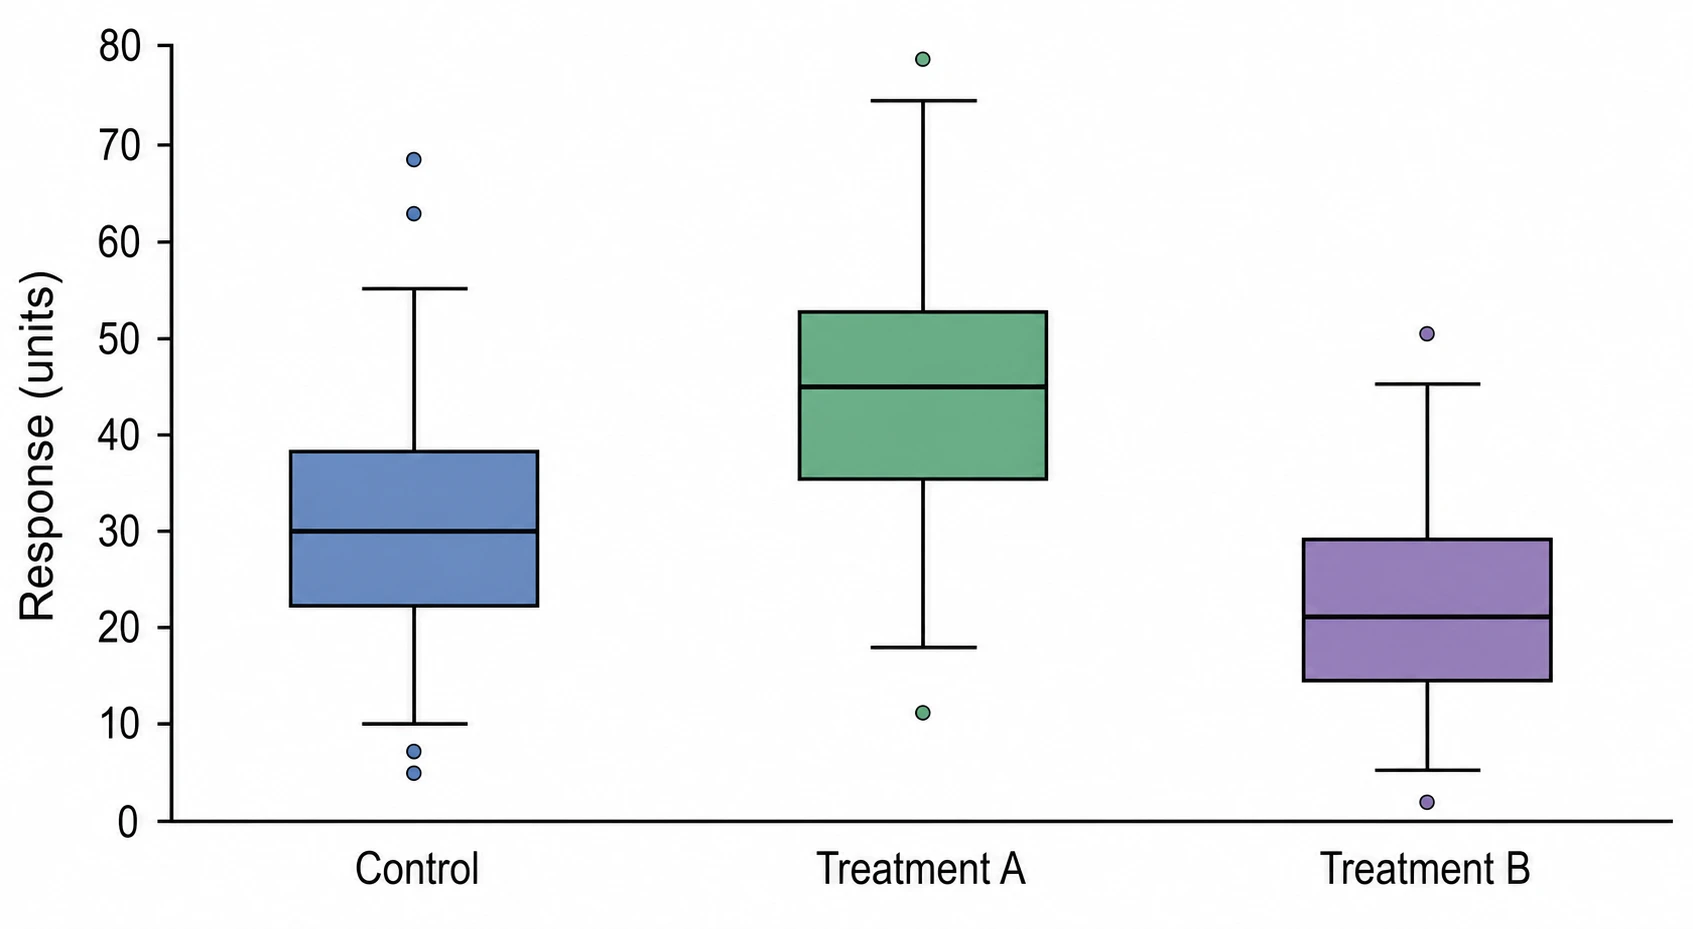
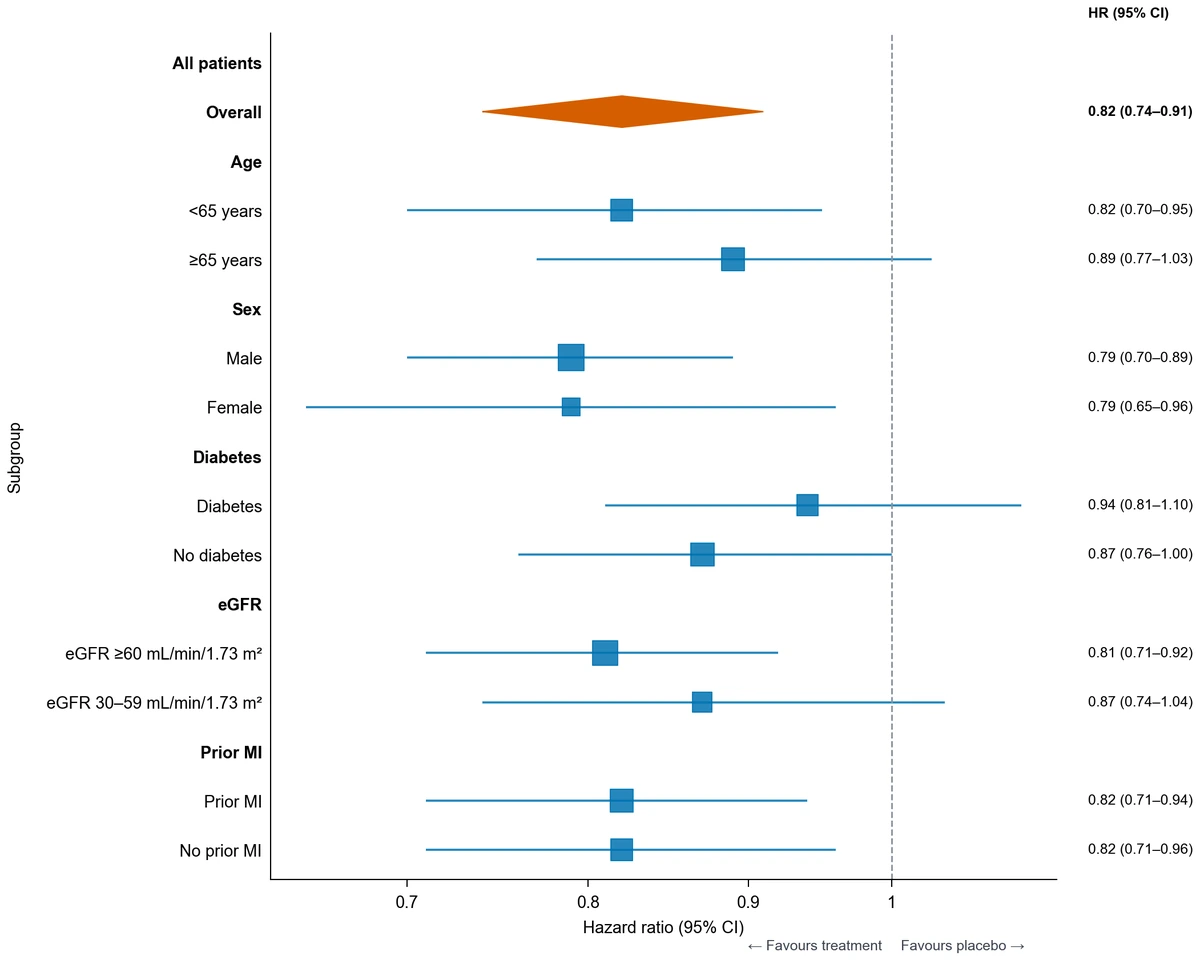
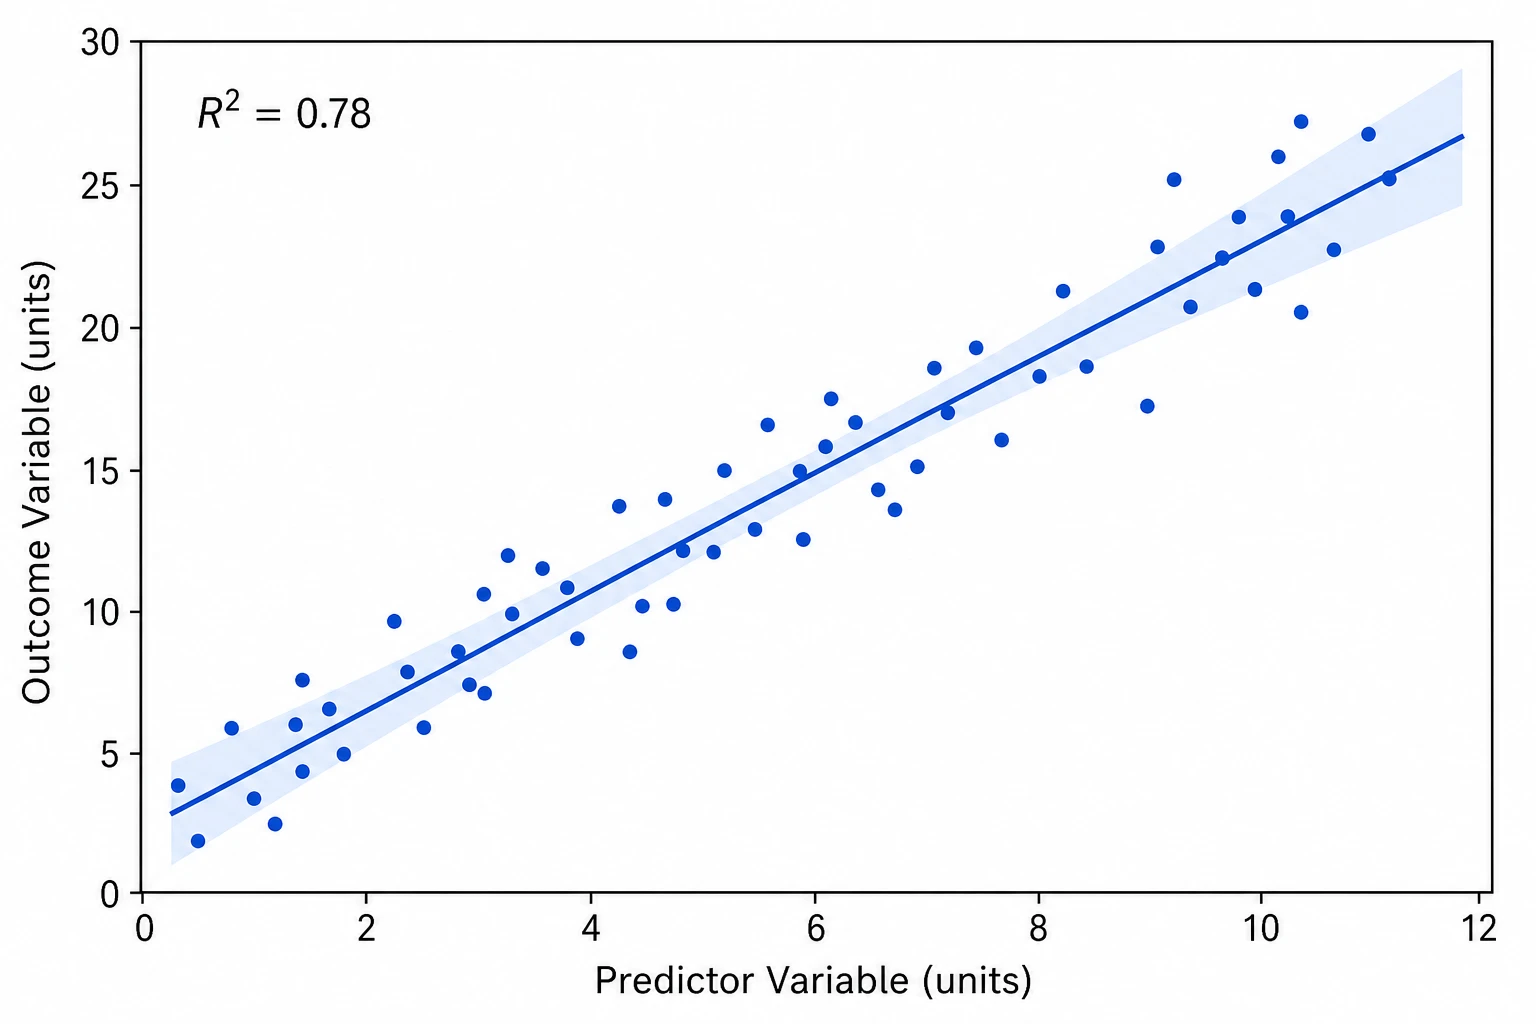
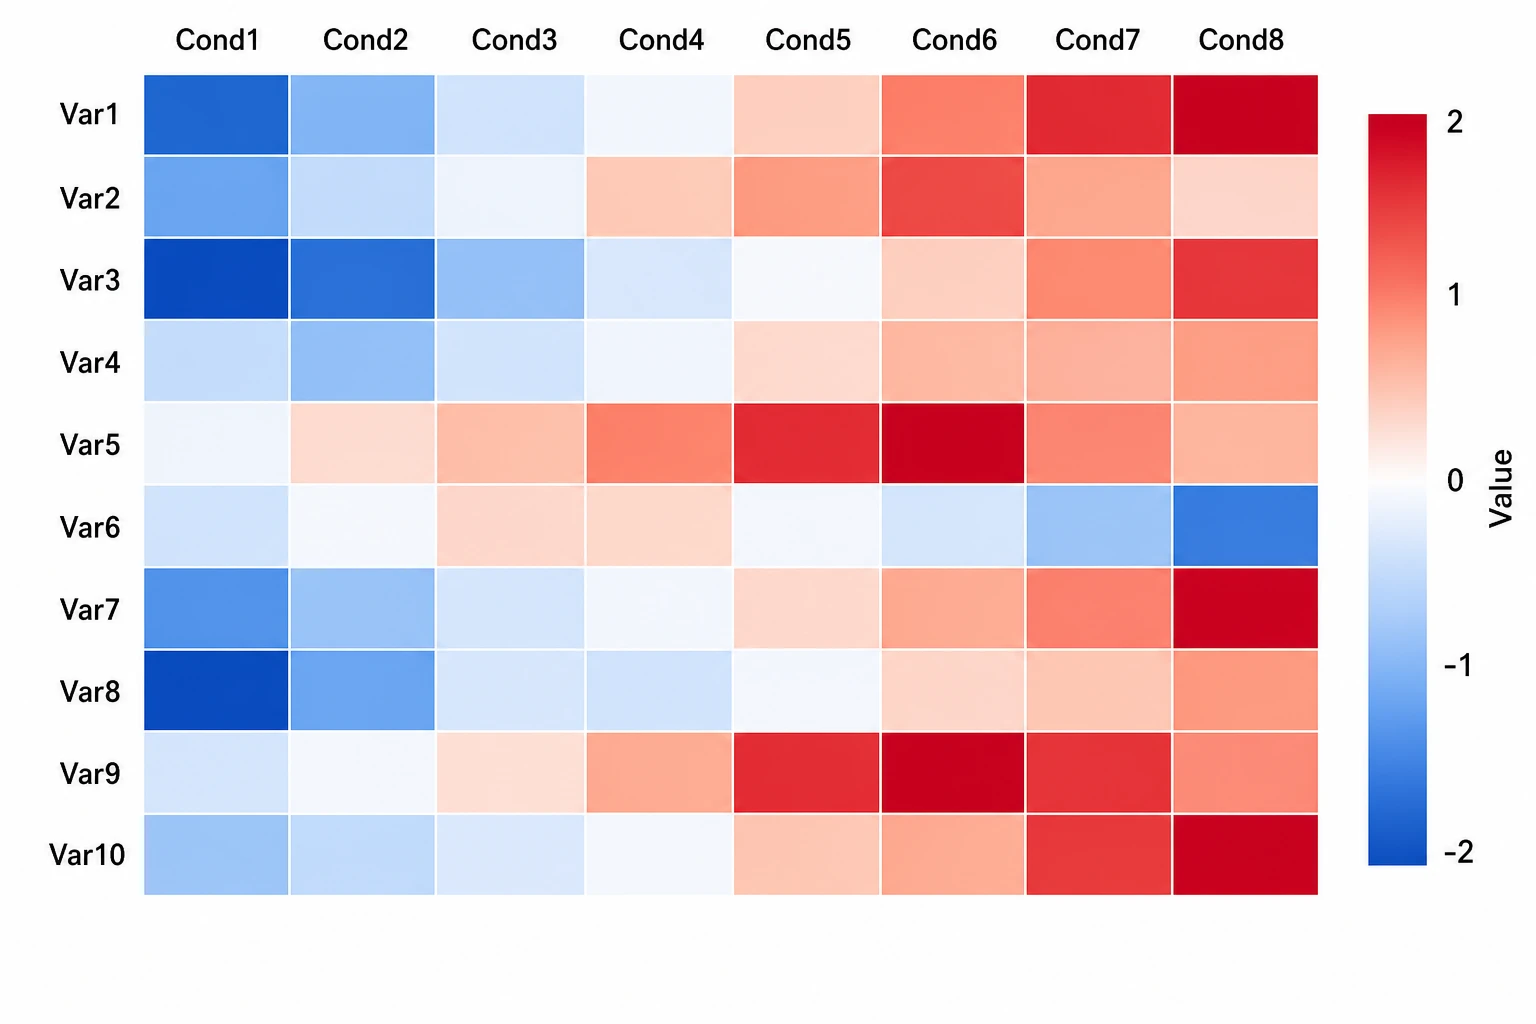
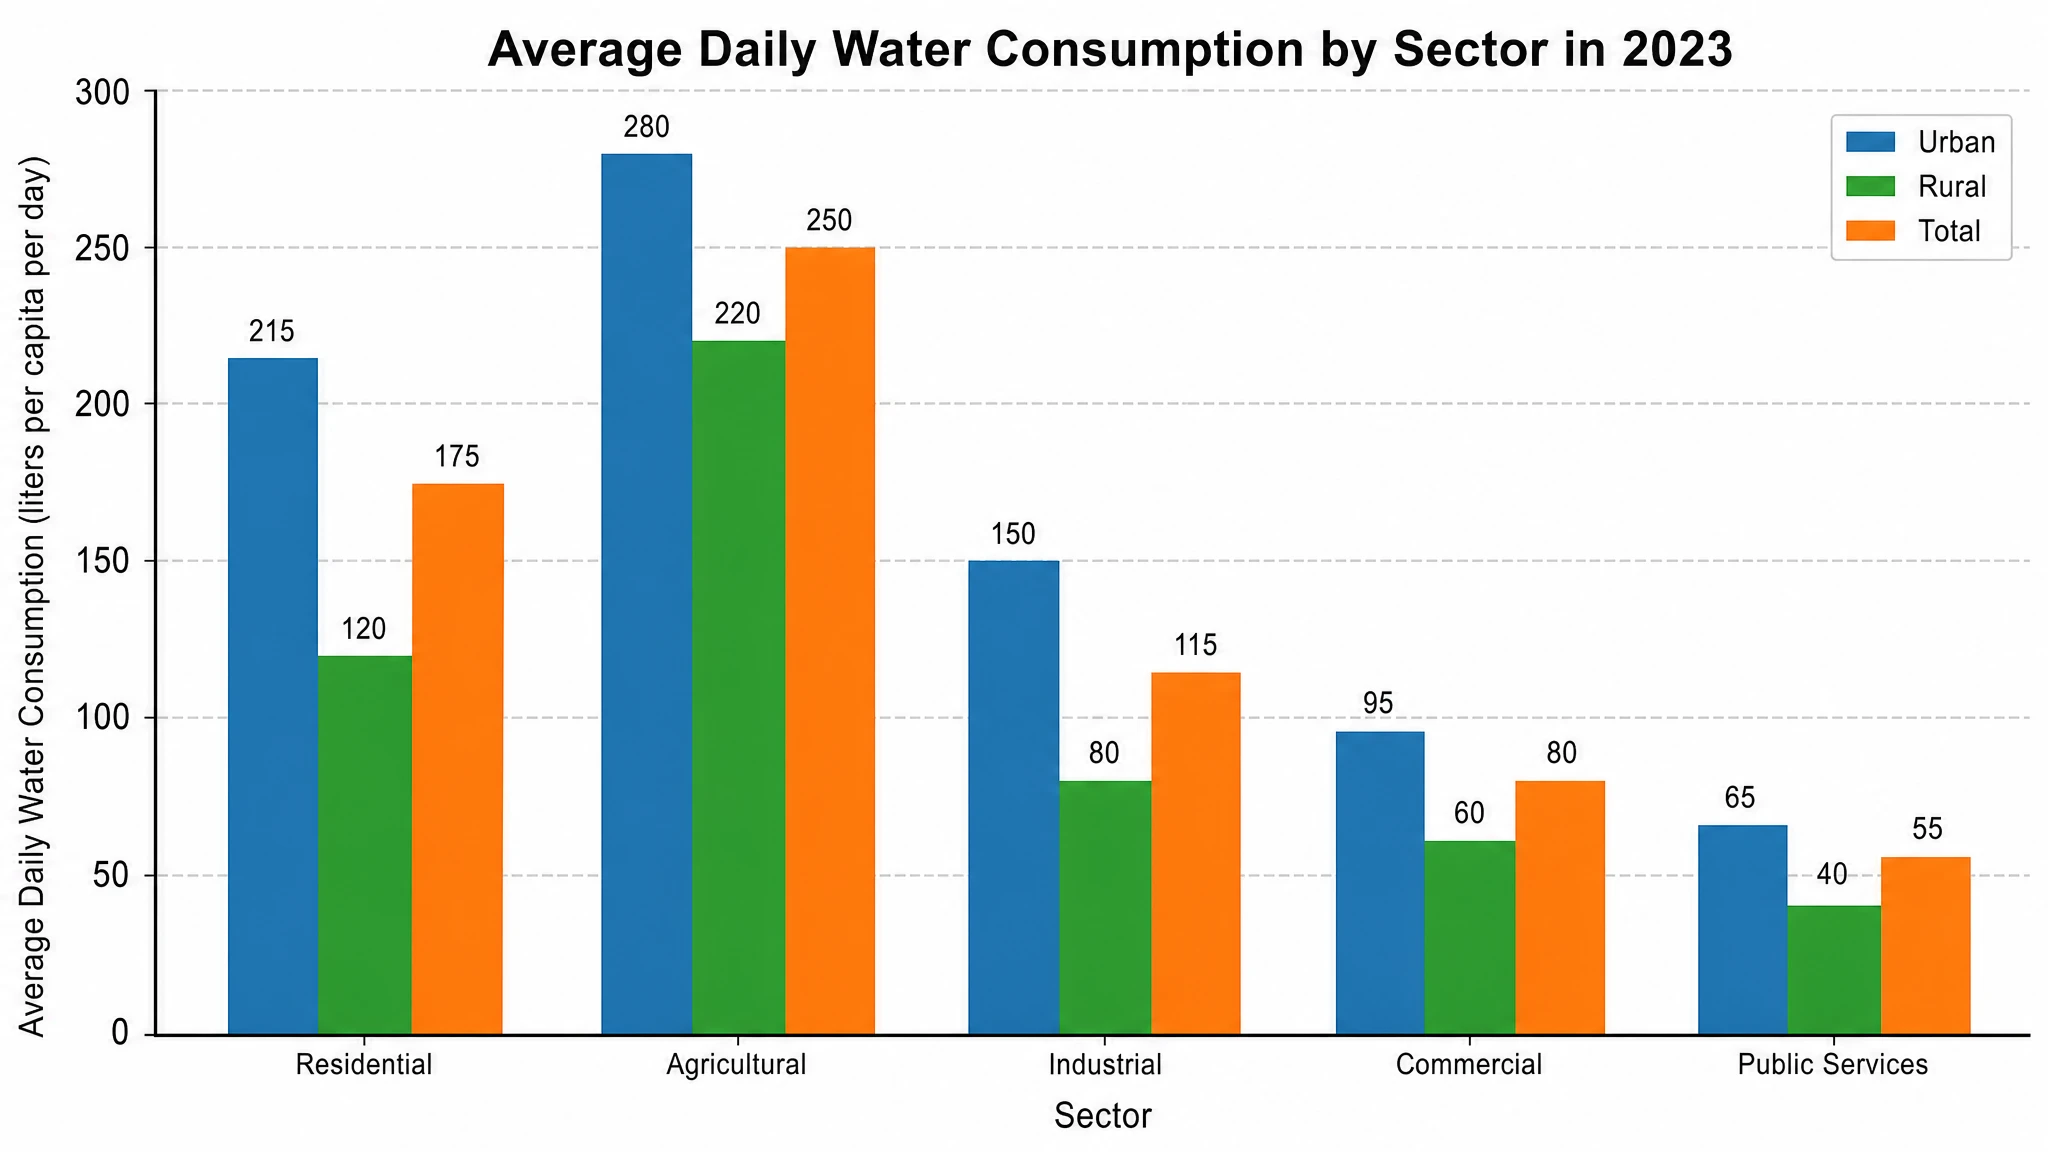
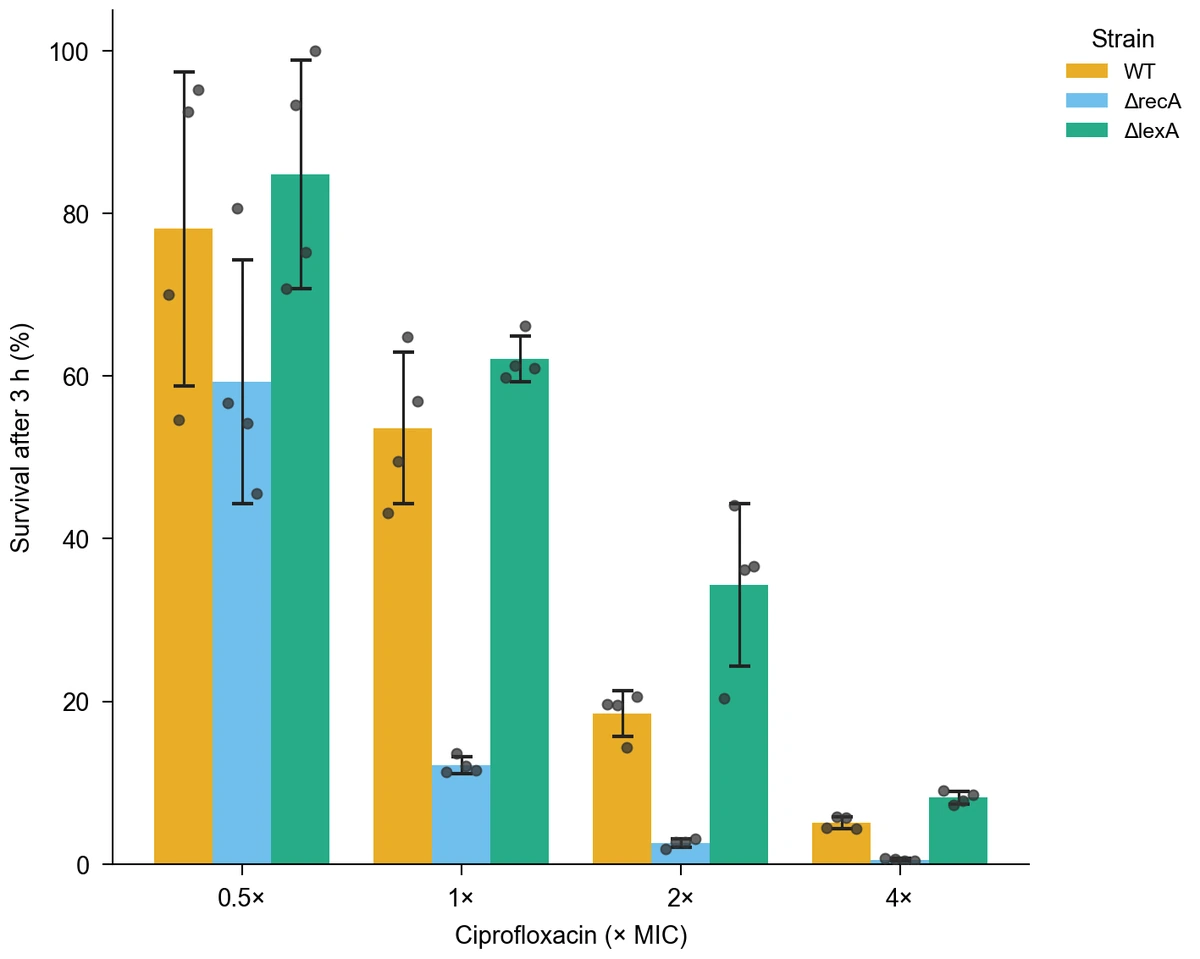
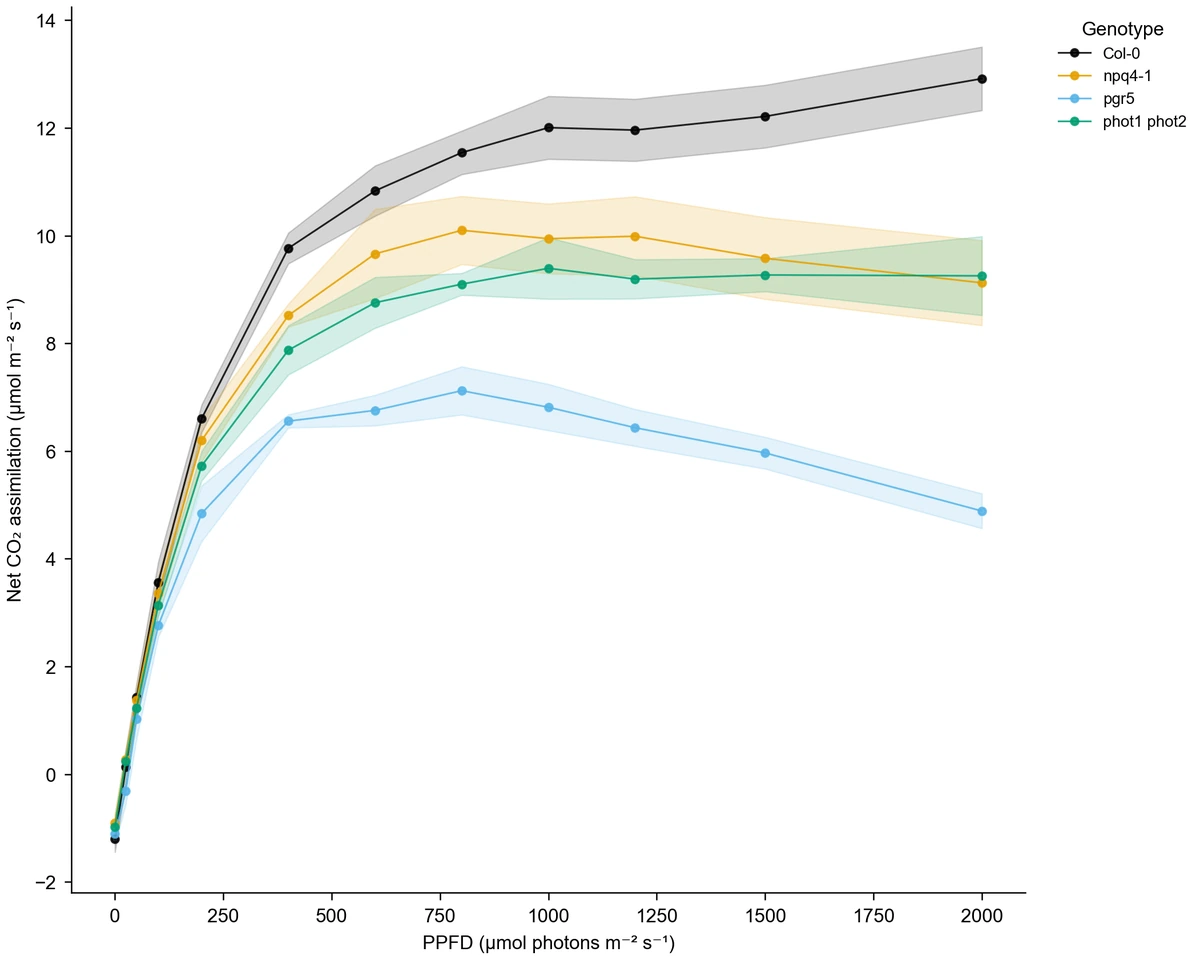
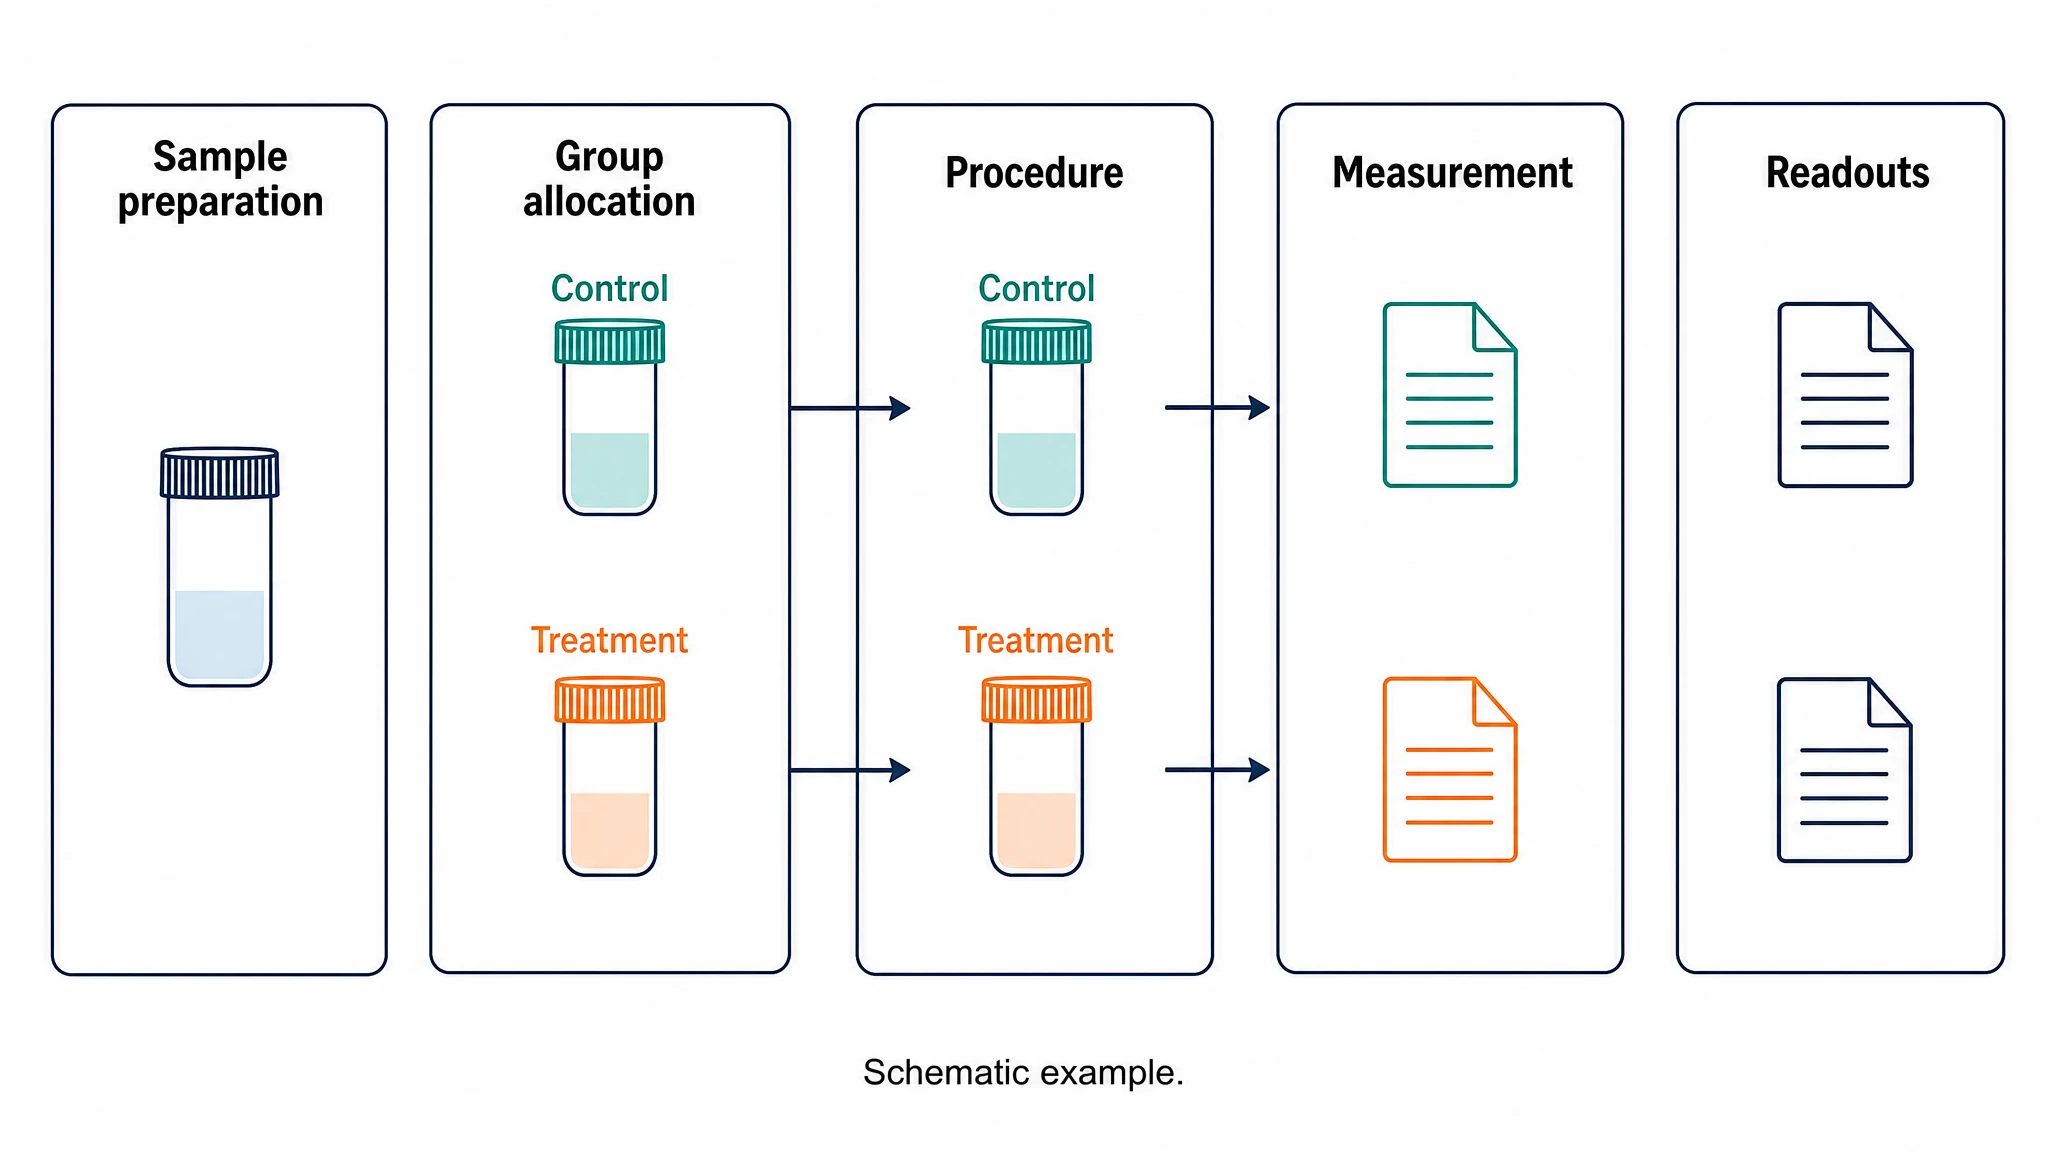
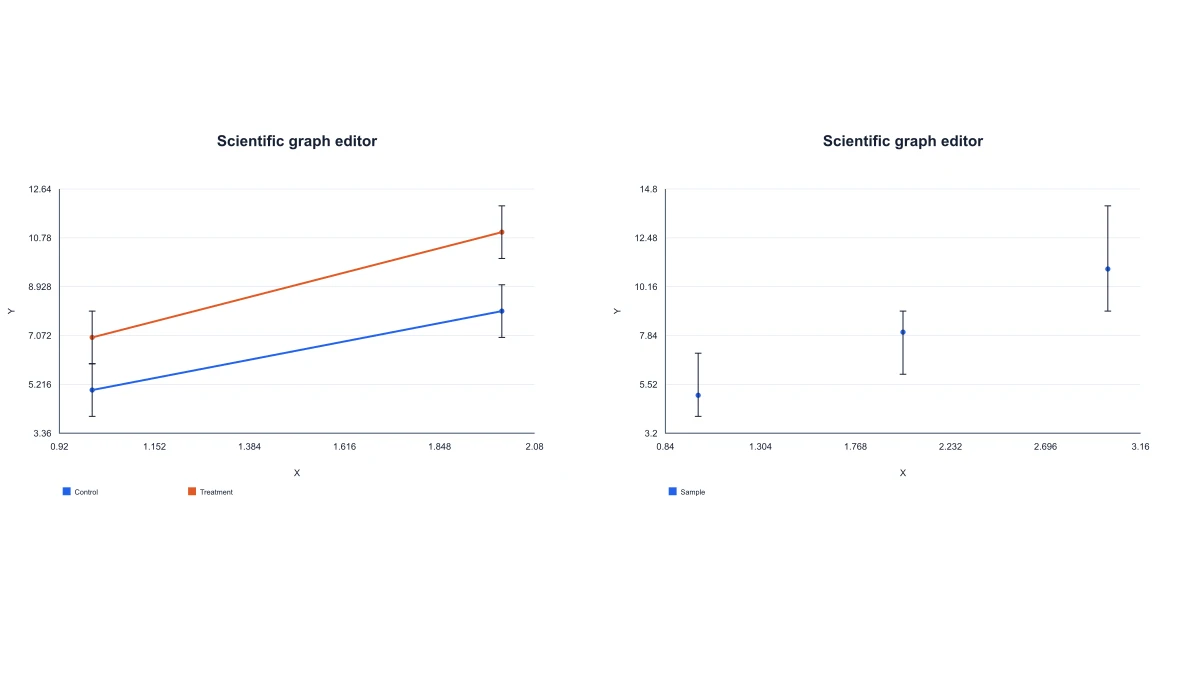
Paste repeated observations for each experimental condition and x value. The graph can display means and a chosen measure of uncertainty, connecting the visible comparison with the actual replicate data.
Explore this example