SciFig

Free UpSet Plot Generator for Set Intersections

Paste element lists for two to eight sets. Count exclusive intersections, compare set sizes and export an editable UpSet plot as SVG or PNG.

Describe what you need in the box above.

Start with up to 150 free credits|No credit card required

Get up to 350 free credits on day one when you join through an invite.

3 figure engines · 500+ templatesEvery label editable · 60+ color schemesEditable PPTX · Layered SVG · 8K PNG / JPG

Free editable UpSet plot

Enter 2–8 named element lists. Every column counts one exact, exclusive intersection. Filtering changes the display, never the set or union totals.

One element per line; identifiers are case-sensitive. Repeated elements within a set count once. Maximum 1,000 entries per set.

Set name 1
Set name 2
Set name 3
Choose exact intersections to display

Free UpSet Plot Generator for Set Intersections— templates & examples

Updated

Free scientific tools

Free UpSet Plot Generator for Set Intersections

Paste element lists for two to eight sets. Count exclusive intersections, compare set sizes and export an editable UpSet plot as SVG or PNG.

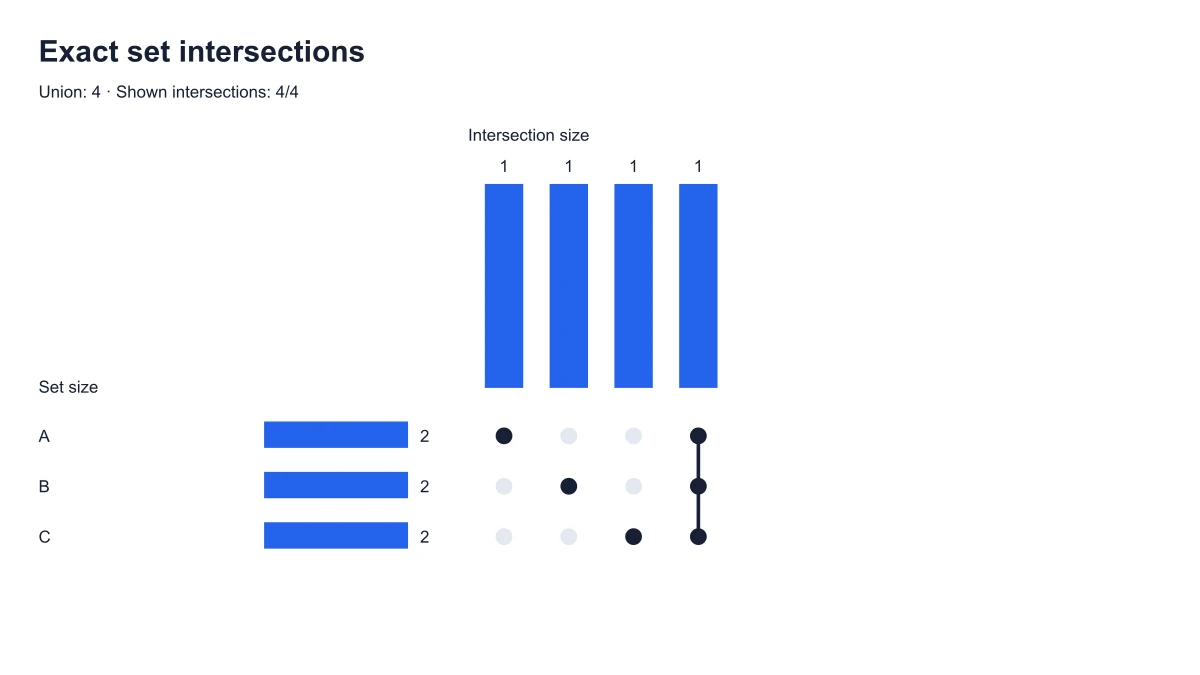
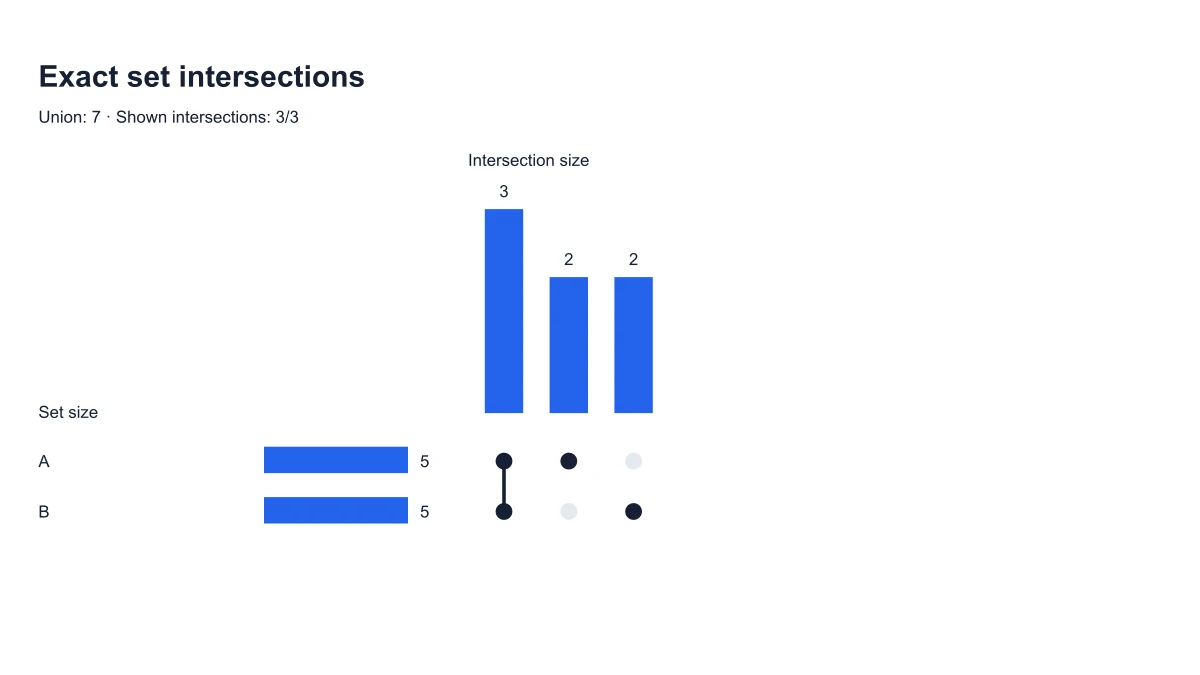
An UpSet plot displays intersections among named sets with a dot matrix and bars showing the number of elements in each intersection. Paste element lists for two to eight sets. Count exclusive intersections, compare set sizes and export an editable UpSet plot as SVG or PNG.

UpSet plot with set-size bars and exclusive intersection counts above a membership matrix
  • Count exact intersections
  • Read the intersection matrix
  • Focus the displayed intersections
  • Export a reproducible figure

UpSet Plot Generator for Set Intersections Features

Use SciFig to work with the specific inputs, labels and exported outputs described below.

Count exact intersections

SciFig’s UpSet plot generator groups each element by its complete set membership. An element shared by A, B and C appears in the three-set intersection rather than being counted again in the exclusive A–B bar. Duplicates within a set are removed before sizes and intersections are calculated.

  • Two to eight named sets
  • Deduplicate each list
  • Count exclusive memberships
Count exact intersections

Read the intersection matrix

Follow the connected dots in a column to see which sets contribute to its bar. The bar measures the exclusive intersection for that membership pattern. Set-size bars provide a separate view of the complete input sets, so a small shared group can be compared with the size of each contributing list.

  • Dots identify participating sets
  • Bars show intersection sizes
  • Set totals remain separate
Read the intersection matrix

Focus the displayed intersections

Sort and filter the displayed intersections to emphasize the comparison in your report. Display choices affect which bars you see while the underlying set totals still come from the complete input. Keep a saved settings file alongside the figure when a colleague needs to reproduce its ordering or change the display.

  • Sort the displayed bars
  • Filter the visible intersections
  • Preserve original totals
Focus the displayed intersections

Export a reproducible figure

Download SVG for a scalable figure or PNG for a slide. Save JSON settings to retain the named sets and display options, then reopen the file to continue the same comparison. The browser performs the set calculation and rendering locally; the exported figure reflects the current input rather than an inferred relationship.

  • Download vector SVG
  • Download PNG
  • Save and reopen JSON
Export a reproducible figure

How to Create the Diagram

Follow the local controls to prepare the upset plot generator from your input.

  1. Name the sets and paste elements

    Give each set a meaningful label and paste its element list. Use the same identifier for the same item across sets. A repeated item within one list contributes once to that set, while spelling differences remain different identifiers.

  2. Calculate set membership

    Apply the input to calculate exclusive intersections and set sizes. Look at the matrix column beside each intersection bar to identify its participating sets. An item belongs to one exact membership group, even when it occurs in several input lists.

  3. Choose the displayed comparison

    Select the intersection order and display filter that match your explanation. The visible bars can focus on a subset of patterns without changing the size of the input sets. Use the matrix and set totals together when describing the comparison.

  4. Download the plot and settings

    Export SVG or PNG for your document and save the JSON settings for later editing. Reopen that settings file in SciFig’s UpSet plot generator to revise the set labels or display choices while keeping the original lists.

Ways to Use the Diagram

Choose a focused figure for the question and document you are preparing.

UpSet plot with set-size bars and exclusive intersection counts above a membership matrix

Compare gene lists

Bring differentially expressed gene lists from separate contrasts into one set comparison. Use consistent gene identifiers across the lists. Exact intersections show which genes are exclusive to one contrast and which are shared by a specific combination.

Explore this example
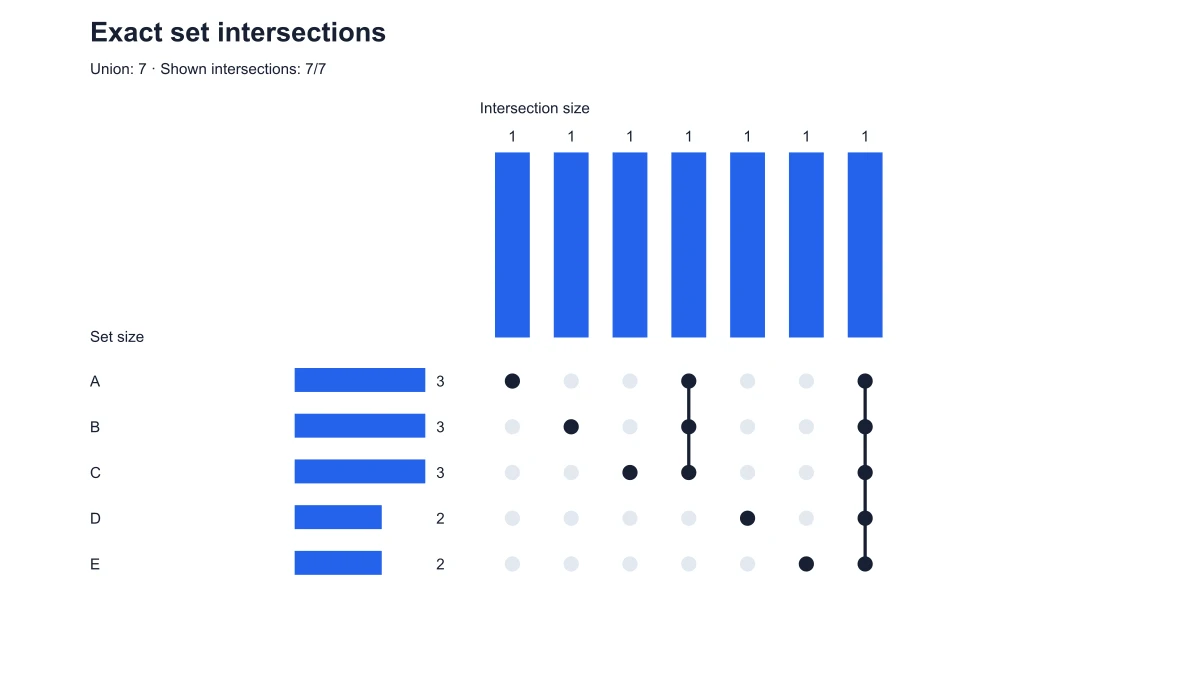
Five-set UpSet matrix and intersection bars

Compare screening hits

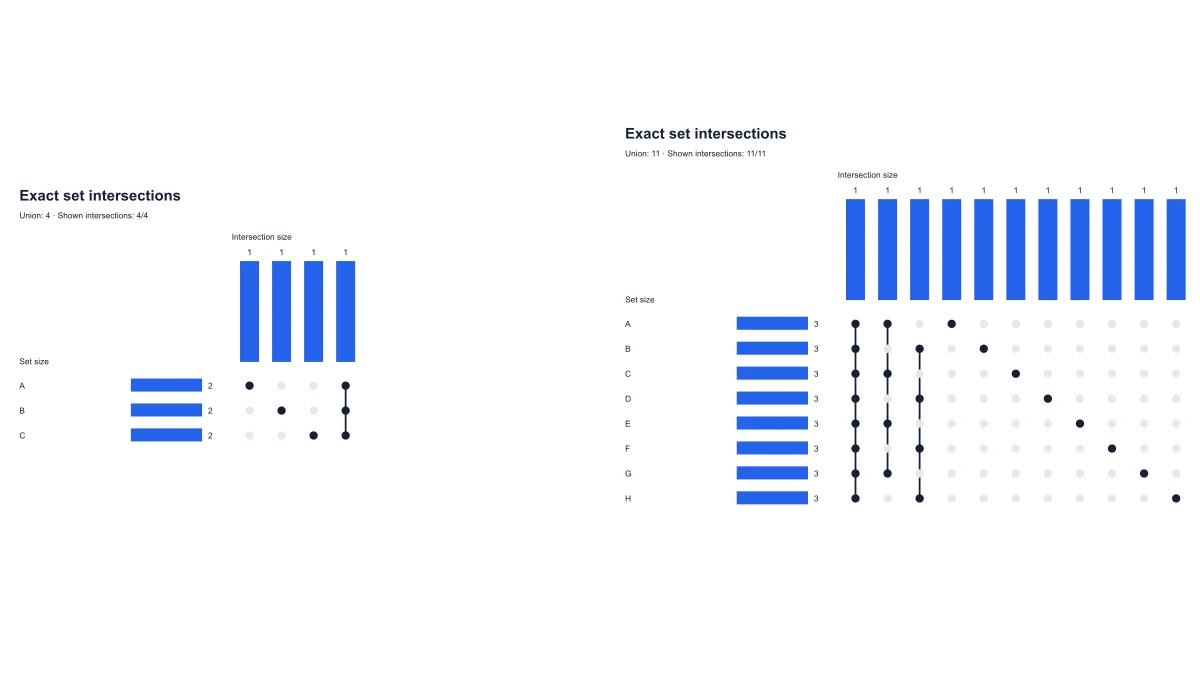
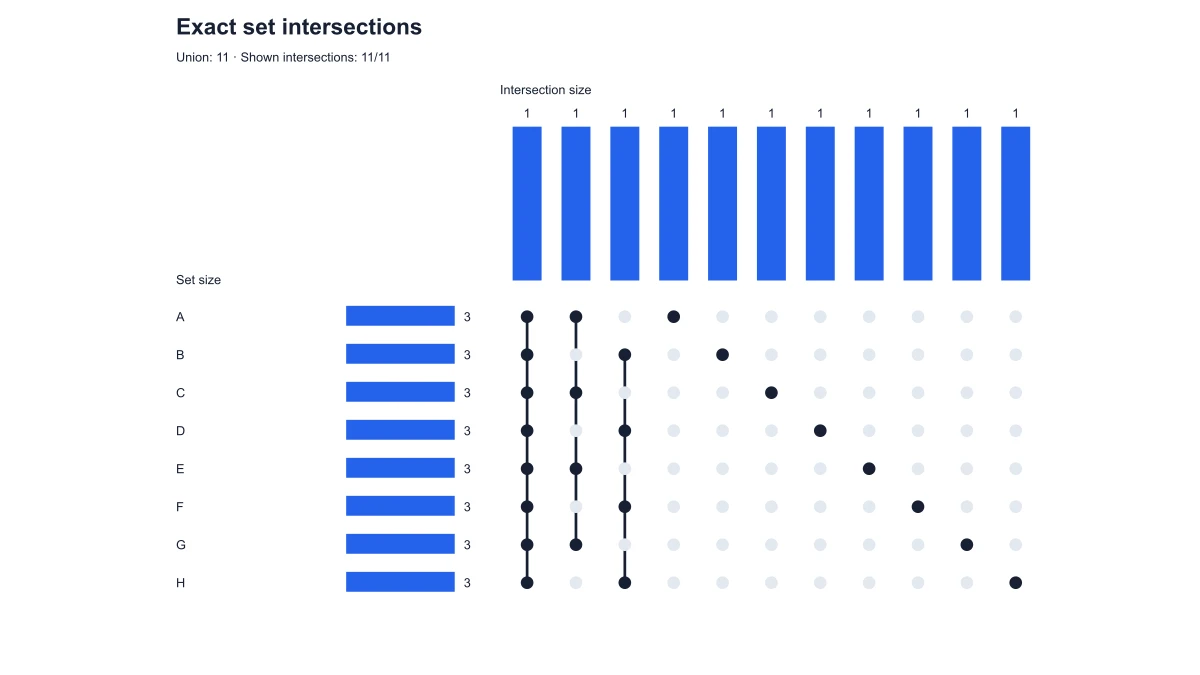
Compare manually curated hit lists from several screens. Set-size bars describe the scale of each screen’s selected list, while intersection bars identify the overlapping selections. The figure summarizes membership rather than calculating screening significance.

Explore this example
Eight named sets compared in an UpSet membership matrix

Organize literature collections

Use article identifiers to compare reading lists or search collections. A shared item is recognized by the identifier you enter. This makes overlap visible before a team assigns papers to a review or removes repeated records.

Explore this example
Three-set UpSet plot showing exclusive intersections

Teach alternatives to Venn diagrams

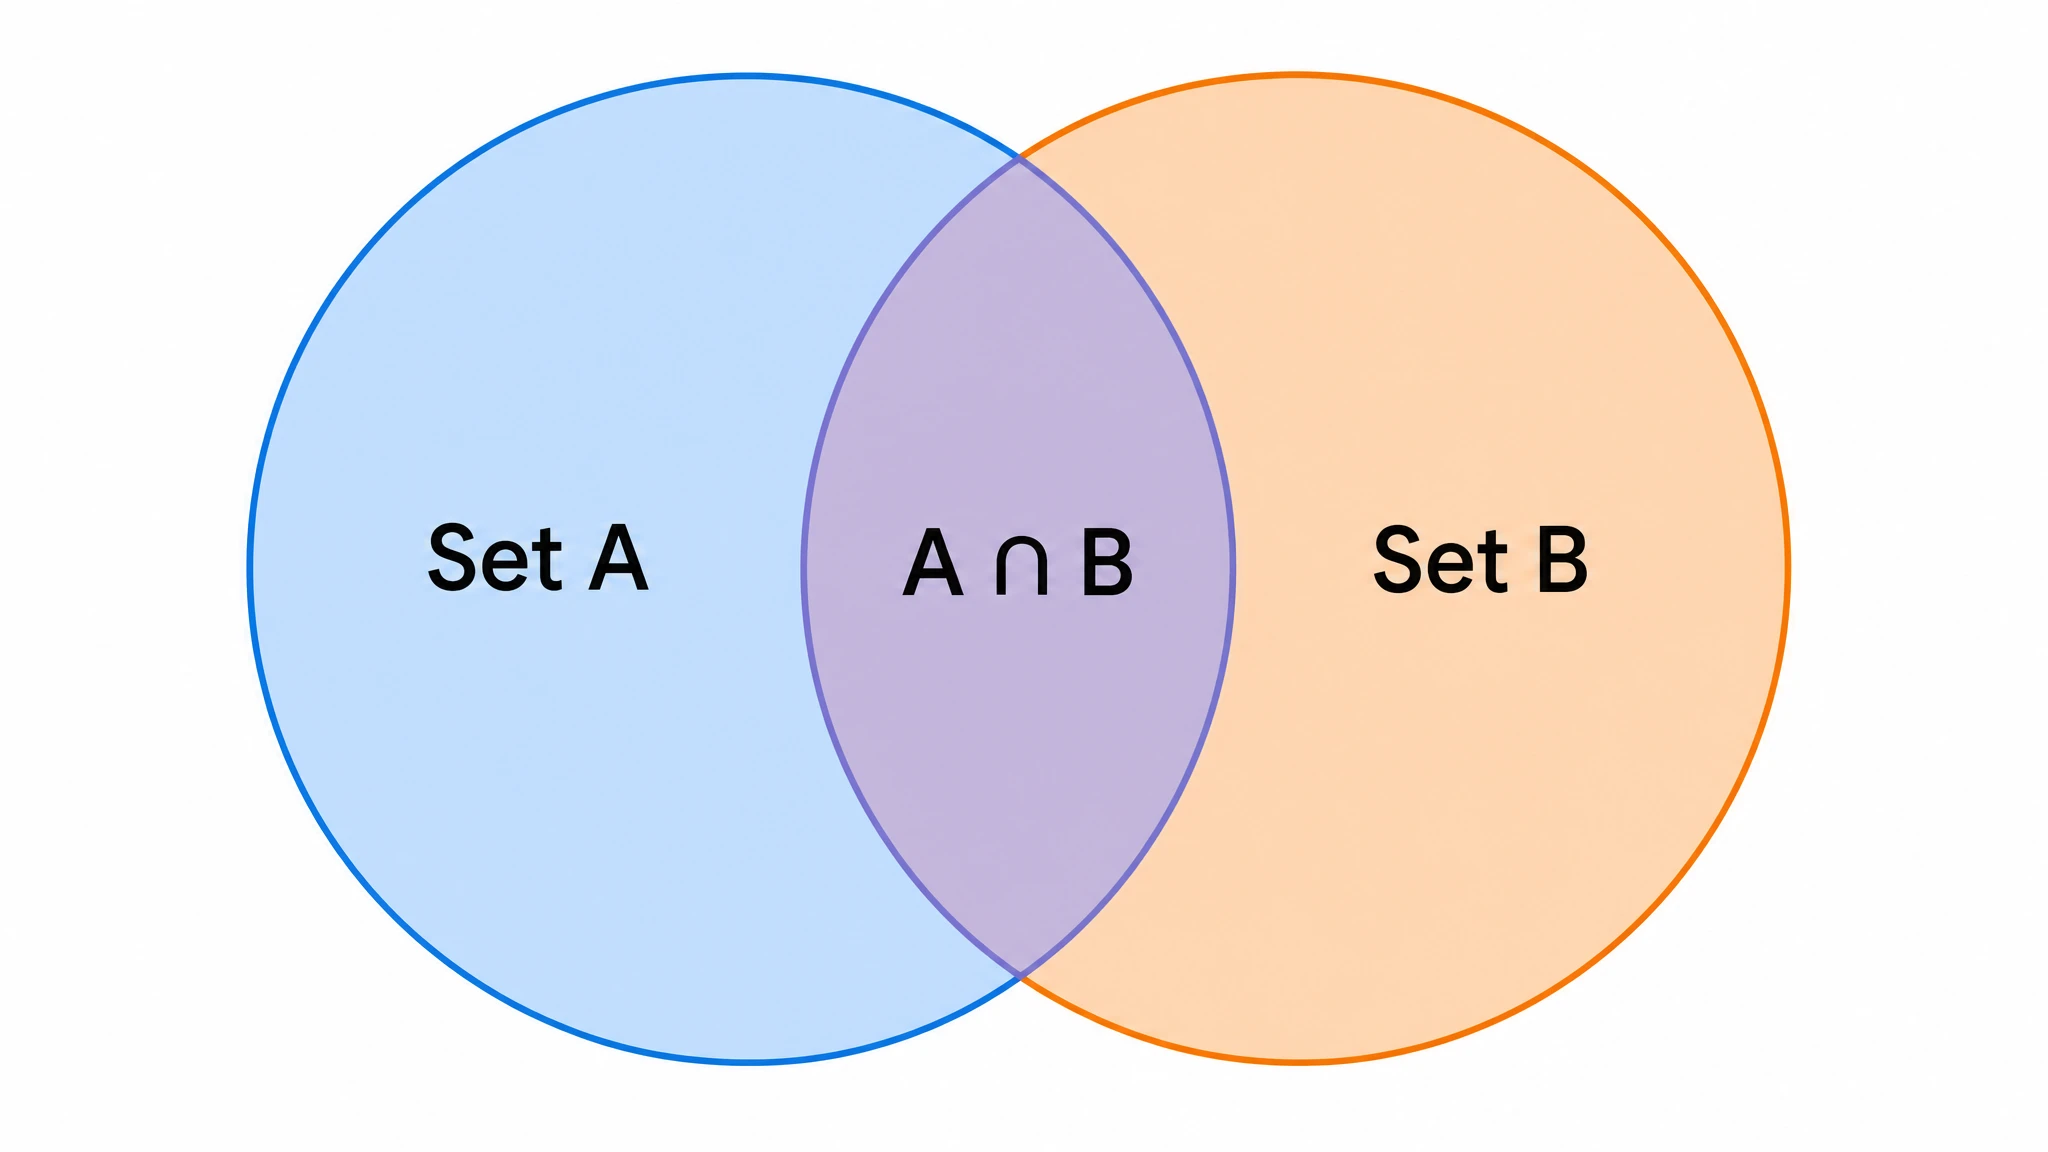
Use three-set examples to introduce exclusive intersections, then add more sets to demonstrate why an UpSet matrix is useful. Pair the plot with a Venn diagram when students are learning how membership patterns correspond across the two formats.

Explore this example
Five-set UpSet matrix and intersection bars

Summarize annotation categories

Compare lists of items assigned to several categories. An element with multiple labels contributes to the corresponding complete combination. Keep category names explicit so the audience can distinguish overlapping membership from mutually exclusive classification.

Explore this example
Filtered UpSet intersections with full set and union totals retained

Share a set-analysis figure

Save the settings with the exported plot when handing a figure to a collaborator. They can reopen the lists and change the visible ordering. The plot gives a compact report of set membership without implying enrichment, statistical significance or a causal link.

Explore this example
How Researchers Use SciFig

Our gene-list discussion kept mixing shared hits with exclusive overlaps. I entered the three named lists into the UpSet plot generator and checked the triple intersection against our notes. The matrix and bars gave the group one consistent figure, and I saved the settings alongside the meeting slides for the next comparison.

Maya Chen

Computational Genomics Researcher · University of Edinburgh

Free tools

A tool for every scientific figure

130 focused generators for the scientific figure you need — each opens in the right workspace with a matching example.

Illustrations, structures and concept diagrams

68 tools
Chemistry Structure Generator example figureChemistry Structure GeneratorGraphical Abstract Maker example figureGraphical Abstract MakerFree Body Diagram Generator example figureFree Body Diagram GeneratorCircuit Diagram Maker example figureCircuit Diagram MakerAI Scientific Image Generator example figureAI Scientific Image GeneratorEditable 96-Well Plate example figureEditable 96-Well PlateLewis Dot Structure Generator example figureLewis Dot Structure GeneratorDNA Structure Diagram Generator example figureDNA Structure Diagram GeneratorWiring Diagram Maker example figureWiring Diagram MakerP&ID Diagram Generator example figureP&ID Diagram GeneratorScientific Poster Generator example figureScientific Poster GeneratorCladogram Maker example figureCladogram MakerFood Web Maker example figureFood Web MakerMedical Illustration Generator example figureMedical Illustration GeneratorPCR Diagram Generator example figurePCR Diagram GeneratorPPT Text to Visual Converter example figurePPT Text to Visual ConverterMitosis Diagram Generator example figureMitosis Diagram GeneratorAI Infographic Generator example figureAI Infographic GeneratorAnatomical Drawing Generator example figureAnatomical Drawing GeneratorAnimal and Plant Cell Comparison example figureAnimal and Plant Cell ComparisonAnimal Cell Diagram Generator example figureAnimal Cell Diagram GeneratorAntibody Structure Diagram Generator example figureAntibody Structure Diagram GeneratorApoptosis Diagram Generator example figureApoptosis Diagram GeneratorAutophagy Diagram Generator example figureAutophagy Diagram GeneratorBacteria Diagram Generator example figureBacteria Diagram GeneratorBlueprint Maker example figureBlueprint MakerBohr Model Maker example figureBohr Model MakerCalvin Cycle Diagram Generator example figureCalvin Cycle Diagram GeneratorCarbon Cycle Diagram Generator example figureCarbon Cycle Diagram GeneratorCell Cycle Diagram Generator example figureCell Cycle Diagram GeneratorCellular Respiration Diagram Generator example figureCellular Respiration Diagram GeneratorComplement System Diagram Generator example figureComplement System Diagram GeneratorCRISPR-Cas9 Diagram Generator example figureCRISPR-Cas9 Diagram GeneratorDNA Replication Diagram Generator example figureDNA Replication Diagram GeneratorElectron Configuration Diagram Generator example figureElectron Configuration Diagram GeneratorElectron Transport Chain Diagram Generator example figureElectron Transport Chain Diagram GeneratorELISA Diagram Generator example figureELISA Diagram GeneratorGel Electrophoresis Diagram Generator example figureGel Electrophoresis Diagram GeneratorGene Regulation Diagram Generator example figureGene Regulation Diagram GeneratorGlycolysis Diagram Generator example figureGlycolysis Diagram GeneratorImage to Editable SVG Converter example figureImage to Editable SVG ConverterImmune Checkpoint Diagram Generator example figureImmune Checkpoint Diagram GeneratorImmune Response Diagram Generator example figureImmune Response Diagram GeneratorInflammasome Diagram Generator example figureInflammasome Diagram GeneratorKrebs Cycle Diagram Generator example figureKrebs Cycle Diagram GeneratorLab Diagram Maker example figureLab Diagram MakerMeiosis Diagram Generator example figureMeiosis Diagram GeneratorMetabolic Pathway Diagram Generator example figureMetabolic Pathway Diagram GeneratorMolecular Orbital Diagram Generator example figureMolecular Orbital Diagram GeneratorNitrogen Cycle Diagram Generator example figureNitrogen Cycle Diagram GeneratorPedigree Chart Maker example figurePedigree Chart MakerPhospholipid Diagram Generator example figurePhospholipid Diagram GeneratorPhosphorus Cycle Diagram Generator example figurePhosphorus Cycle Diagram GeneratorPhotosynthesis Diagram Generator example figurePhotosynthesis Diagram GeneratorPhylogenetic Tree Maker example figurePhylogenetic Tree MakerPhysics Vector Diagram Maker example figurePhysics Vector Diagram MakerPlant Cell Diagram Generator example figurePlant Cell Diagram GeneratorPlasmid Map Maker example figurePlasmid Map MakerProtein Synthesis Diagram Generator example figureProtein Synthesis Diagram GeneratorPunnett Square Maker example figurePunnett Square MakerRay Diagram Maker example figureRay Diagram MakerRNA Structure Diagram Generator example figureRNA Structure Diagram GeneratorScientific Color Palette Generator example figureScientific Color Palette GeneratorSignaling Pathway Diagram Generator example figureSignaling Pathway Diagram GeneratorSingle Line Diagram Generator example figureSingle Line Diagram GeneratorT-Cell Activation Diagram Generator example figureT-Cell Activation Diagram GeneratorWater Cycle Diagram Generator example figureWater Cycle Diagram GeneratorWestern Blot Diagram Generator example figureWestern Blot Diagram Generator
UpSet Plot Generator for Set Intersections Questions

1.

2.

3.

4.

5.

6.

Call to action background

Create with SciFig

Free UpSet Plot Generator for Set Intersections

Open the free tool

Free to start · No credit card required · Built for researchers