Venn Diagram Generator
Build clear venn diagrams online — two-set, three-circle, or multi-set — with accurately overlapping circles and labeled intersection regions for research and teaching.
Figure prompt
Core Subject (e.g., Cas9 protein cutting DNA)
Action / Details (e.g., Double strand break, detailed molecular view)
Start with 100 free credits|No credit card required
Get up to 300 free credits on day one when you join through an invite.
Reviewed by SciFig TeamUpdated
Venn Diagram Generator— templates & examples
Everything you need to generate your venn diagram
Two, three, or multi-set layouts
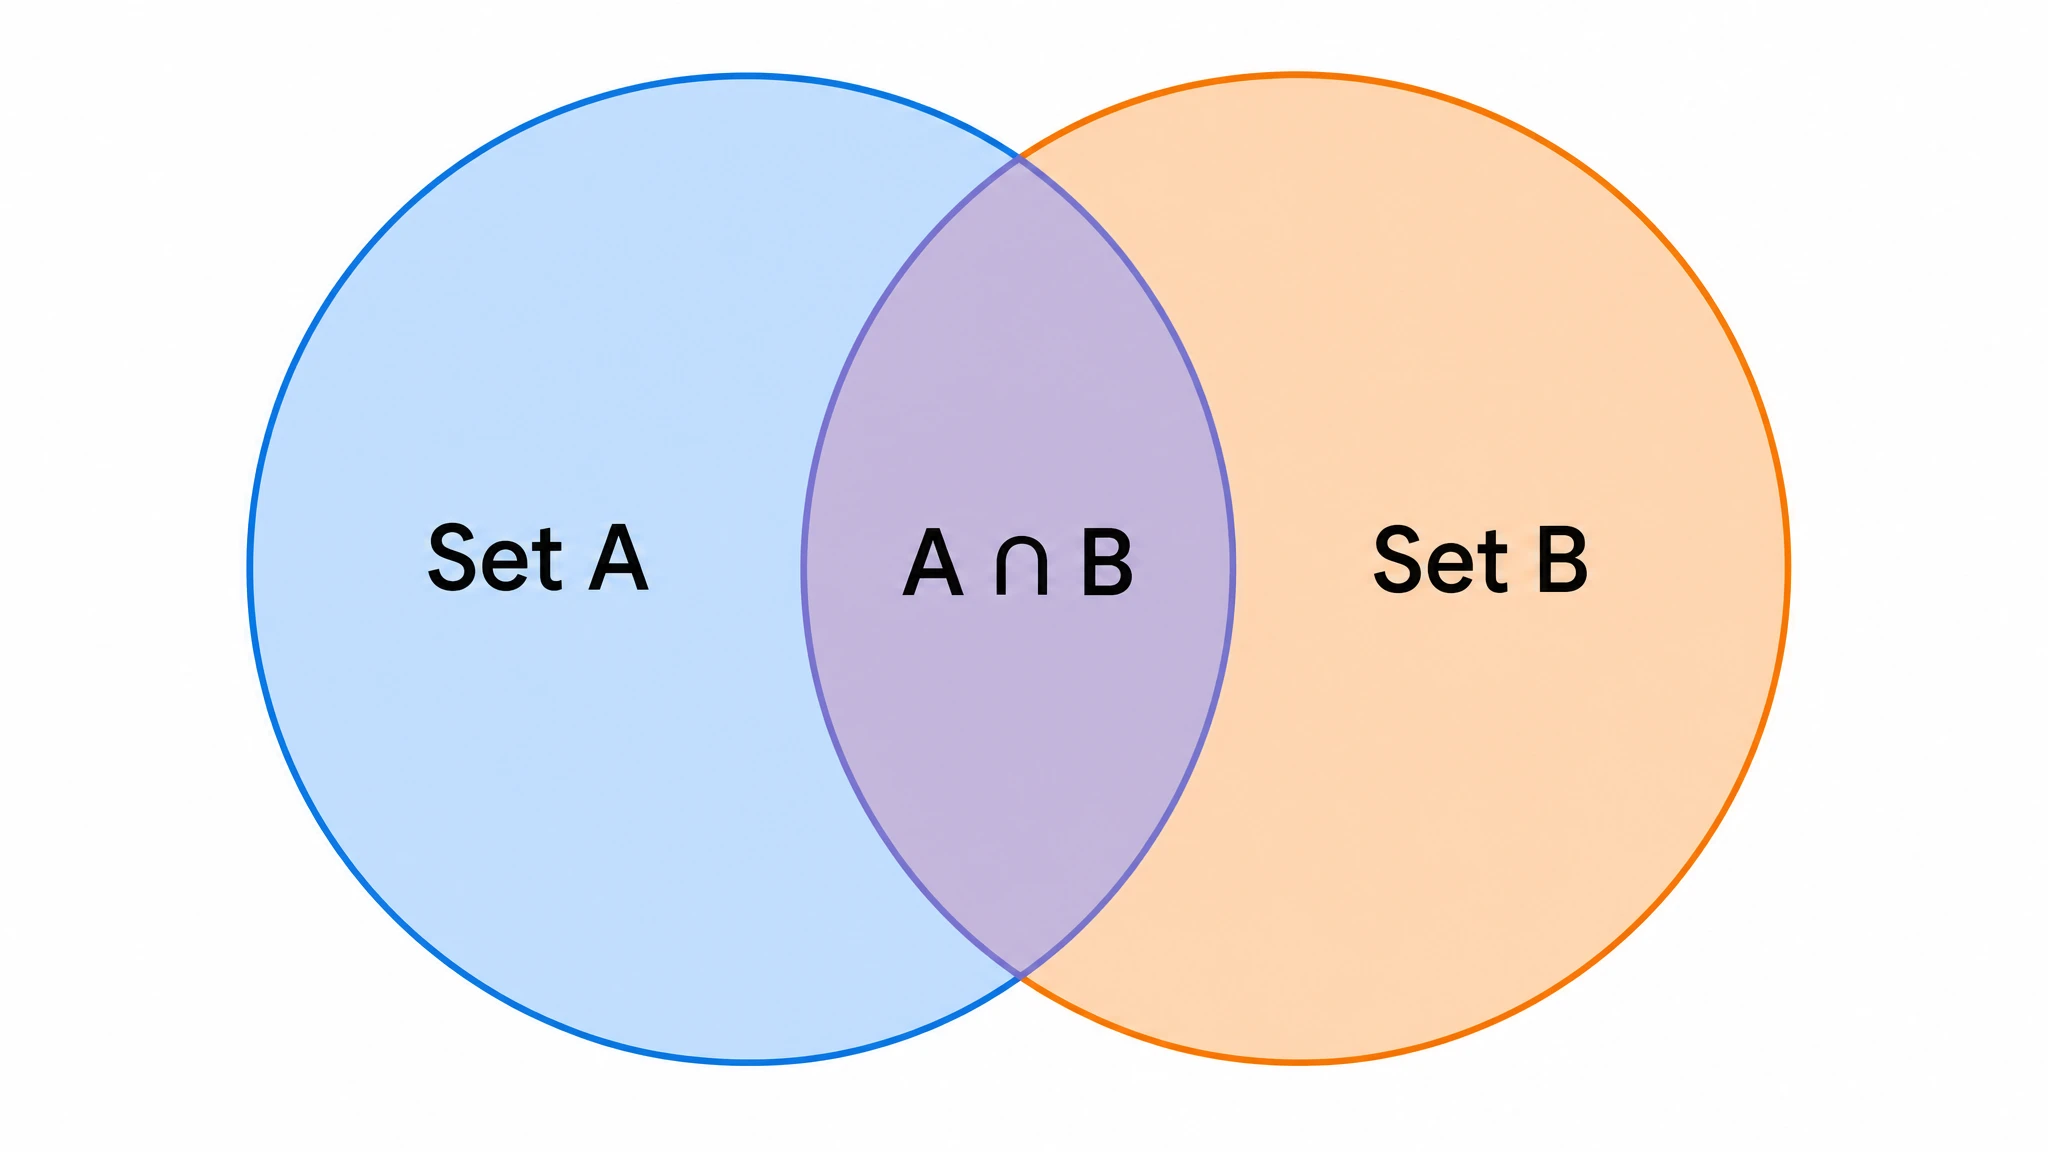
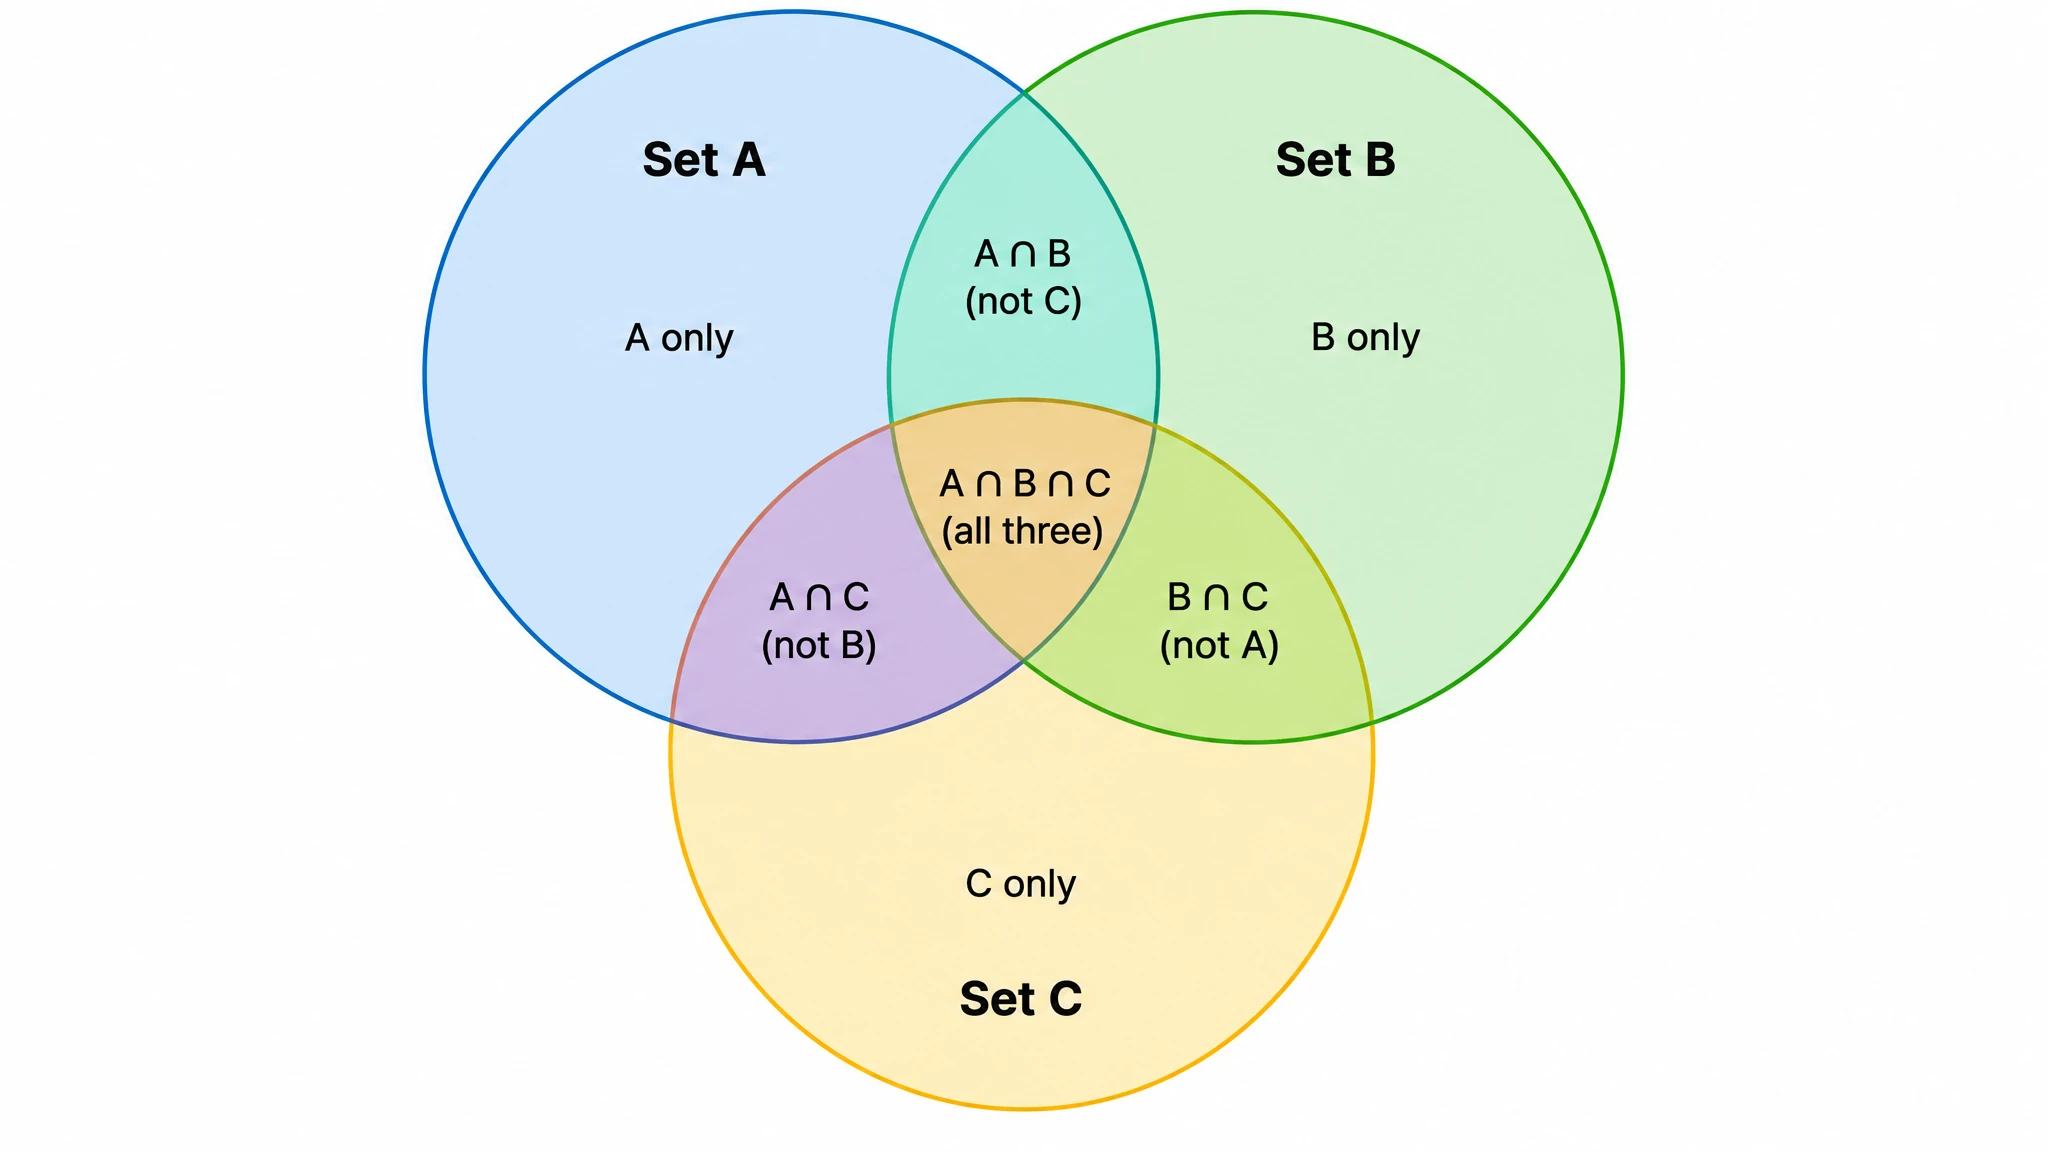
Whether you need a simple two set venn diagram for an A-versus-B comparison or a 3 circle venn diagram with seven distinct regions, SciFig's venn diagram generator builds each layout with mathematically correct overlapping circles. Add more sets for complex comparisons and the tool keeps every intersection sized and positioned accurately. Switch between two-set and three-set arrangements from the same description without realigning a single circle by hand.
Labeled regions, publication-ready style
Every circle and every overlapping region can carry its own label, so set intersections read clearly at a glance. The venn diagram online output uses clean typography and balanced colors that hold up in peer-reviewed manuscripts, conference posters, and lecture slides. Because the geometry is accurate, reviewers see precise set relationships rather than approximate overlaps — exactly what scientific figures require.
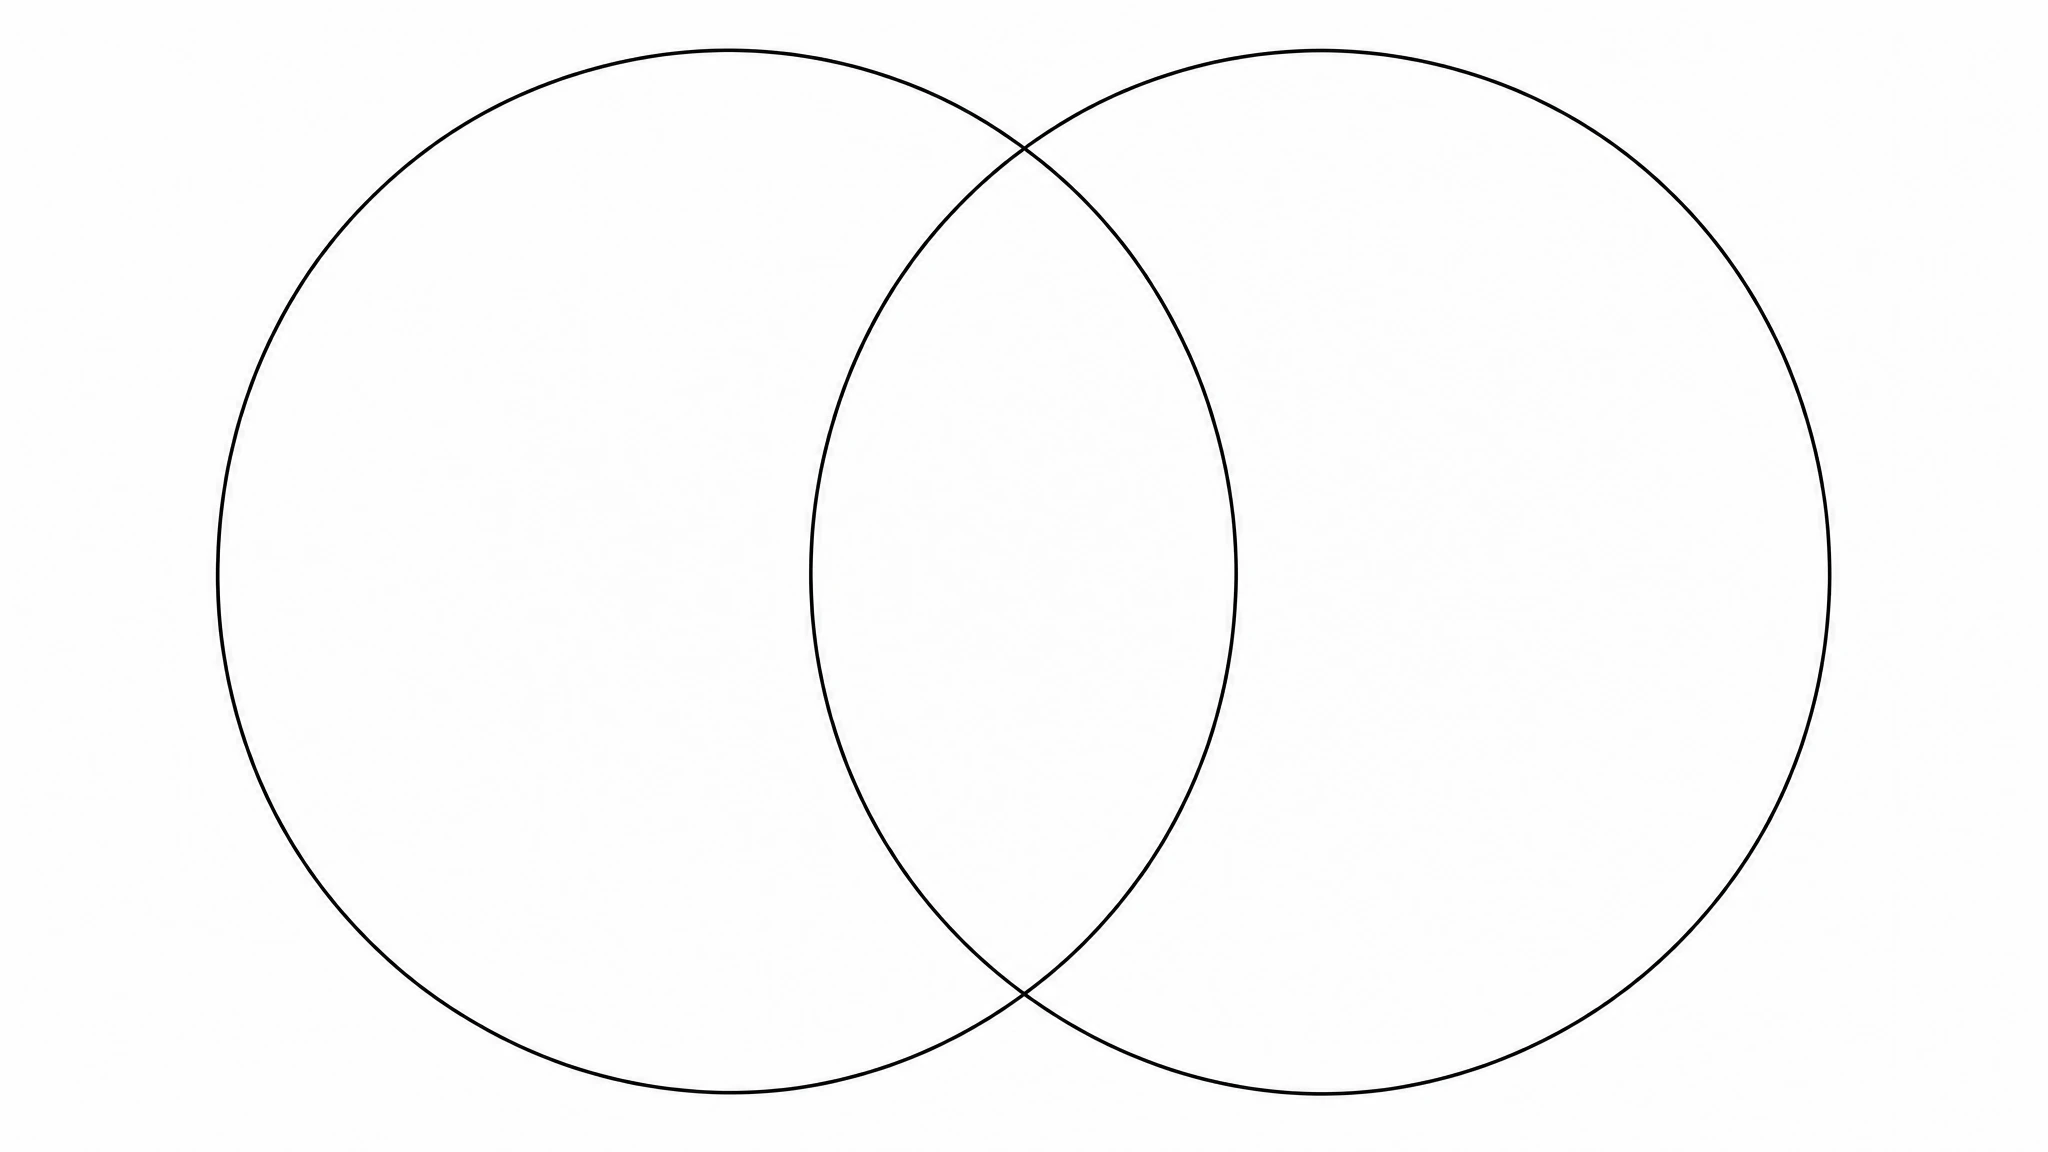
Blank templates and instant export
Generate a blank venn diagram template with empty overlapping circles for worksheets and brainstorming, or a fully labeled figure for publication — both from the same prompt. As a free venn diagram maker for routine diagrams, SciFig lets you adjust colors, relabel regions, and download high-resolution images ready to print or embed. Create a venn diagram online and have it slide-ready in under a minute.
What is a Venn diagram?
A venn diagram shows the logical relationships between sets as overlapping circles, where each overlap is the intersection — the elements shared between sets. They range from a simple two-set diagram to a three-circle or multi-set layout, and are widely used in research, statistics, and set theory. SciFig's venn diagram generator produces a clean, accurately proportioned, fully editable figure in seconds — choose two, three, or more sets, label each circle and overlapping region, then export.
Why an accurate venn diagram matters
- Overlapping circles communicate set relationships far faster than tables or prose descriptions
- Accurate intersection geometry prevents readers from misjudging how much two or more sets share
- Labeled venn diagrams are standard figures in research papers comparing groups, methods, or datasets
- A two-set venn diagram makes direct A-versus-B comparisons instantly legible for any audience
- A 3 circle venn diagram reveals pairwise and triple overlaps that text alone cannot convey clearly
- Editable diagrams let researchers update labels and colors as analyses and datasets evolve
Key parts of a venn diagram
- Circles (sets) — each closed circle represents one set or group being compared
- Intersection — the overlapping region where elements shared between sets are placed
- Labels — text identifying each set and each overlapping region for clear reading
- Exclusive regions — the non-overlapping parts of each circle holding elements unique to that set
- Universal set — the surrounding boundary or frame defining the full collection of elements
- Pairwise overlaps — in a 3 circle venn diagram, the three regions where exactly two sets cross
- Triple intersection — the central region of a three-set diagram shared by all three sets
Where venn diagrams are used
- Research papers comparing overlapping gene sets, samples, or experimental conditions
- Statistics and set theory teaching covering unions, intersections, and complements
- Biology and bioinformatics figures showing shared markers across groups
- Survey and market analysis comparing audience segments and shared respondents
- Lecture slides, worksheets, and exam materials in math and science courses
- Grant proposals and presentations requiring clear group-comparison figures
- Brainstorming and decision-making sessions mapping shared versus unique criteria
How to make a Venn diagram
Describe your Venn diagram
Tell SciFig what to draw in plain language — no design tools required.
Generate with SciFig
Get a clean, publication-ready figure that matches your description in seconds.
Edit & export
Vectorize it into editable SVG, relabel everything, and export for your paper, poster, or slides.
Venn Diagram Generator — Frequently Asked Questions
Common questions about Venn Diagram Generator.
More tools

Conceptual Framework Generator
Create professional conceptual framework diagrams showing variable relationships, hypotheses, and theoretical models for your research.

Free Body Diagram Generator
Create accurate, publication-ready free body diagrams with labeled force vectors for weight, normal force, friction, and tension in seconds.

Bell Curve Generator
Generate a precise, fully labeled bell curve showing mean, standard deviations, and percentile regions — ready to export for your paper, thesis, or classroom.
Related links
Home
Turn text, sketches, references, PDFs, and photos into Scientific Figures
Text-to-Figure
Generate a figure from a plain-language description
Models
Default to GPT Image 2 for journal papers; switch to Nano Banana Pro for slides and posters; pick Nano Banana 2 for routine figure work
Tutorials
Seven short walkthroughs of the AI scientific figure generator
Blog
Tutorials, tool comparisons, and publication tips for researchers.
Inspiration
Explore publication-ready scientific figure examples, copy the prompts, and use them as starting points for your own work.

Ready to publish?
Make your own Venn diagram in minutes.
Start for freeFree to start · No credit card required · Built for researchers