SciFig

Turn your process into a flowchart

Describe your methods or upload a PDF, Word file, or image — edit every node and arrow, export to SVG or PPTX.

Describe what you need in the box above.

Start with up to 150 free credits|No credit card required

Get up to 350 free credits on day one when you join through an invite.

3 figure engines · 500+ templatesEvery label editable · 60+ color schemesEditable PPTX · Layered SVG · 8K PNG / JPG

Image to Flowchart: Rebuild Diagrams as Editable Flowcharts— templates & examples

From a photo, screenshot or sketch to editable boxes

Image to Flowchart: Rebuild Diagrams as Editable Flowcharts

Upload a picture of a flowchart and continue with nodes, labels and arrows you can edit.

Use image to flowchart when the only copy of a process is a picture: a pencil sketch from the bench, a whiteboard after a lab meeting, a slide screenshot or a figure from an older paper. Attach the image, say what to keep, and FlowChart generates a native SVG in which every step is its own shape with real text and every arrow is a connector. Check it against the original, change any box or branch, and export SVG, PNG, JPG or PPTX. The examples show five real reconstructions, from a sample protocol to a CONSORT trial flow.

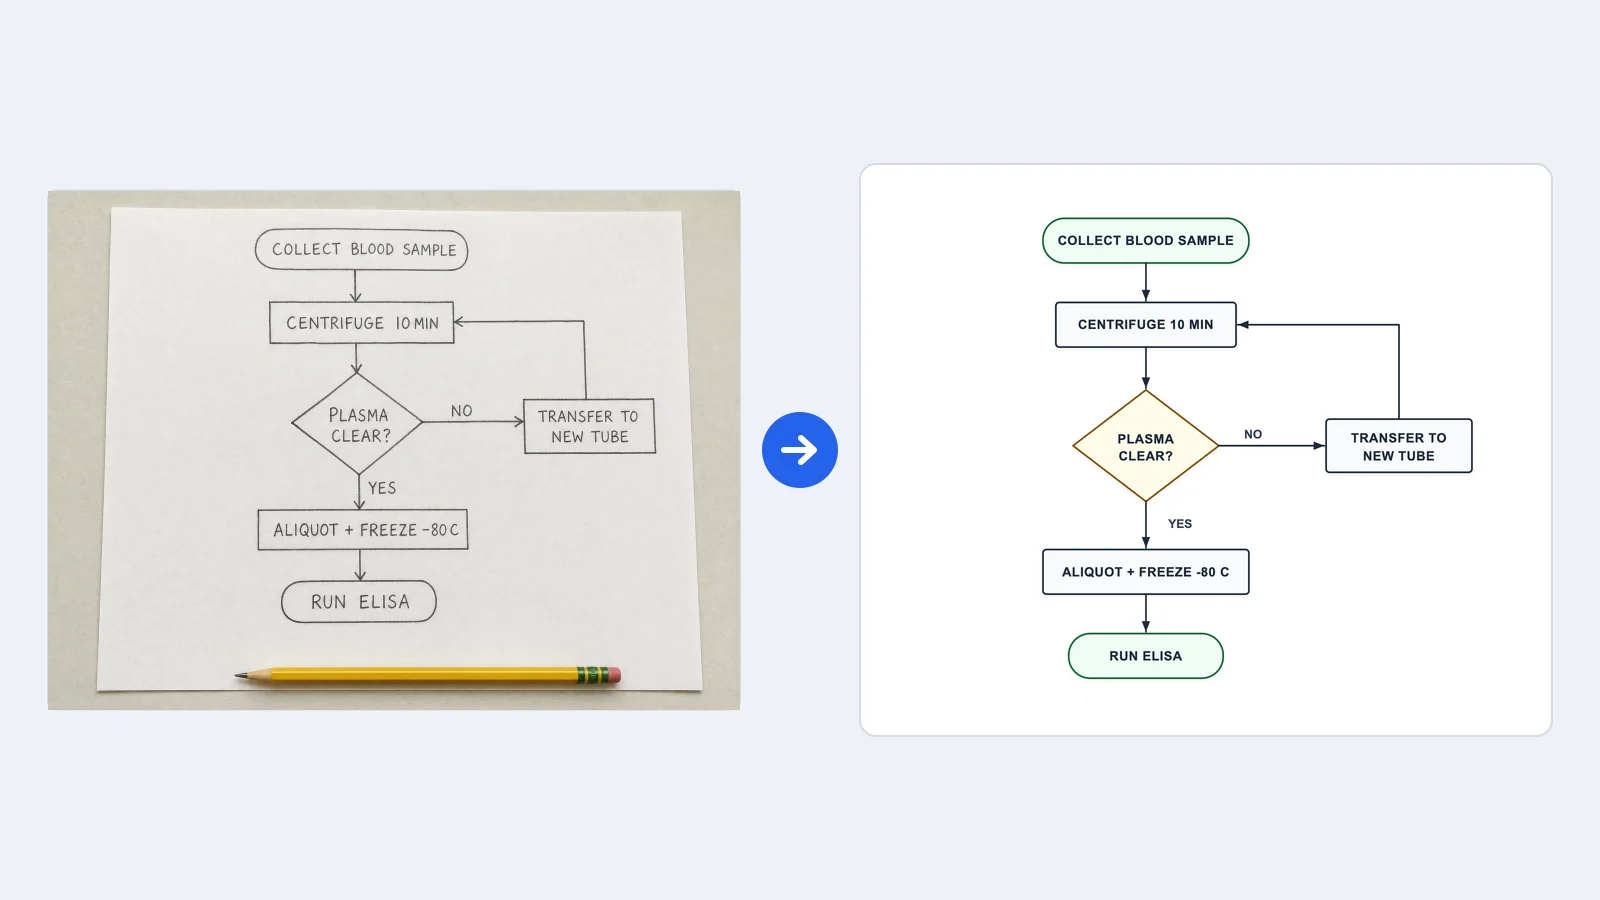
Pencil sketch of a blood sample protocol with a plasma check loop, next to the same flowchart rebuilt in FlowChart as editable boxes
  • Upload PNG, JPG, JPEG or WebP images up to 3 MB
  • Rebuild steps, decisions, labels and arrow directions
  • Edit every node, text and connector afterwards
  • Export SVG, PNG, JPG or PPTX

Image to Flowchart Features for Real Diagrams

Each part of the tool deals with one step between a flat picture and a diagram you can keep editing.

Read sketches, photos and screenshots

Picture to flowchart starts with the image you already have: a pencil drawing, a whiteboard photo taken at an angle, a low-resolution slide or a grayscale figure from a scanned article. FlowChart reads the boxes, labels and arrows in the image together with your written instruction, so you can point out what matters, such as a loop, a pair of trial arms or the exact numbers in each box.

  • PNG, JPG, JPEG and WebP up to 3 MB
  • Hand-drawn, photographed or screenshot diagrams
  • Your instruction guides what to keep
Upload a sketch

Rebuild nodes, decisions and connectors

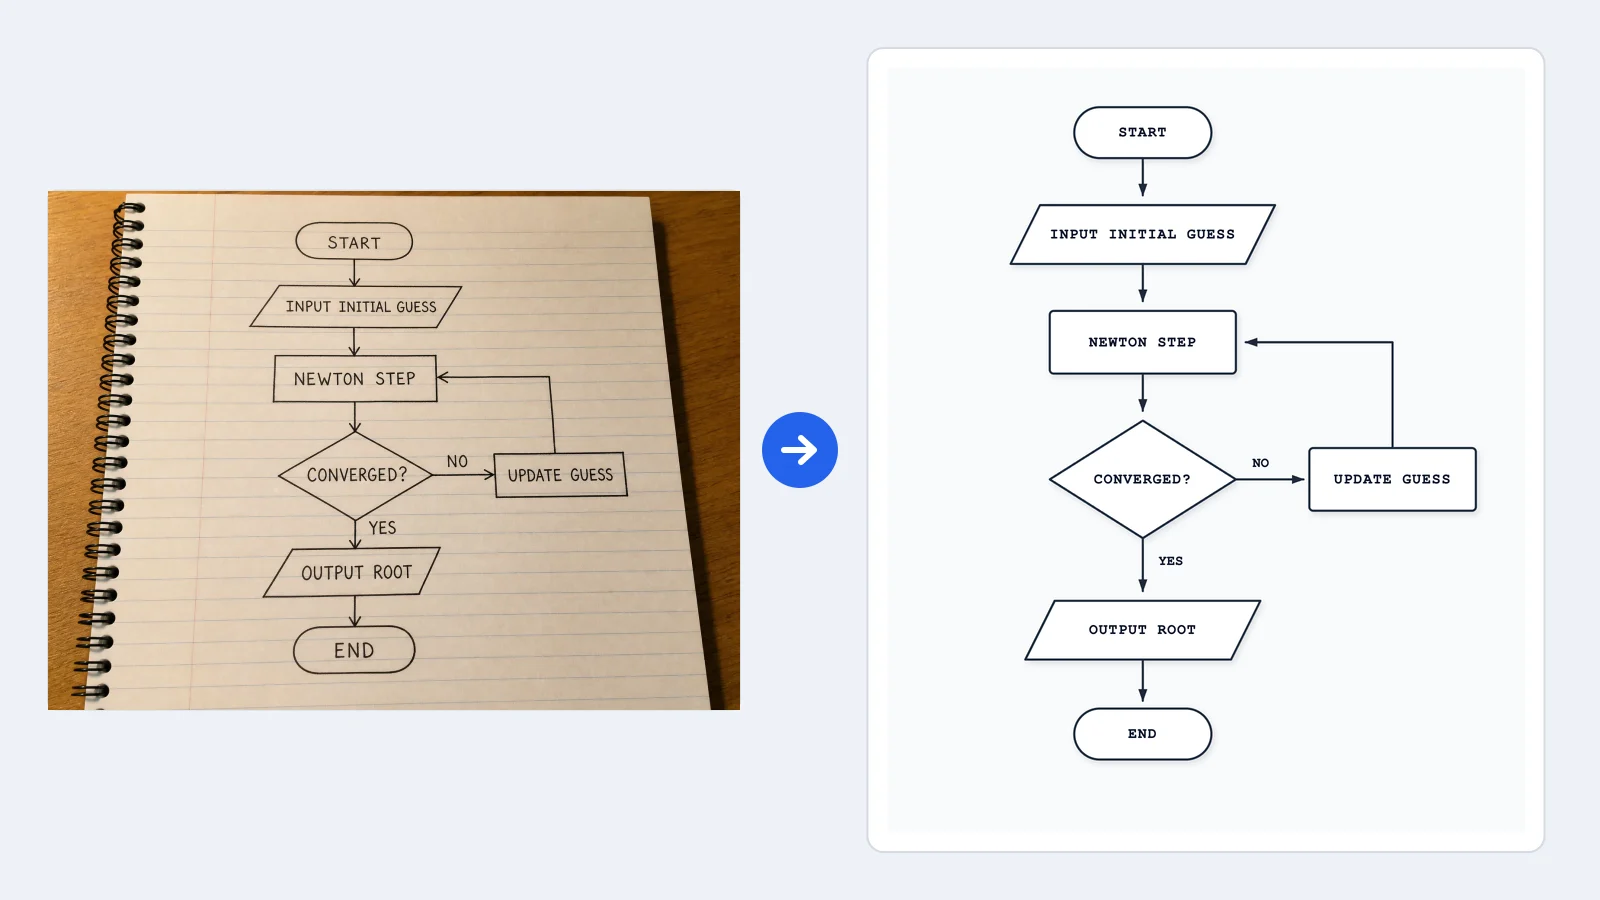
This image to flowchart AI generates a native SVG flowchart rather than a traced picture. Steps become rectangles, rounded boxes or parallelograms, questions become decision diamonds with labeled branches, and the arrows keep their direction, including loops that return to an earlier step. The whiteboard example keeps its training loop and its YES and NO exits.

  • Separate shapes for each step and decision
  • Branch labels and loop-backs kept as connectors
  • Layout follows the direction of the original
See the whiteboard example

Keep labels, counts and side branches

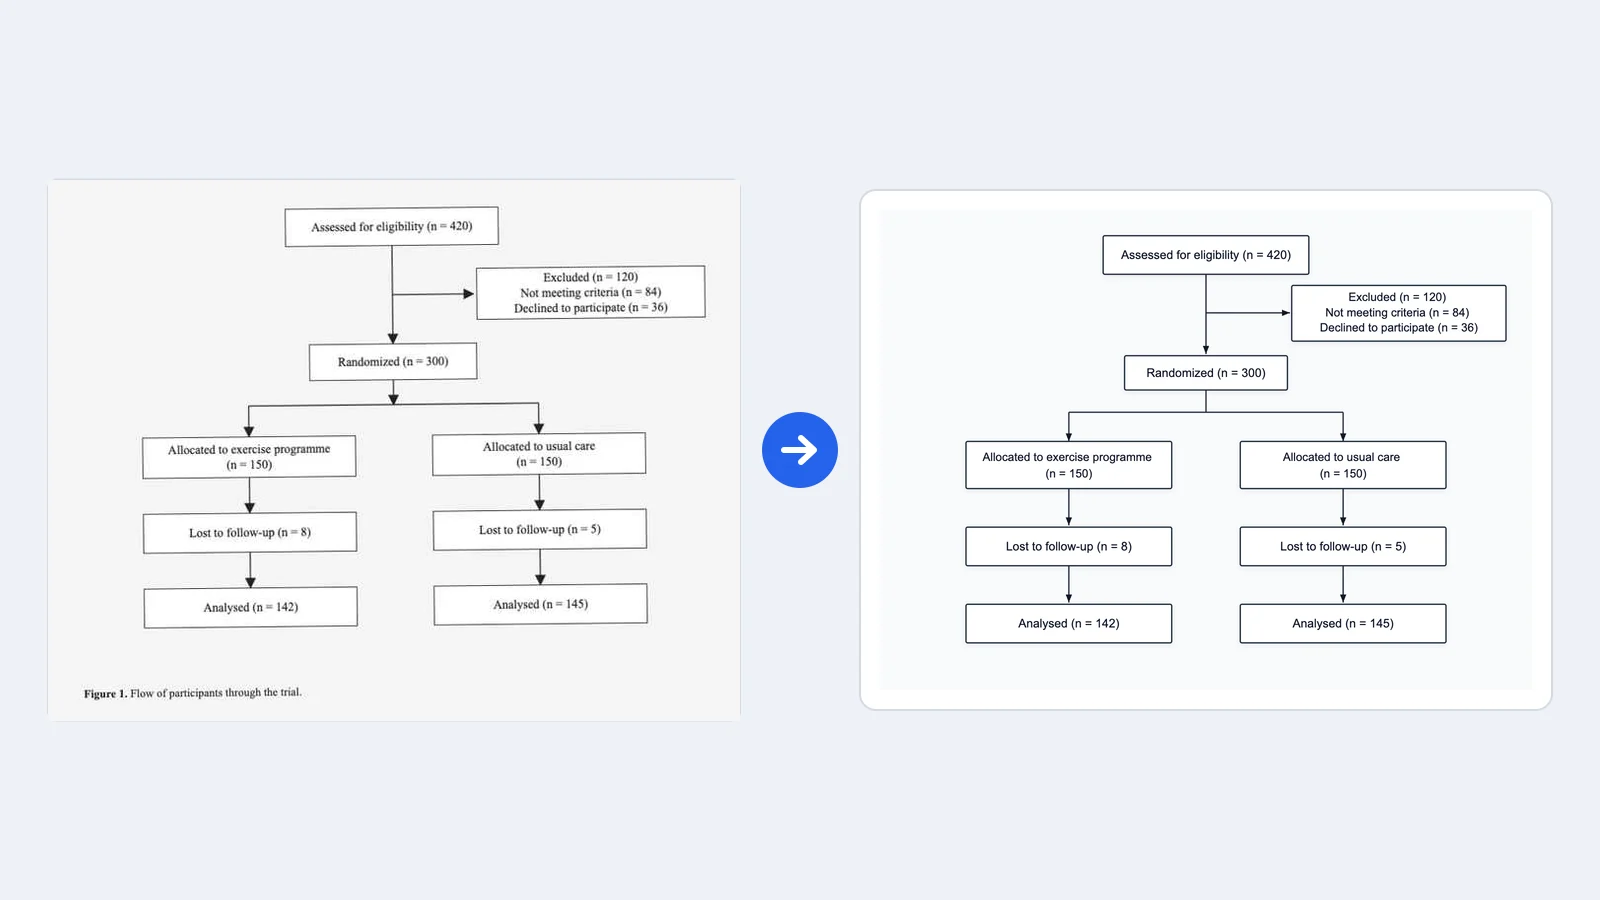
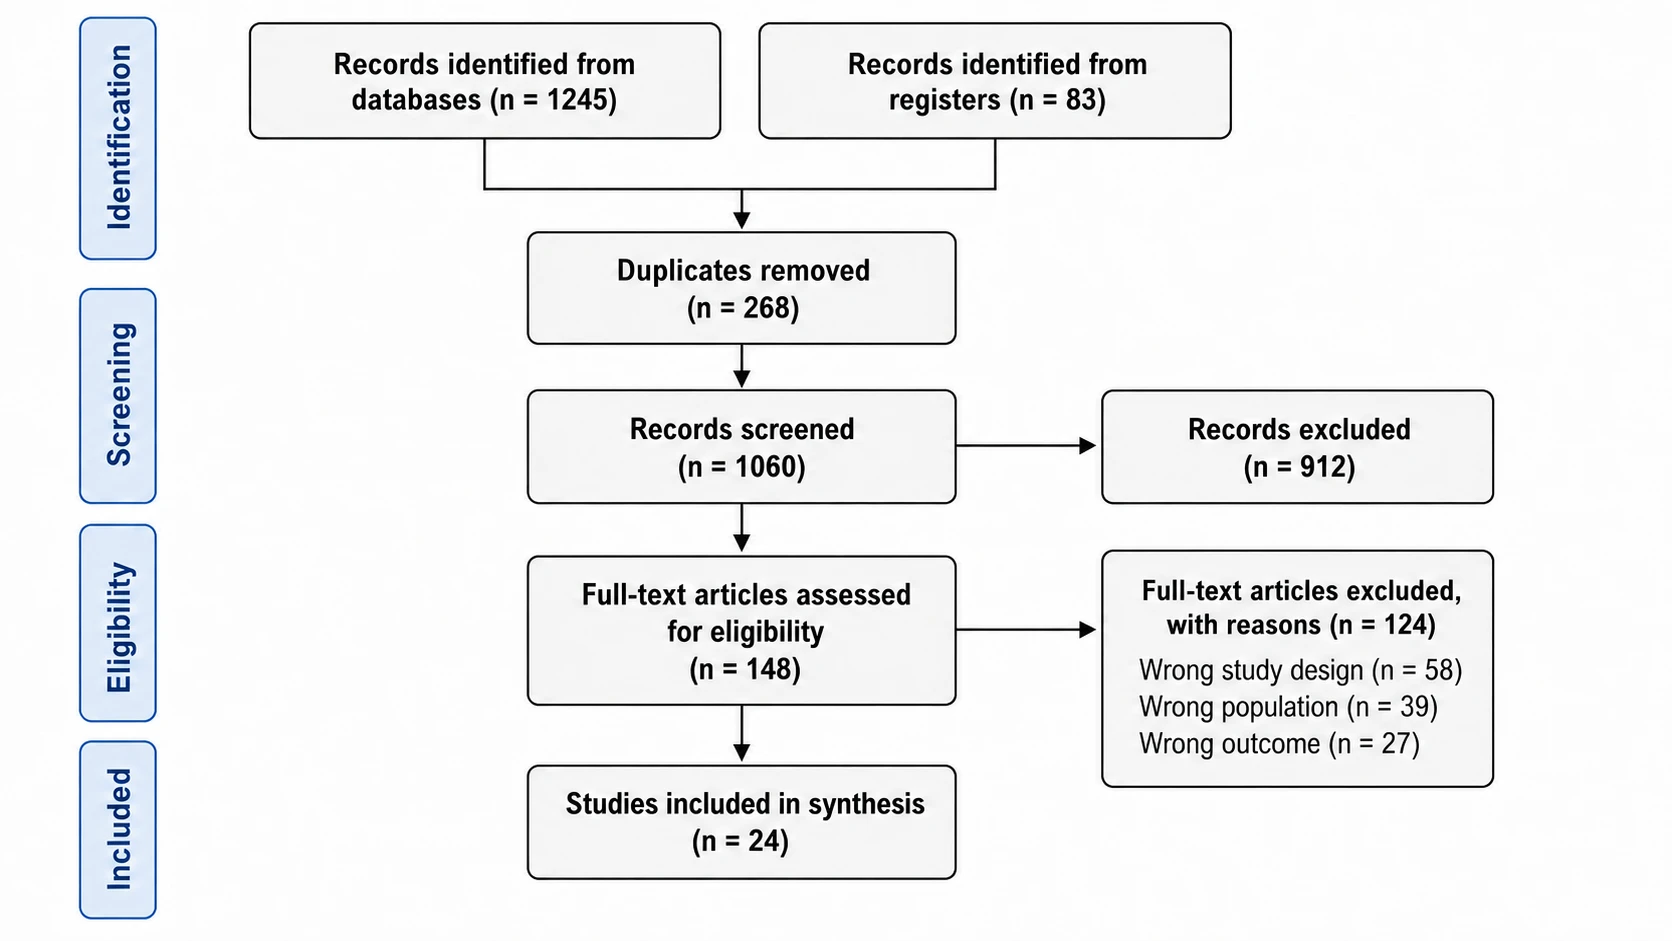
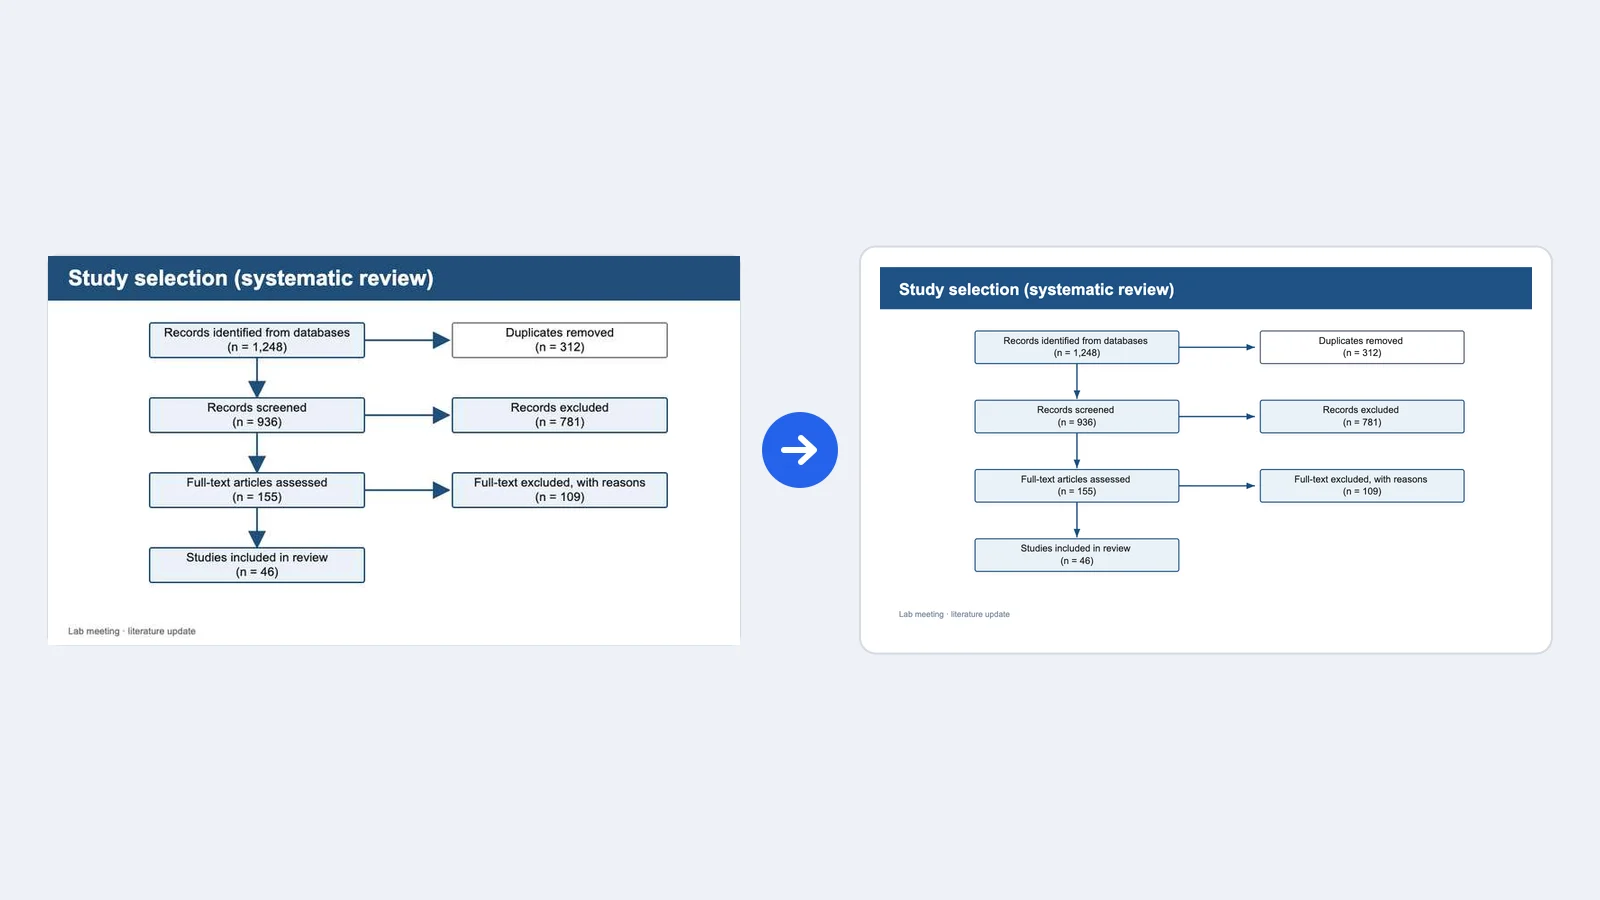
Screening and trial diagrams depend on their numbers. When you ask FlowChart to keep every label and n value, each box carries its text from the image, side boxes for exclusions stay beside the main column, and parallel arms stay side by side. The study selection example keeps all seven counts from a lab-meeting slide, ready for you to update when new records come in.

  • Box text and counts carried over
  • Exclusion boxes placed beside the main flow
  • Parallel arms kept in parallel
View the screening example

Edit the result and export it

The rebuilt diagram opens in the FlowChart editor. Retype labels, move, copy or delete nodes, insert shapes, text and connectors, and adjust position, size, rotation, colors, line styles and font sizes, with undo and redo. You can also ask for an AI revision in the conversation. When it is ready, download SVG, PNG, JPG or PPTX for a manuscript, slide deck or thesis.

  • Change any text, shape or connector
  • Ask for an AI revision in the same thread
  • Download SVG, PNG, JPG or PPTX
Try the notebook example

Image to Flowchart in Four Steps

A clear picture and a short instruction are all you need; the editing happens on the generated diagram.

  1. Prepare the image

    Crop the picture to the diagram, keep it upright and make sure the labels are legible. A photo of a whiteboard or notebook works best in even light; a screenshot of a slide or paper figure works as it is. Save it as PNG, JPG, JPEG or WebP, up to 3 MB.

  2. Attach it in FlowChart

    Upload the image in the image to flowchart converter at the top of this page. Write what the diagram shows and what to keep, for example every label and count, the YES and NO branches or the loop back to an earlier step.

  3. Generate the editable flowchart

    FlowChart reads the image and your instruction and draws a native SVG flowchart with separate nodes, labels and connectors. Compare it with the original picture and note any box, number or arrow that differs.

  4. Correct, style and export

    Fix a label or reroute a connector directly in the editor, or ask for an AI revision. Adjust colors and fonts to match your figure style, then export SVG, PNG, JPG or PPTX.

Image to Flowchart Uses in Research

Most research flowcharts start on paper, a board or an old slide. These tasks show where an editable version saves the redraw.

Pencil sketch of a blood sample protocol with a plasma check loop, next to the same flowchart rebuilt in FlowChart as editable boxes

Turn a bench protocol sketch into a methods figure

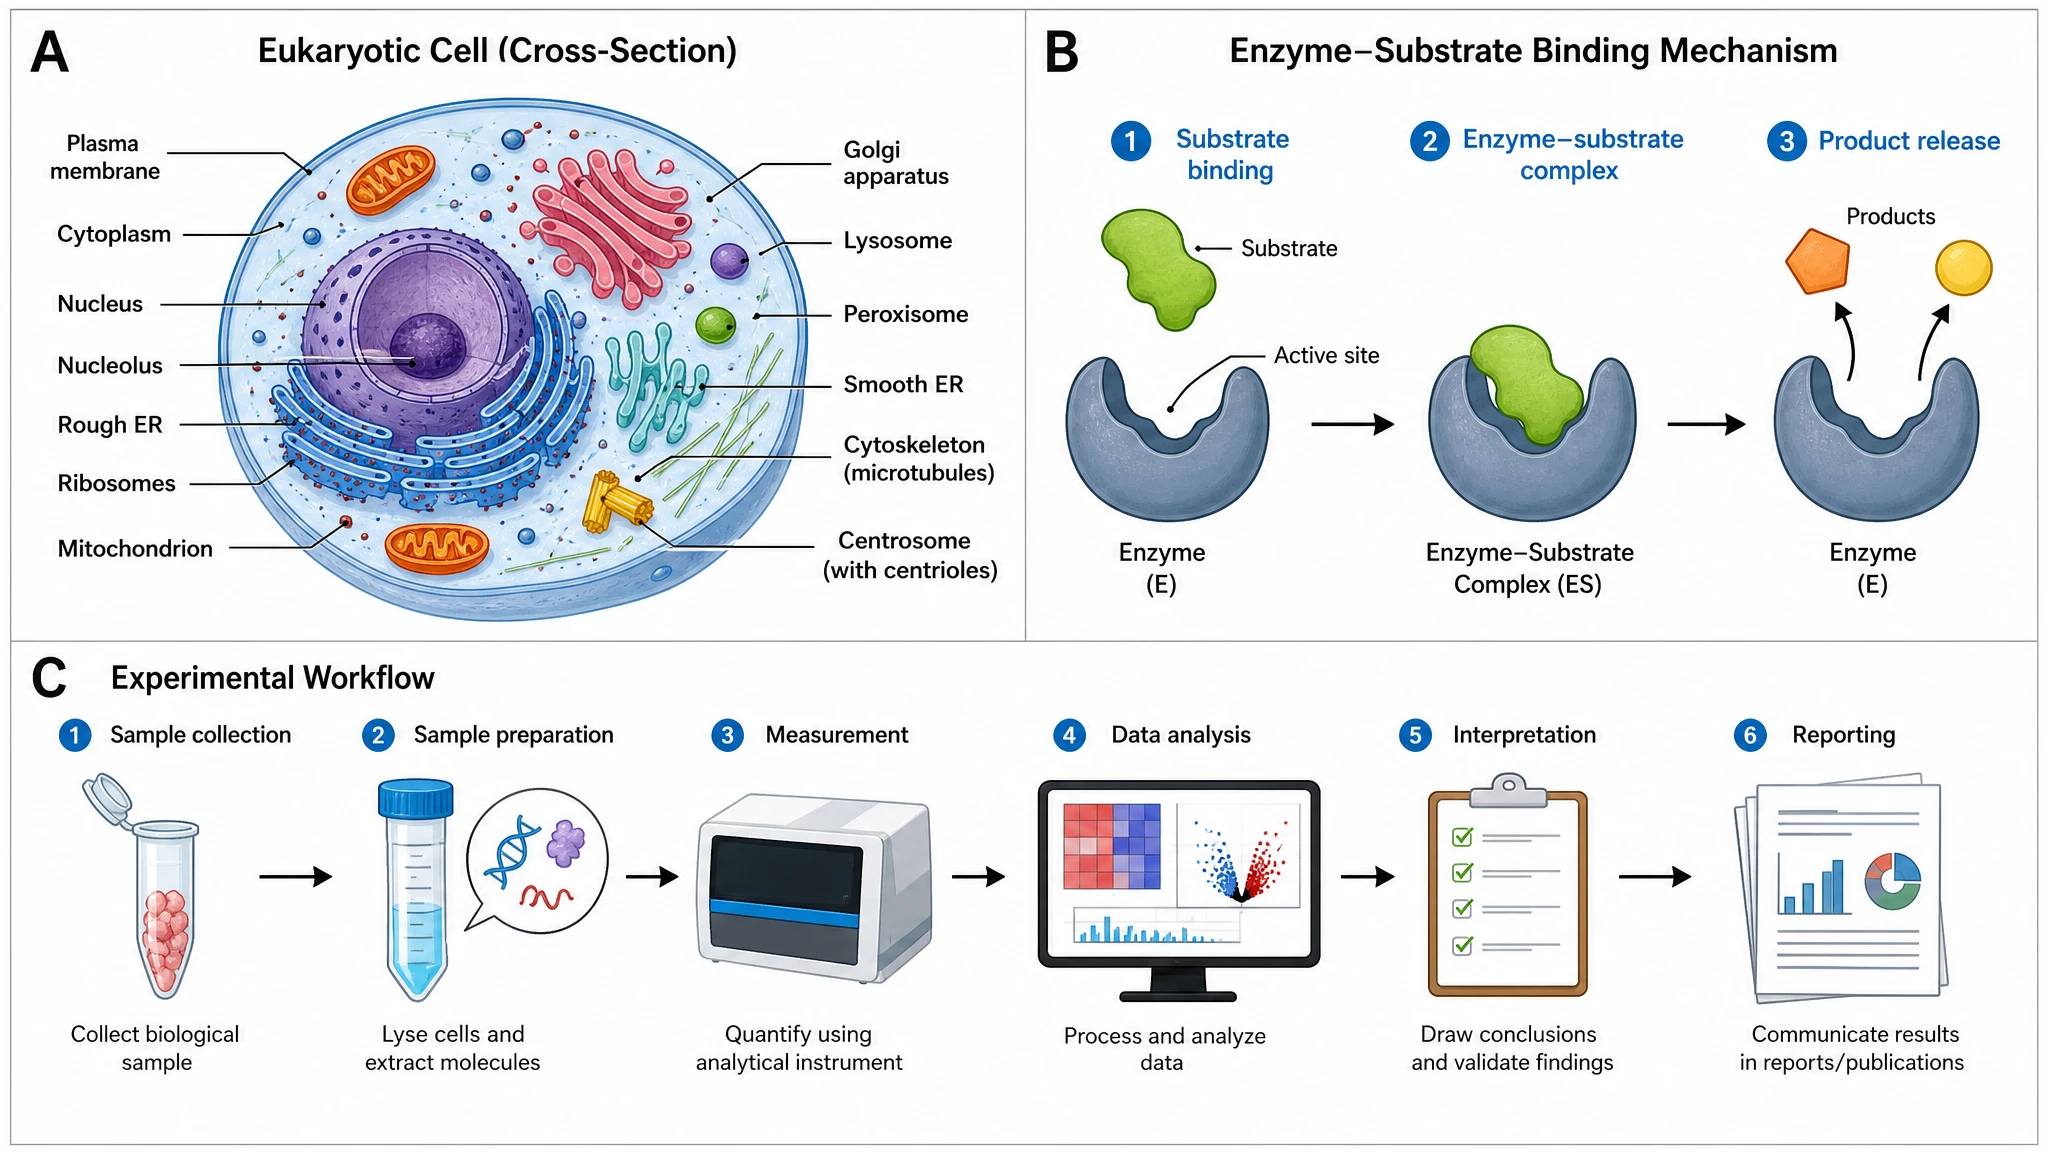
A sample-processing sketch with a quality check and a repeat step becomes a clean flowchart with the decision and its loop intact. For a workflow you would rather describe in words than upload, the experimental workflow diagram tool starts from text.

Explore this example
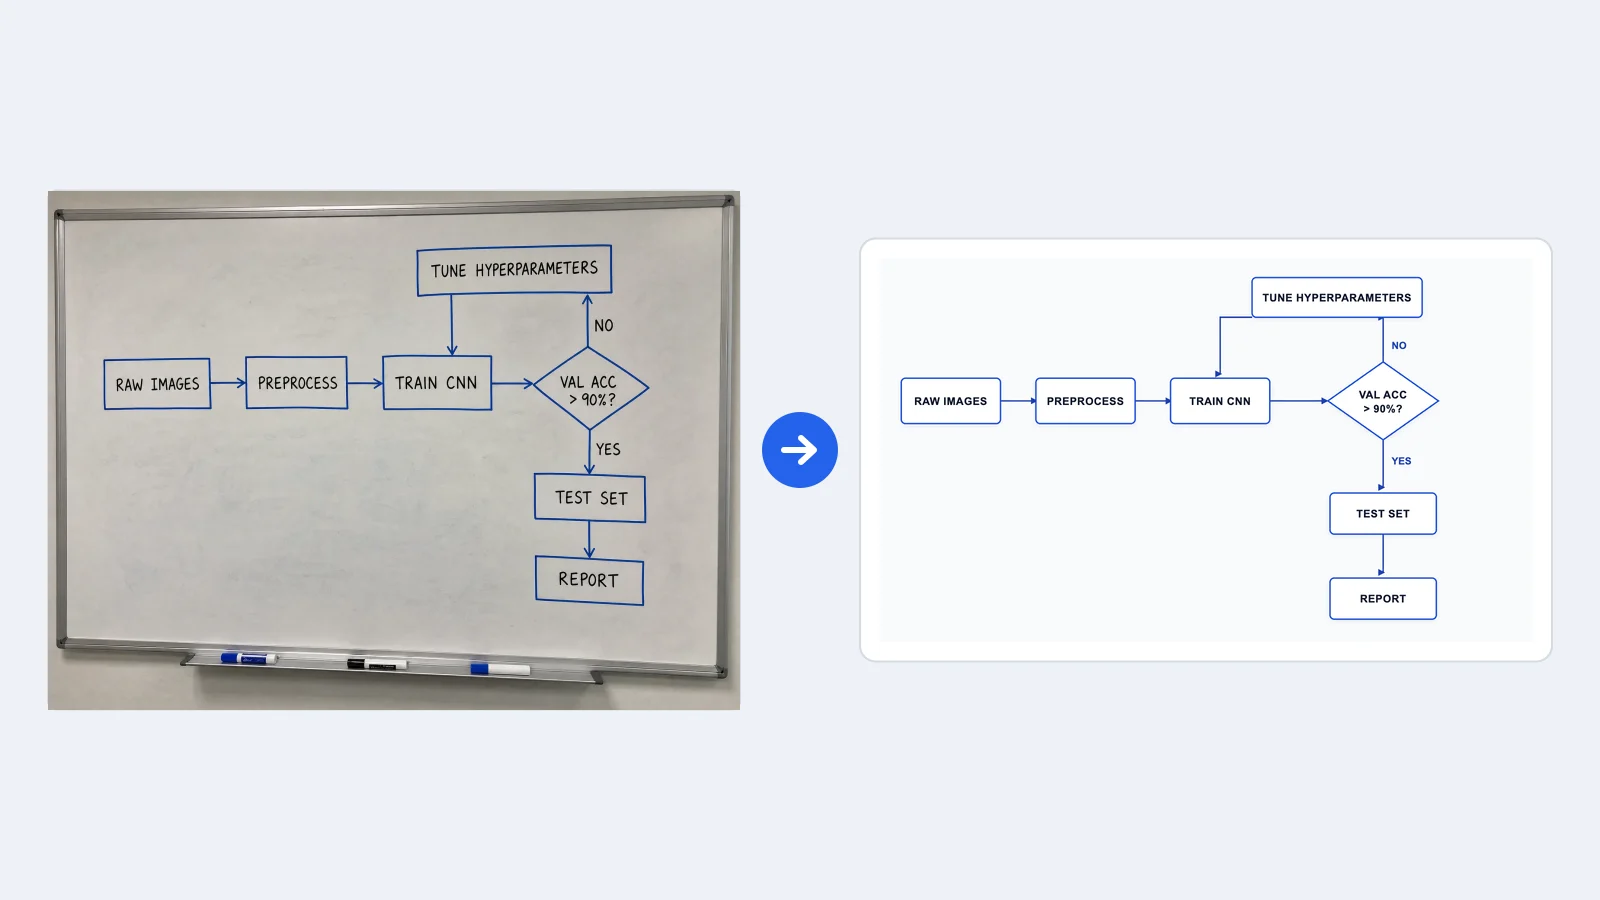
Whiteboard photo of a CNN training loop with a validation accuracy decision, next to its editable FlowChart rebuild

Digitize a whiteboard pipeline after a meeting

Photograph the board before it is wiped and rebuild the model training loop with its validation decision. When the diagram should show how data moves between stores and processes, continue with the data flow diagram generator.

Explore this example
Slide screenshot of a systematic review screening flow from 1,248 records to 46 studies, next to its editable FlowChart rebuild

Update a screening flow from an old slide

Rebuild a systematic review selection diagram from a slide screenshot, then change the counts as the search is updated. For a new diagram built from your own numbers, use the PRISMA flow diagram generator.

Explore this example
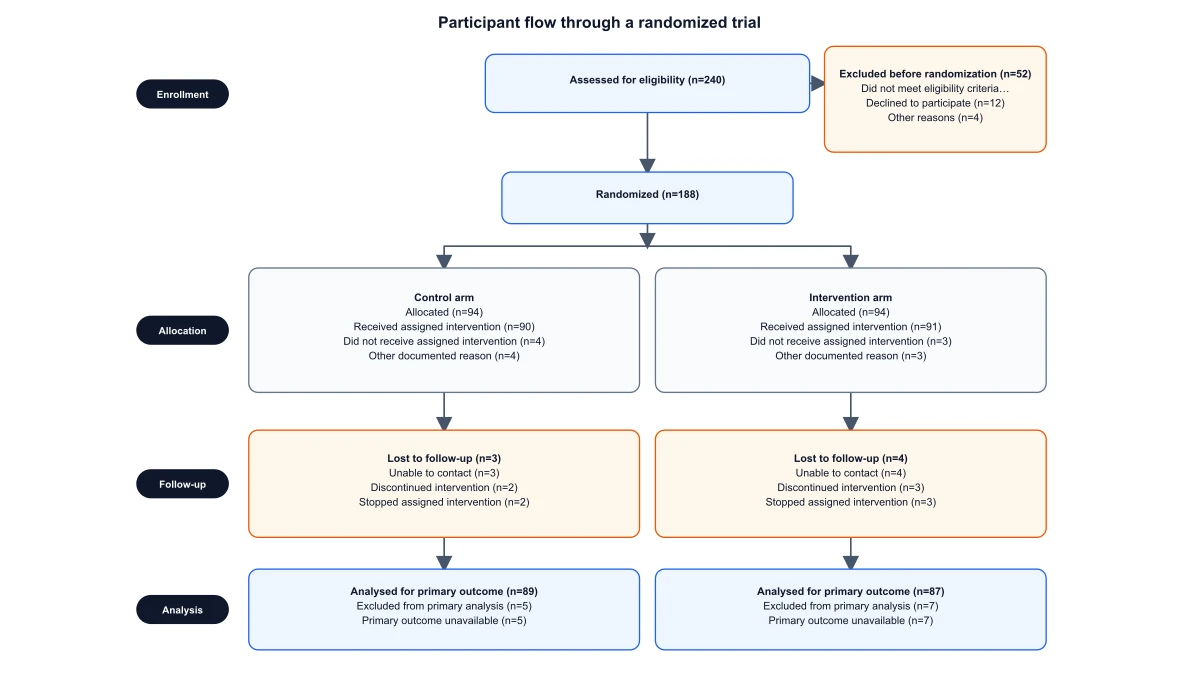
Grayscale journal figure of a two-arm trial flow from 420 assessed to 142 and 145 analysed, next to its editable FlowChart rebuild

Redraw a trial flow from a published figure

A grayscale participant flow figure from a scanned article becomes an editable diagram with both arms side by side. To enter enrollment and allocation numbers directly, the CONSORT flow diagram generator has fields for each stage.

Explore this example
Notebook sketch of a Newton iteration with a converged check and update loop, next to its editable FlowChart rebuild

Clean up an algorithm from lecture notes

An iterative method drawn in a notebook, with a convergence check and an update loop, becomes standard flowchart symbols for a thesis chapter, teaching slides or a code documentation page.

Explore this example
Slide screenshot of a systematic review screening flow from 1,248 records to 46 studies, next to its editable FlowChart rebuild

Vectorize artwork that is not a flowchart

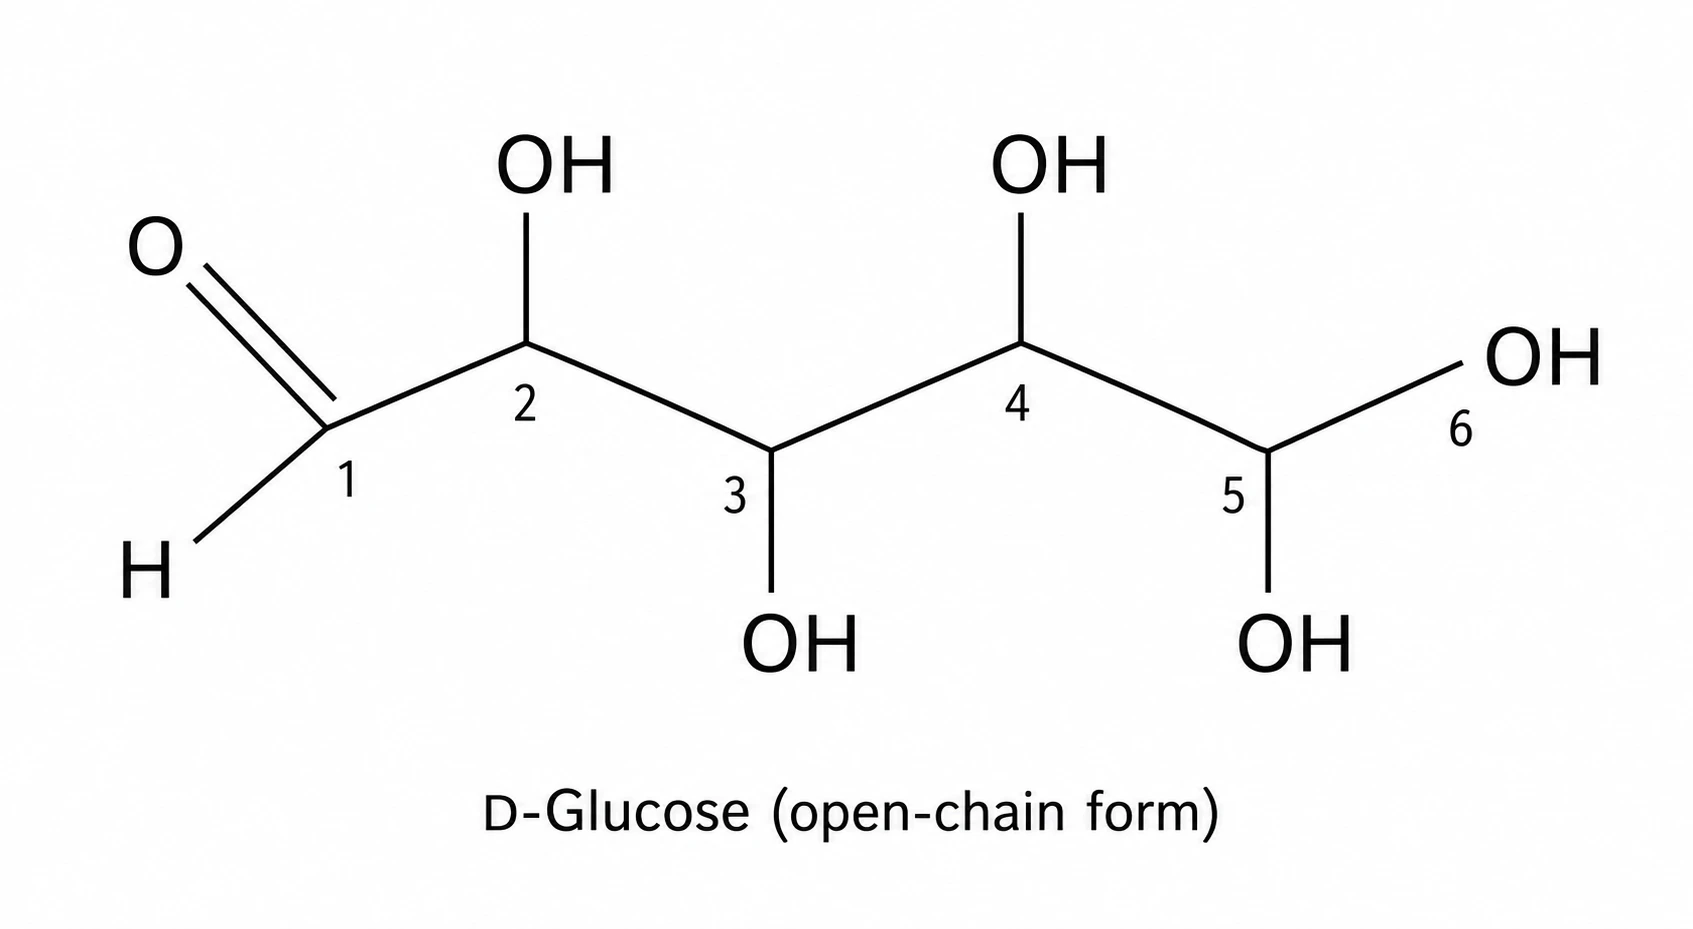
Logos, illustrations, plots and photos have no steps or arrows to rebuild. To make those scalable and editable as vector paths, use the image to SVG converter, which traces the picture as it looks.

Explore this example
Image to Flowchart Scenarios from the Lab

Examples of turning a picture of a process into a diagram that a team can keep editing.

I would photograph the pencil protocol taped above the centrifuge and use image to flowchart to get an editable version. The plasma check and the repeat spin stay in place, so the methods figure matches what we actually do at the bench.
Hannah W.

Clinical research technician

These are illustrative use scenarios with fictional names, not verified customer reviews.

Free tools

A tool for every scientific figure

87 focused generators for the scientific figure you need — each opens in the right workspace with a matching example.

Image to Flowchart Questions

1.

2.

3.

4.

5.

6.

Call to action background

Stop redrawing diagrams you already have

Image to Flowchart: Upload Your Diagram

Convert an image to a flowchart

Free to start · No credit card required · Built for researchers