Data Flow Diagram Generator
Create precise data flow diagrams showing processes, data stores, external entities, and data flows — describe your system and generate a publication-ready DFD in seconds.
Figure prompt
Core Subject (e.g., Cas9 protein cutting DNA)
Action / Details (e.g., Double strand break, detailed molecular view)
Start with 100 free credits|No credit card required
Get up to 300 free credits on day one when you join through an invite.
Reviewed by SciFig TeamUpdated
Data Flow Diagram Generator— templates & examples
Everything you need to generate a data flow diagram
Generate a data flow diagram from a system description
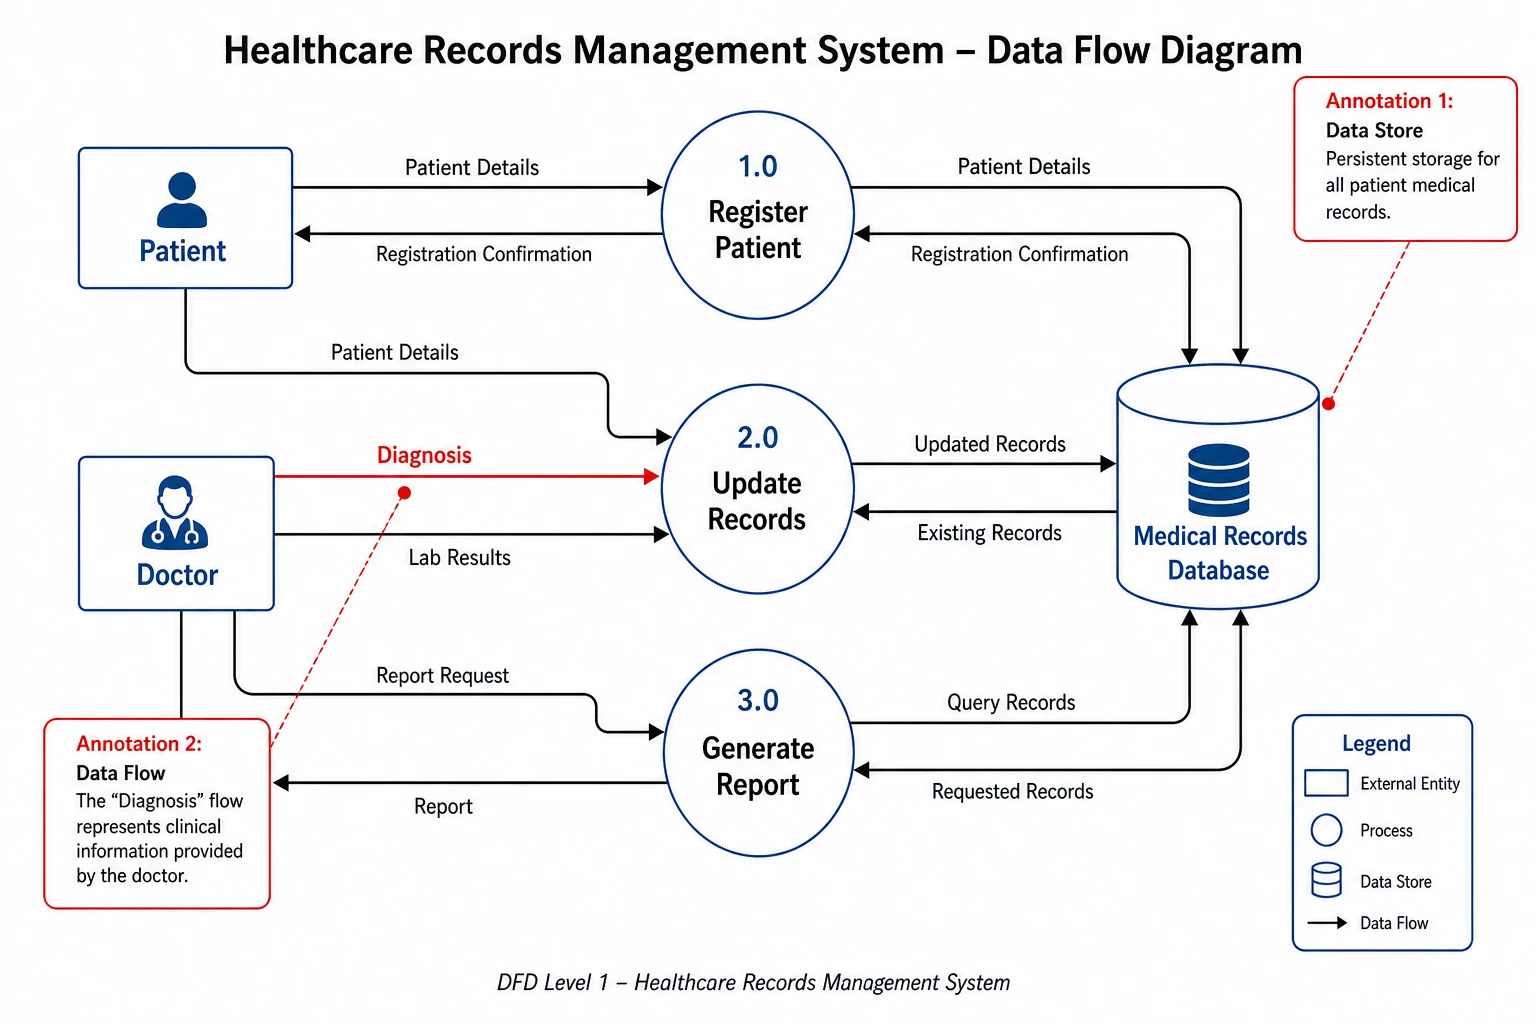
A correct data flow diagram must follow strict notation rules — processes transform data, data stores hold it, external entities supply or receive it, and every arrow is labeled with the data it carries. SciFig's data flow diagram generator enforces these rules automatically. Describe your system's inputs, processes, stores, and outputs in plain language and receive a properly structured DFD in seconds — no symbol libraries, no manual layout, just an accurate data flow diagram ready for documentation or publication.
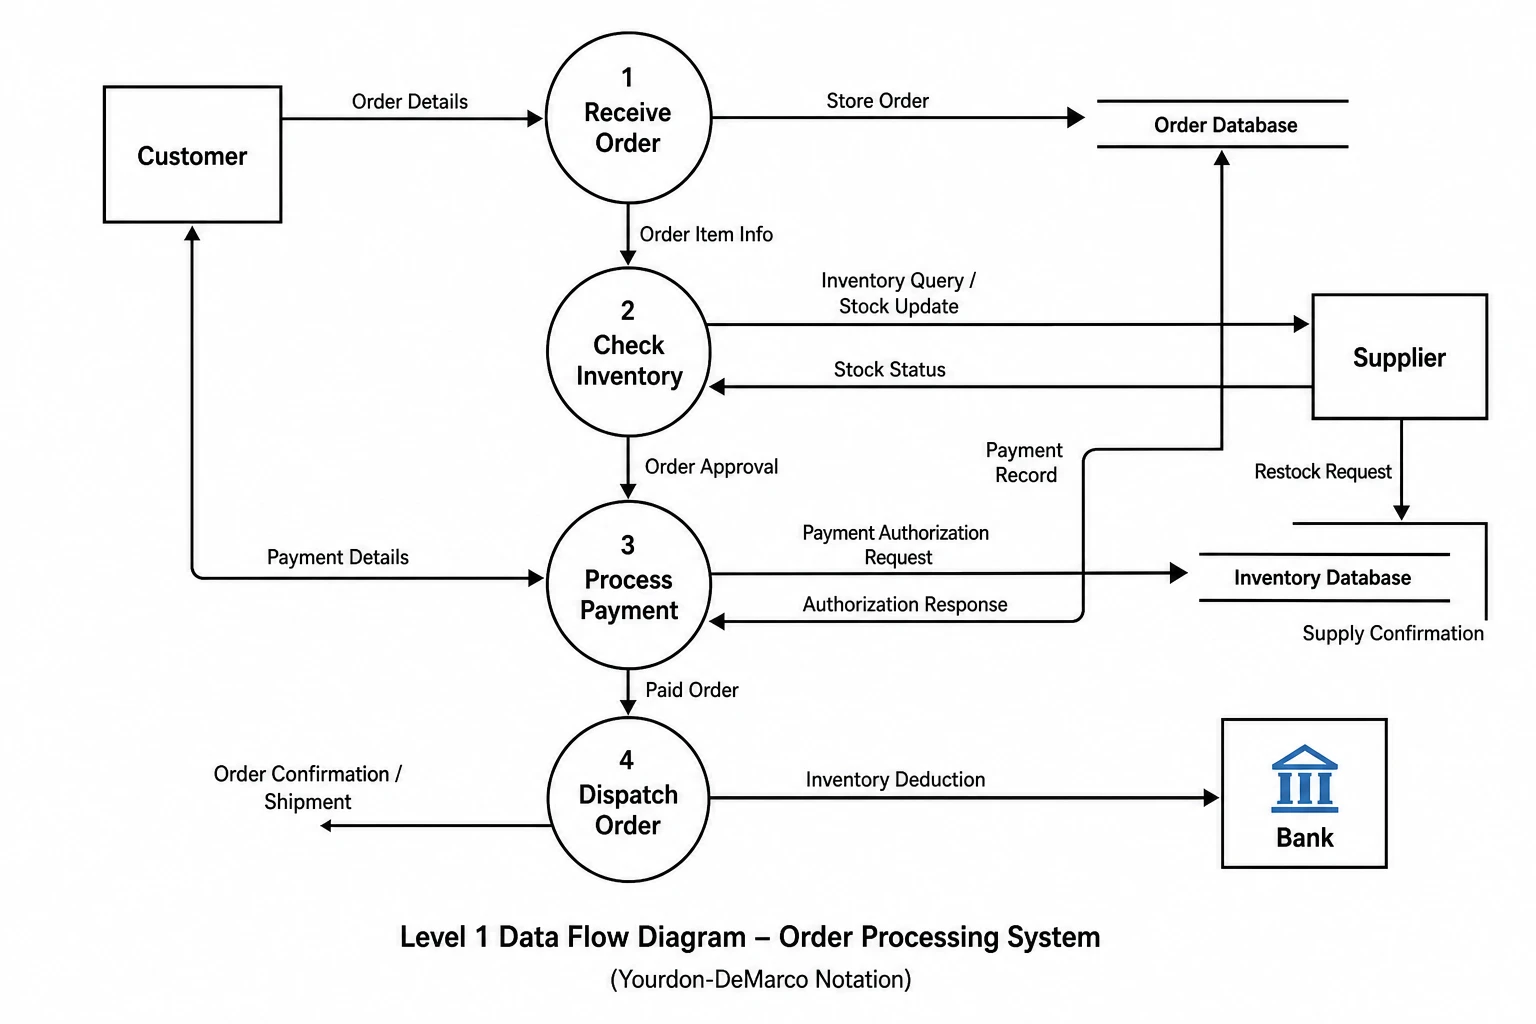
Create Level 0 and Level 1 DFD diagrams with a DFD diagram maker
Context diagrams and decomposed Level 1 DFDs serve different analytical purposes — one shows system boundaries, the other shows internal data flows. SciFig's DFD diagram maker generates both. Describe your system at the boundary level for a Level 0 context diagram, then describe the internal processes for a Level 1 data flow diagram with data stores and inter-process flows. Each data flow diagram generator output uses the correct symbols and labeling conventions expected in systems analysis documentation.
Export editable DFD figures for any format
Whether your data flow diagram appears in a university assignment, a research paper, or a system requirements document, SciFig produces publication-ready outputs you can export at any resolution. Rename processes, relabel data flow arrows, add or remove data stores, and adjust the layout — then download the DFD diagram maker output as a high-resolution image or editable file for immediate use.
What is a data flow diagram?
A data flow diagram (DFD) maps how data moves through a system — from external entities through processes and into data stores. Unlike flowcharts, a data flow diagram focuses on information: what enters, which processes transform it, and where it is stored. With SciFig's data flow diagram generator you describe your system and receive a correctly structured DFD using standard Yourdon-DeMarco notation — ready for coursework, research papers, or system requirements documentation.
Why you need a data flow diagram for your system
- Provides a clear map of how data enters, is transformed, and leaves a system
- Exposes missing data stores, undefined data flows, and process gaps early in design
- Required by structured systems analysis methodologies and many university programs
- Helps stakeholders understand system data without reading code or technical specifications
- Supports requirements traceability from external inputs to system outputs
- Forms the basis for data security analysis and GDPR data-mapping documentation
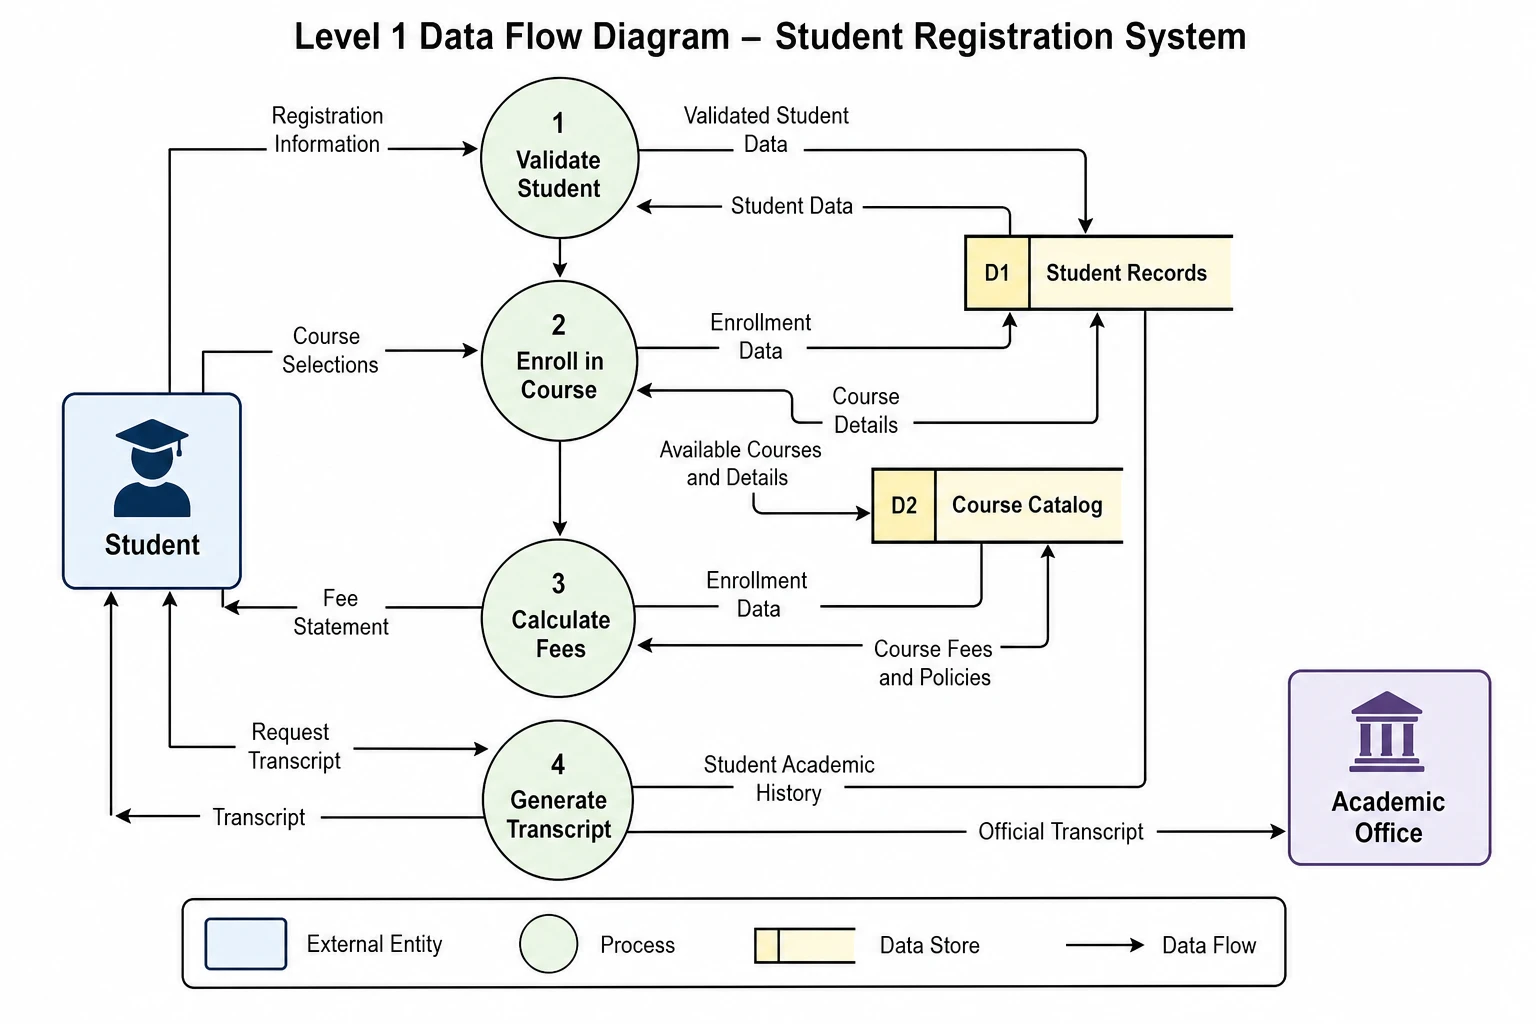
Key components of a data flow diagram
- External entities — rectangles representing sources or sinks of data outside the system
- Processes — circles or rounded rectangles labeled with verbs describing transformations
- Data stores — parallel lines representing where data is held at rest, labeled as nouns
- Data flows — labeled arrows showing the data moving between entities, processes, and stores
- Level 0 context diagram — the entire system as a single process with all external entities
- Level 1 decomposition — internal processes and data stores with inter-process flows
Where data flow diagrams are used
- Software engineering requirements analysis and system design documentation
- Information systems courses and structured systems analysis (SAD) curricula
- Academic research papers on information system architecture and data governance
- Data security reviews and GDPR data-mapping exercises
- Business process analysis for ERP implementations and digital transformation projects
- Technical documentation for government and enterprise information systems
How to make a data flow diagram
Describe your data flow diagram
Tell SciFig what to draw in plain language — no design tools required.
Generate with SciFig
Get a clean, publication-ready figure that matches your description in seconds.
Edit & export
Vectorize it into editable SVG, relabel everything, and export for your paper, poster, or slides.
Data Flow Diagram Generator — Frequently Asked Questions
Common questions about Data Flow Diagram Generator.
More tools

Conceptual Framework Generator
Create professional conceptual framework diagrams showing variable relationships, hypotheses, and theoretical models for your research.

Free Body Diagram Generator
Create accurate, publication-ready free body diagrams with labeled force vectors for weight, normal force, friction, and tension in seconds.

Bell Curve Generator
Generate a precise, fully labeled bell curve showing mean, standard deviations, and percentile regions — ready to export for your paper, thesis, or classroom.
Related links
Home
Turn text, sketches, references, PDFs, and photos into Scientific Figures
Text-to-Figure
Generate a figure from a plain-language description
Models
Default to GPT Image 2 for journal papers; switch to Nano Banana Pro for slides and posters; pick Nano Banana 2 for routine figure work
Tutorials
Seven short walkthroughs of the AI scientific figure generator
Blog
Tutorials, tool comparisons, and publication tips for researchers.
Inspiration
Explore publication-ready scientific figure examples, copy the prompts, and use them as starting points for your own work.

Ready to publish?
Make your own data flow diagram in minutes.
Start for freeFree to start · No credit card required · Built for researchers