Org Chart Maker
Turn any team list or text description into a polished org chart — editable, export-ready, and built for reports, presentations, and publications.
Figure prompt
Core Subject (e.g., Cas9 protein cutting DNA)
Action / Details (e.g., Double strand break, detailed molecular view)
Start with 100 free credits|No credit card required
Get up to 300 free credits on day one when you join through an invite.
Reviewed by SciFig TeamUpdated
Org Chart Maker— templates & examples
Everything you need to build your org chart
Generate an org chart from any list or description
Paste a list of names and roles or write a plain-language description of your team structure, and SciFig's org chart maker converts it into a labeled hierarchy diagram instantly. Type a prompt as short as “generate organizational chart from list”, paste the roster beneath it, and you have a first draft. This text to hierarchy chart online workflow eliminates manual layout work — you get a clean organizational chart the moment you describe your team.
Edit every node, level, and connection
Every org chart generated by SciFig is fully editable. Rename roles, add or remove nodes, adjust reporting lines, and recolor branches to match your institution's style guide — then export a publication-ready organizational chart for any report, grant application, or presentation.
Start from a template for common team structures
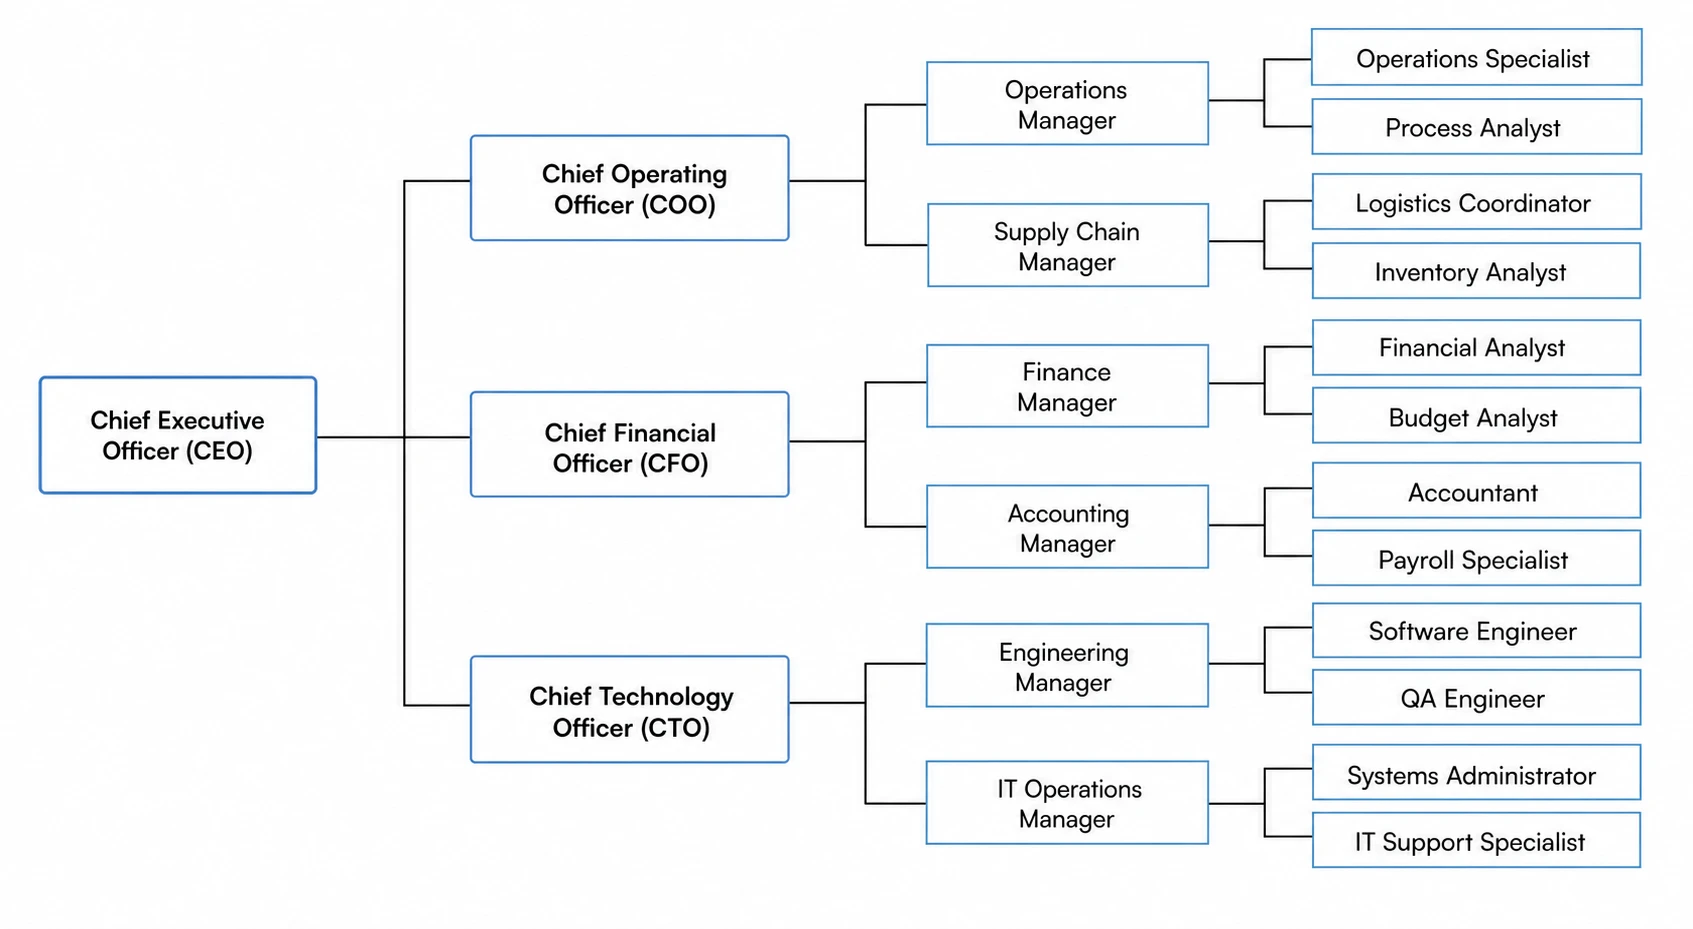
Choose a pre-built org chart template for a flat team, a two-tier lab group, a departmental hierarchy, or a matrix structure, then customize names and titles. Whether you need to generate an organizational chart from a list of a dozen people or a complex multi-division structure, SciFig scales to your team.
What is an org chart?
An org chart (organizational chart) is a diagram that maps the reporting structure, roles, and relationships within a team or organization, showing who reports to whom and how responsibilities are distributed. Org charts are used in grant applications, institutional reports, and onboarding documentation. With SciFig's org chart maker you describe your team structure or paste a list of names and titles and receive a clean, labeled hierarchy diagram ready to edit and export.
Why you need a clear org chart
- Shows every team member's role and reporting relationship at a glance
- Required by many grant applications and institutional reports
- Speeds up onboarding by giving new members a map of the team
- Clarifies decision-making paths and accountability across projects
- Supports accreditation reviews, audits, and compliance documentation
- Makes large or complex team structures easy to communicate to external stakeholders
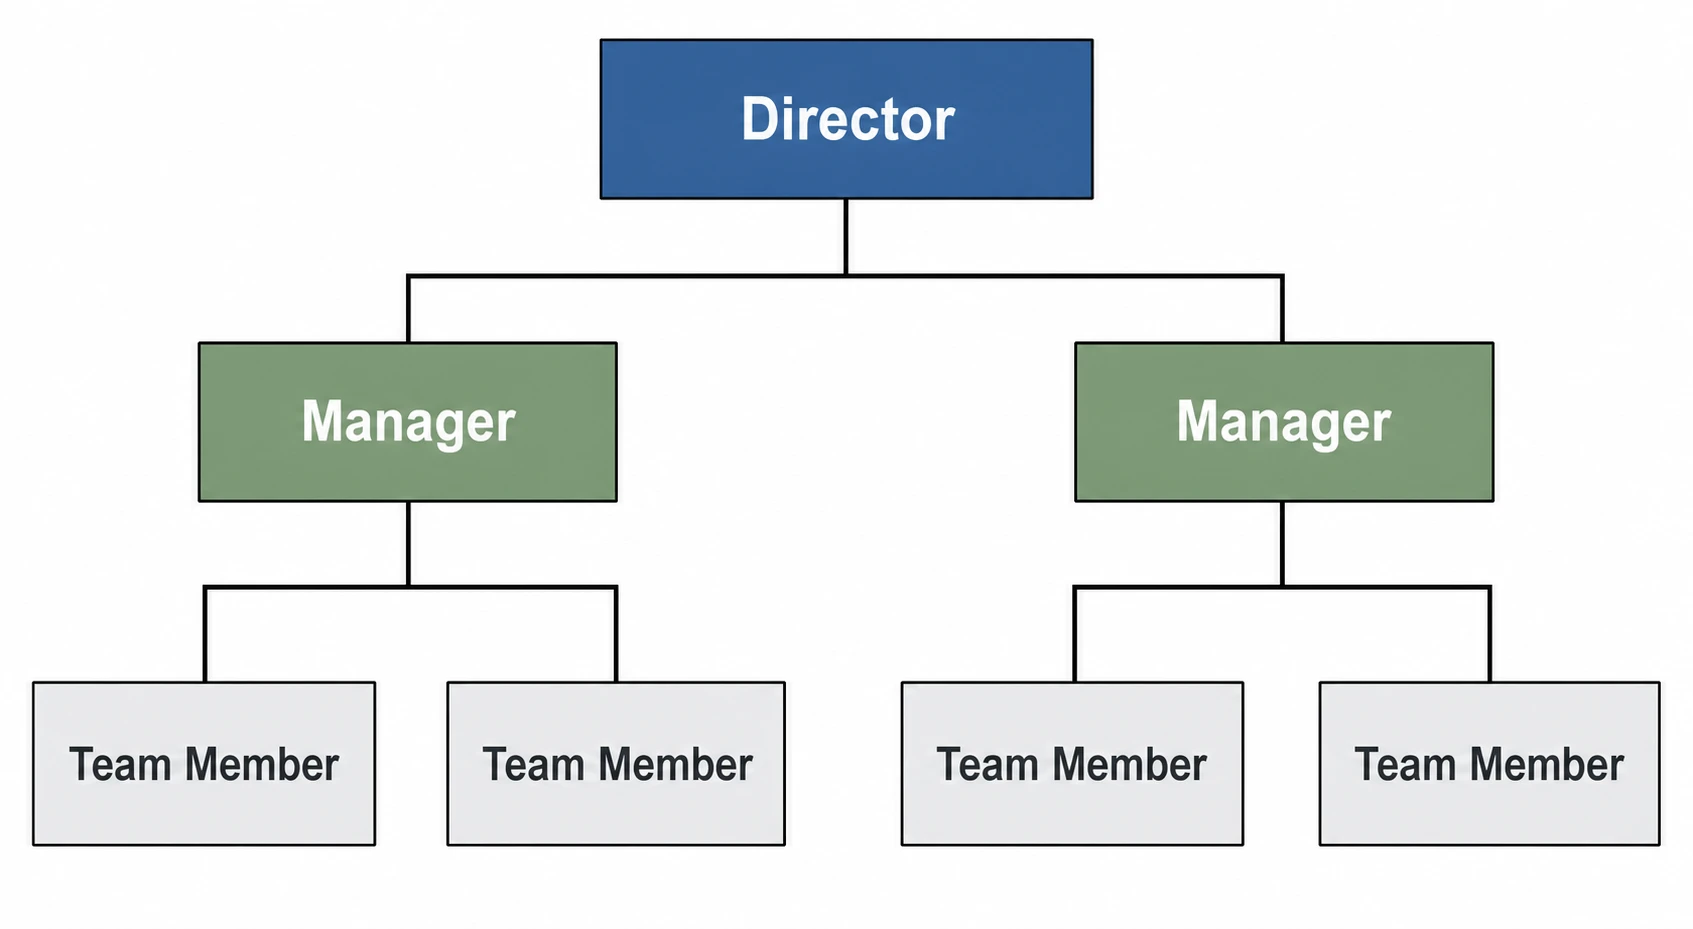
Key components of an org chart
- Root node — the top-level role (PI, Director, CEO, Department Head)
- Hierarchy levels — tiers of reporting that branch downward from the root
- Role boxes — labeled nodes showing each person's title and name
- Reporting lines — connectors that show who reports to whom
- Lateral links — dashed lines for cross-functional or advisory relationships
- Grouping brackets — visual containers for teams, units, or divisions
Where org charts are used
- Research lab group diagrams for grant applications and lab websites
- Departmental structure charts for accreditation and institutional review
- Company organizational charts for investor decks and annual reports
- Project team hierarchies for multi-institution collaborations
- Course or program administration charts for academic catalogs
- Onboarding documentation for new hires and student researchers
How to make an org chart
Describe your org chart
Tell SciFig what to draw in plain language — no design tools required.
Generate with SciFig
Get a clean, publication-ready figure that matches your description in seconds.
Edit & export
Vectorize it into editable SVG, relabel everything, and export for your paper, poster, or slides.
Org Chart Maker — Frequently Asked Questions
Common questions about Org Chart Maker.
More tools

Conceptual Framework Generator
Create professional conceptual framework diagrams showing variable relationships, hypotheses, and theoretical models for your research.

Free Body Diagram Generator
Create accurate, publication-ready free body diagrams with labeled force vectors for weight, normal force, friction, and tension in seconds.

Bell Curve Generator
Generate a precise, fully labeled bell curve showing mean, standard deviations, and percentile regions — ready to export for your paper, thesis, or classroom.
Related links
Home
Turn text, sketches, references, PDFs, and photos into Scientific Figures
Text-to-Figure
Generate a figure from a plain-language description
Models
Default to GPT Image 2 for journal papers; switch to Nano Banana Pro for slides and posters; pick Nano Banana 2 for routine figure work
Tutorials
Seven short walkthroughs of the AI scientific figure generator
Blog
Tutorials, tool comparisons, and publication tips for researchers.
Inspiration
Explore publication-ready scientific figure examples, copy the prompts, and use them as starting points for your own work.

Ready to publish?
Make your own org chart in minutes.
Start for freeFree to start · No credit card required · Built for researchers