Water Cycle Diagram Generator
Generate clear water cycle diagram figures showing evaporation, condensation, precipitation, and collection — labeled or unlabeled for class, research, or publication.
Figure prompt
Core Subject (e.g., Cas9 protein cutting DNA)
Action / Details (e.g., Double strand break, detailed molecular view)
Start with 100 free credits|No credit card required
Get up to 300 free credits on day one when you join through an invite.
Reviewed by SciFig TeamUpdated
Water Cycle Diagram Generator— templates & examples
Everything you need to create water cycle diagrams for any audience
Generate labeled or unlabeled water cycle diagrams instantly
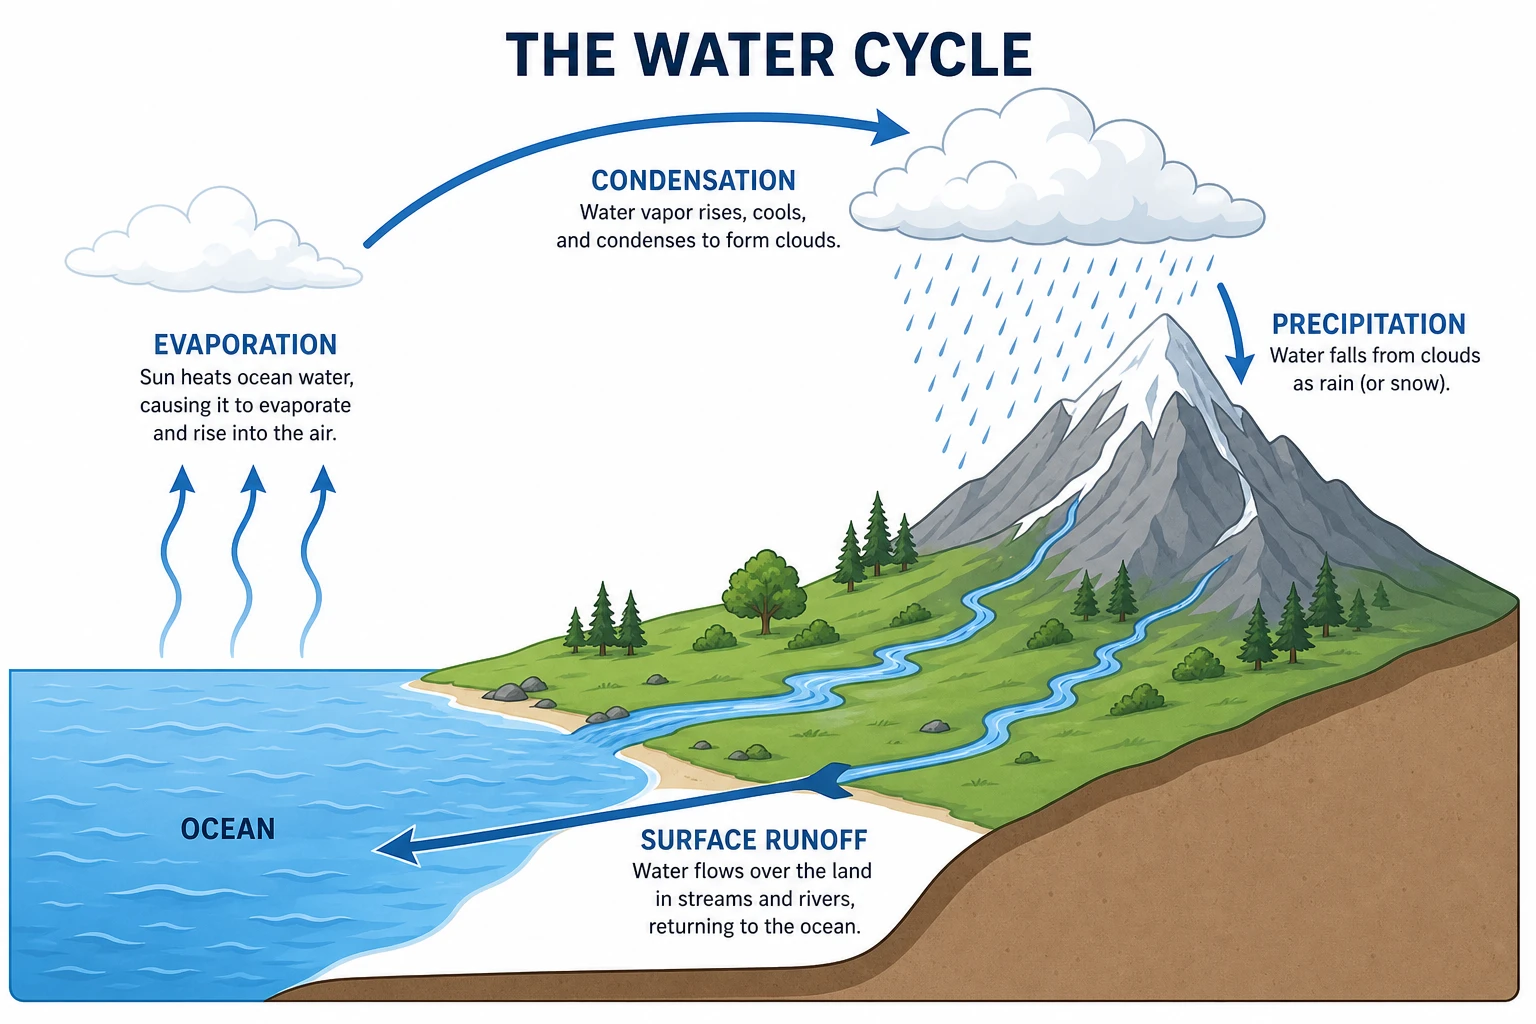
A clear water cycle diagram needs accurate stage labels and directional arrows to communicate the hydrological cycle correctly. SciFig's water cycle diagram generator produces fully labeled versions with every process annotated — evaporation, condensation, precipitation, runoff, infiltration, transpiration — or clean unlabeled water cycle templates for classroom worksheets, with the same underlying accuracy in both.
Customize landscape cross-sections and highlighted stages
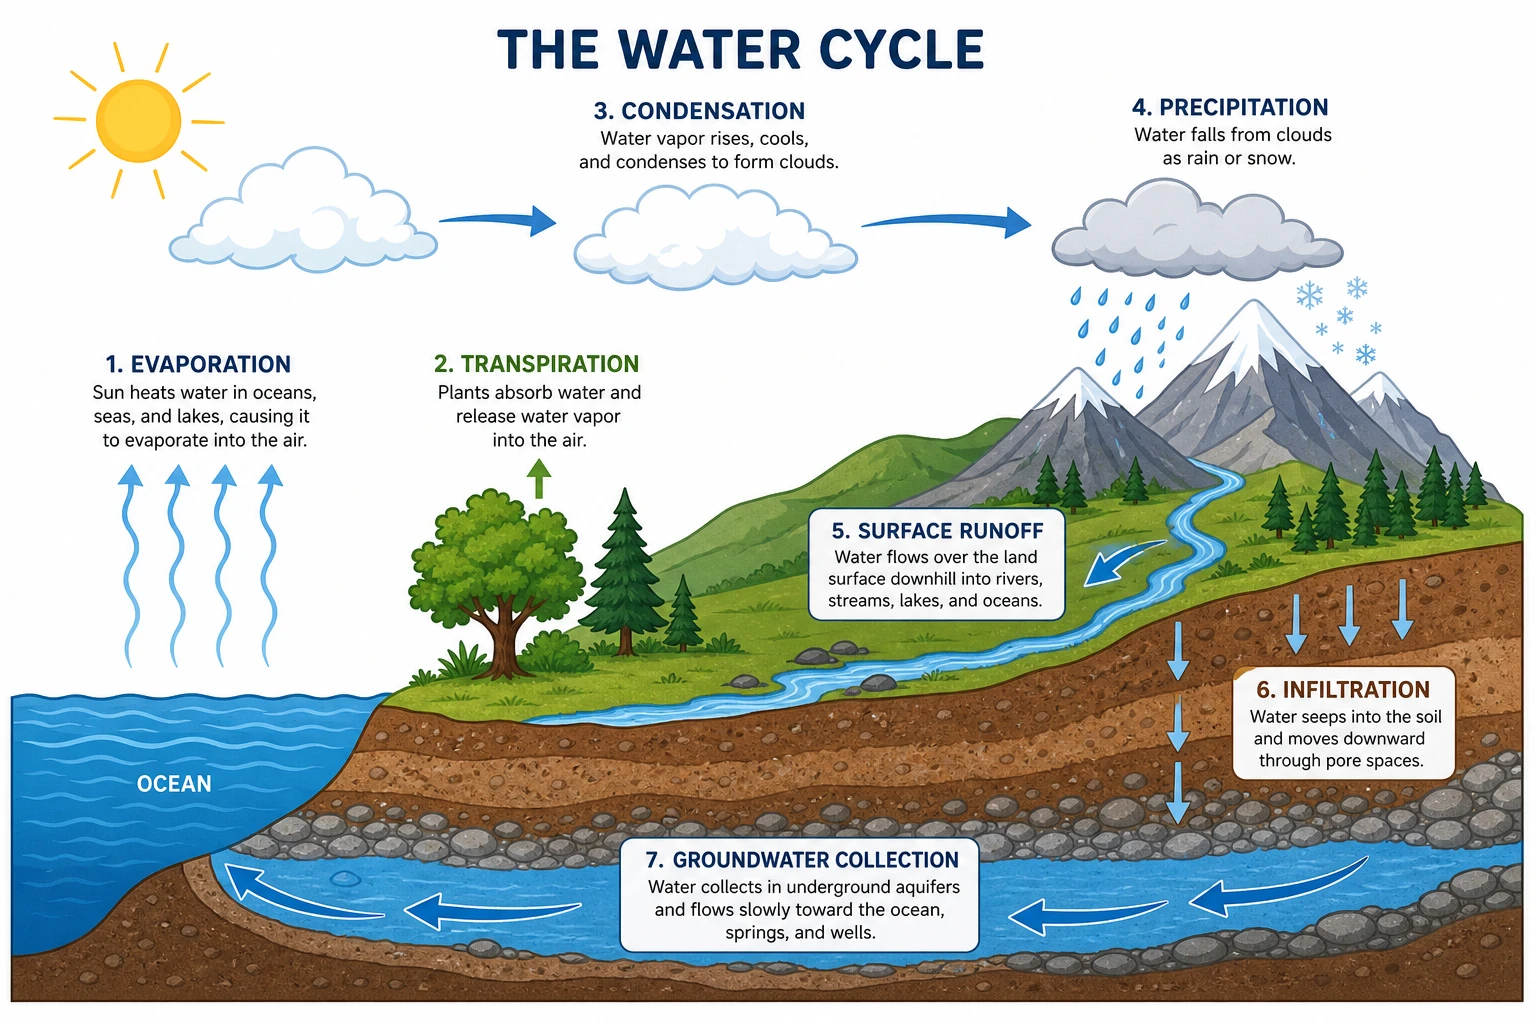
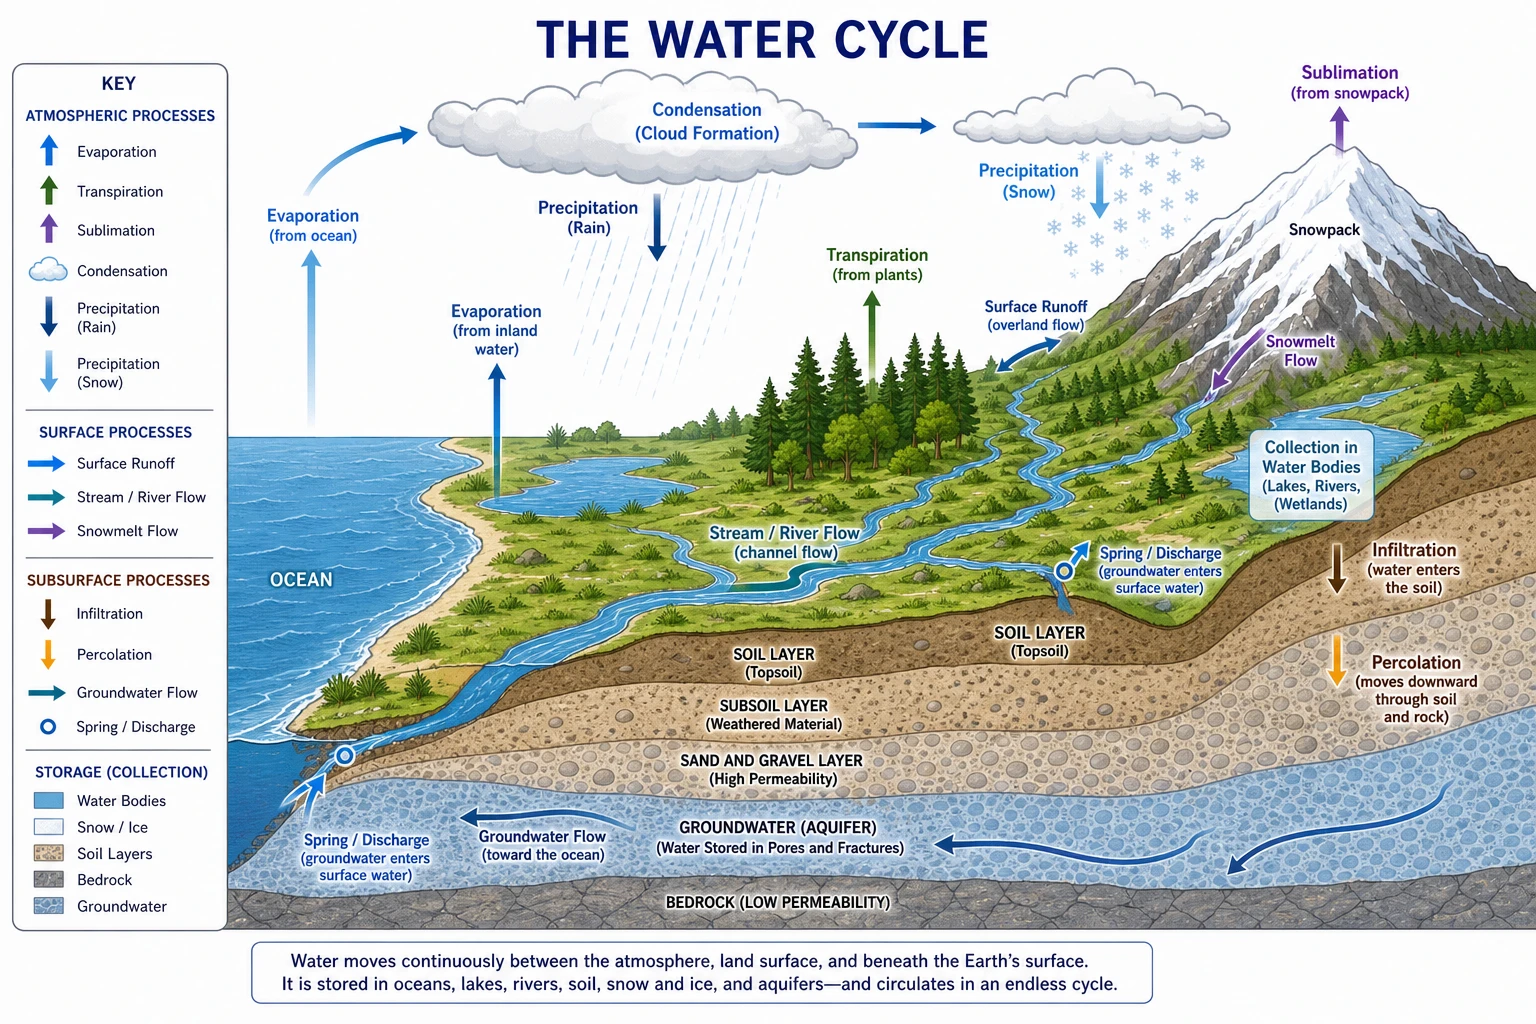
Water cycle diagrams serve different purposes depending on the audience. SciFig's water cycle clear diagram tool lets you emphasize specific stages — such as the condensation-to-precipitation pathway for a meteorology lesson — or generate a comprehensive diagram showing every process from solar-driven evaporation through groundwater collection. Adjust the landscape to show mountains, plains, or coastal environments.
Export water cycle figures for K-12, university, and publication use
Whether you need a simple water cycle diagram for a middle-school worksheet or a detailed hydrological cycle figure for a scientific report, SciFig exports clean, high-resolution water cycle diagrams ready for any format. Edit labels, adjust arrow paths, and resize the figure to fit posters, slide decks, or journal layouts.
What is a water cycle diagram?
The water cycle (hydrological cycle) describes the continuous movement of water through Earth's systems via evaporation, condensation, precipitation, runoff, and infiltration. A water cycle diagram maps these stages with labeled arrows on a landscape cross-section, used in K-12 earth science and research. With SciFig's water cycle diagram generator you describe the detail and labeling style you need and receive a clear, accurate diagram — labeled or unlabeled — in seconds.
Why accurate water cycle diagrams matter
- Illustrate the continuous movement of water through Earth's atmosphere, land, and ocean systems
- Required in K-12 earth science, environmental science, and geography curricula
- Used in university hydrology, ecology, and climate science courses and research
- Help students understand the connection between solar energy, evaporation, and precipitation patterns
- Provide the visual foundation for lessons on drought, flooding, and climate change impacts
- Essential for textbooks, worksheets, research posters, and science fair presentations
Key components of a water cycle diagram
- Landscape cross-section — ocean, lakes, rivers, mountains, and soil layers shown in profile
- Evaporation arrows — upward curved arrows from water surfaces indicating vapor release
- Transpiration arrows — vapor arrows from plant canopy surfaces joining the atmosphere
- Cloud formation zone — condensation region at altitude where water vapor forms cloud droplets
- Precipitation arrows — downward arrows showing rain, snow, or sleet falling from clouds
- Surface runoff and infiltration — arrows directing water back to rivers, lakes, and groundwater
Where water cycle diagrams are used
- K-12 earth science and geography classrooms for lessons on the hydrological cycle
- University-level environmental science, hydrology, and ecology courses
- Research publications on climate change, water resource management, and ecosystem modeling
- Science fair projects and student research presentations
- Textbooks, worksheets, and online learning modules for environmental education
- Government and NGO reports on water security, drought, and flood risk assessment
How to make a water cycle diagram
Describe your water cycle diagram
Tell SciFig what to draw in plain language — no design tools required.
Generate with SciFig
Get a clean, publication-ready figure that matches your description in seconds.
Edit & export
Vectorize it into editable SVG, relabel everything, and export for your paper, poster, or slides.
Water Cycle Diagram Generator — Frequently Asked Questions
Common questions about Water Cycle Diagram Generator.
More tools

Conceptual Framework Generator
Create professional conceptual framework diagrams showing variable relationships, hypotheses, and theoretical models for your research.

Free Body Diagram Generator
Create accurate, publication-ready free body diagrams with labeled force vectors for weight, normal force, friction, and tension in seconds.

Bell Curve Generator
Generate a precise, fully labeled bell curve showing mean, standard deviations, and percentile regions — ready to export for your paper, thesis, or classroom.
Related links
Home
Turn text, sketches, references, PDFs, and photos into Scientific Figures
Text-to-Figure
Generate a figure from a plain-language description
Models
Default to GPT Image 2 for journal papers; switch to Nano Banana Pro for slides and posters; pick Nano Banana 2 for routine figure work
Tutorials
Seven short walkthroughs of the AI scientific figure generator
Blog
Tutorials, tool comparisons, and publication tips for researchers.
Inspiration
Explore publication-ready scientific figure examples, copy the prompts, and use them as starting points for your own work.

Ready to publish?
Make your own water cycle diagram in minutes.
Start for freeFree to start · No credit card required · Built for researchers