
Lab Diagram Maker
Use this lab diagram maker to turn equipment, connections, labels, and measurements into a clear setup for lab reports and methods figures.
Figure prompt
Describe the figure you want to create
Not sure where to start? Use Example.
Start with 100 free credits|No credit card required
Get up to 300 free credits on day one when you join through an invite.
Reviewed by SciFig TeamUpdated
Lab Diagram Maker— templates & examples
A prompt-first workflow for trustworthy lab diagrams
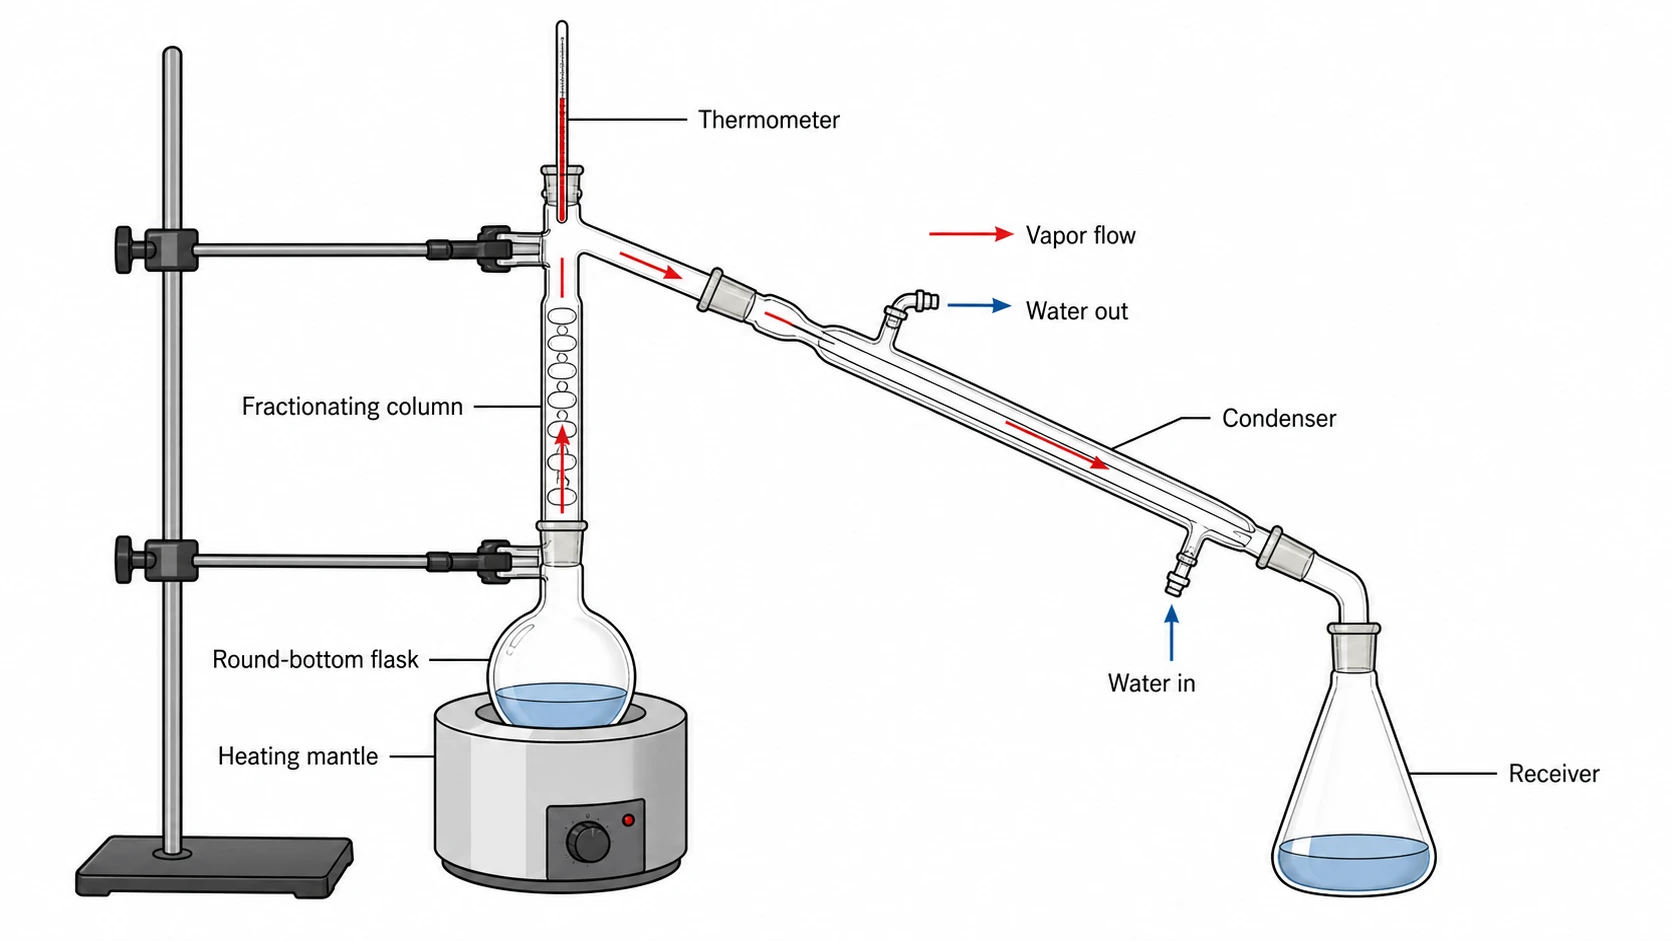
Describe the real setup
Start with the order of components, ports, supports, and measurements. The lab diagram maker uses those relationships instead of guessing from a generic stock scene. A science lab diagram maker draft keeps the full connection context visible.
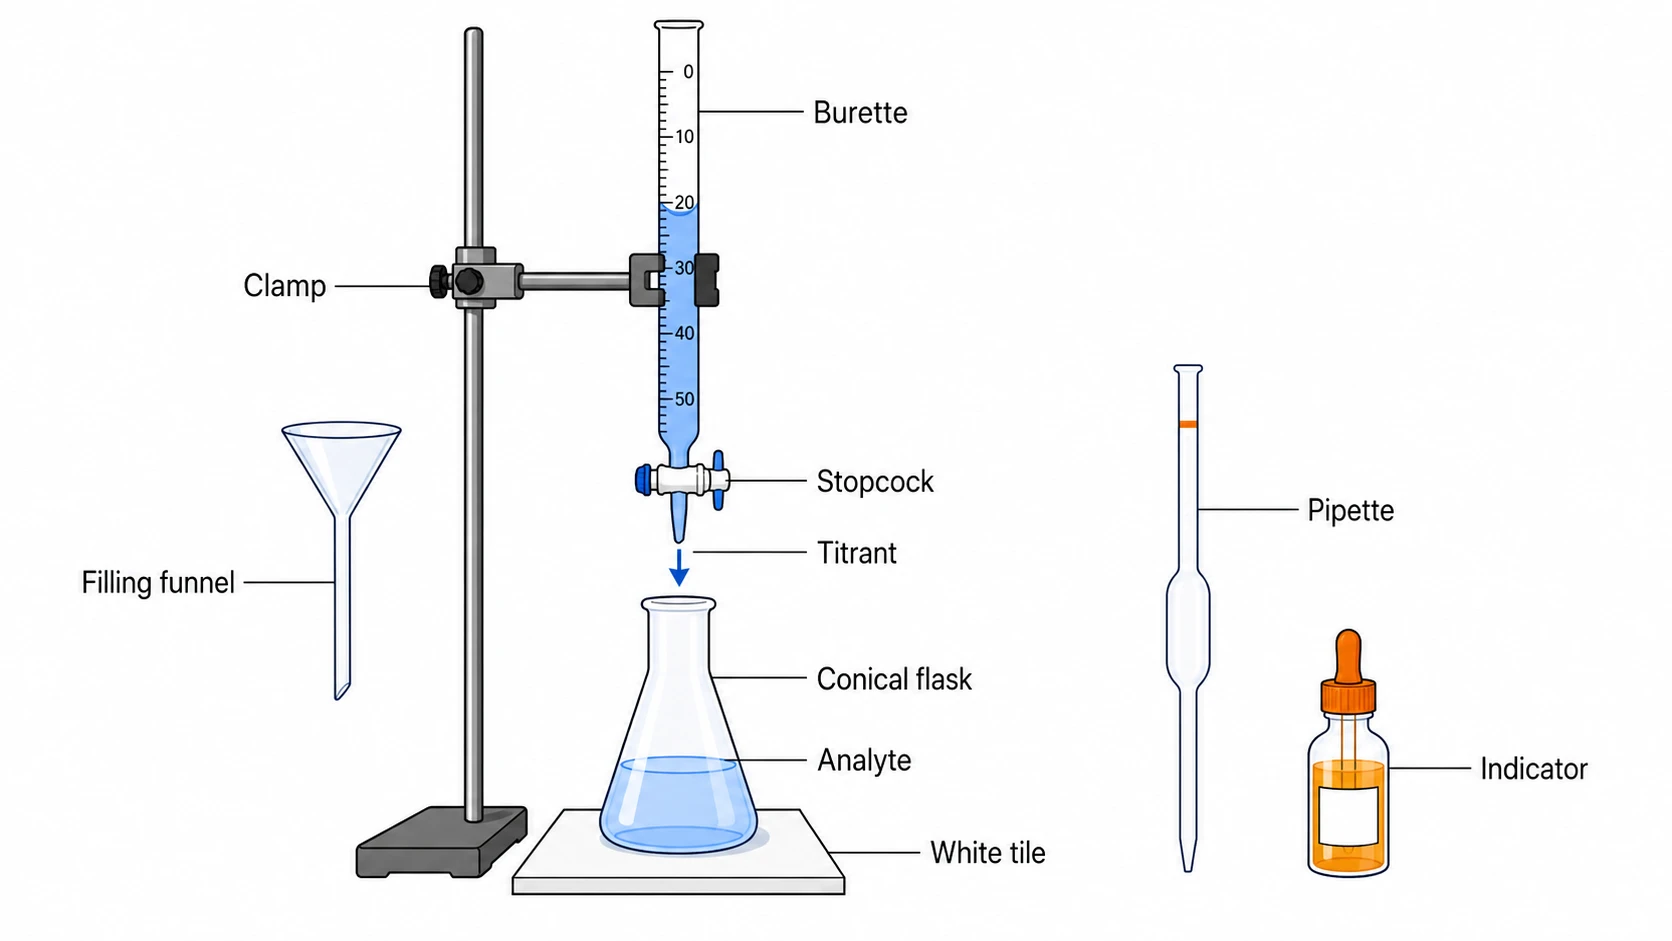
Refine labels and connections
Ask for exact names, units, arrows, and line styles. Use the science apparatus diagram maker to correct topology and keep tubing, wiring, and optical paths distinct. A lab experiment diagram maker version can preserve the same topology while changing labels.
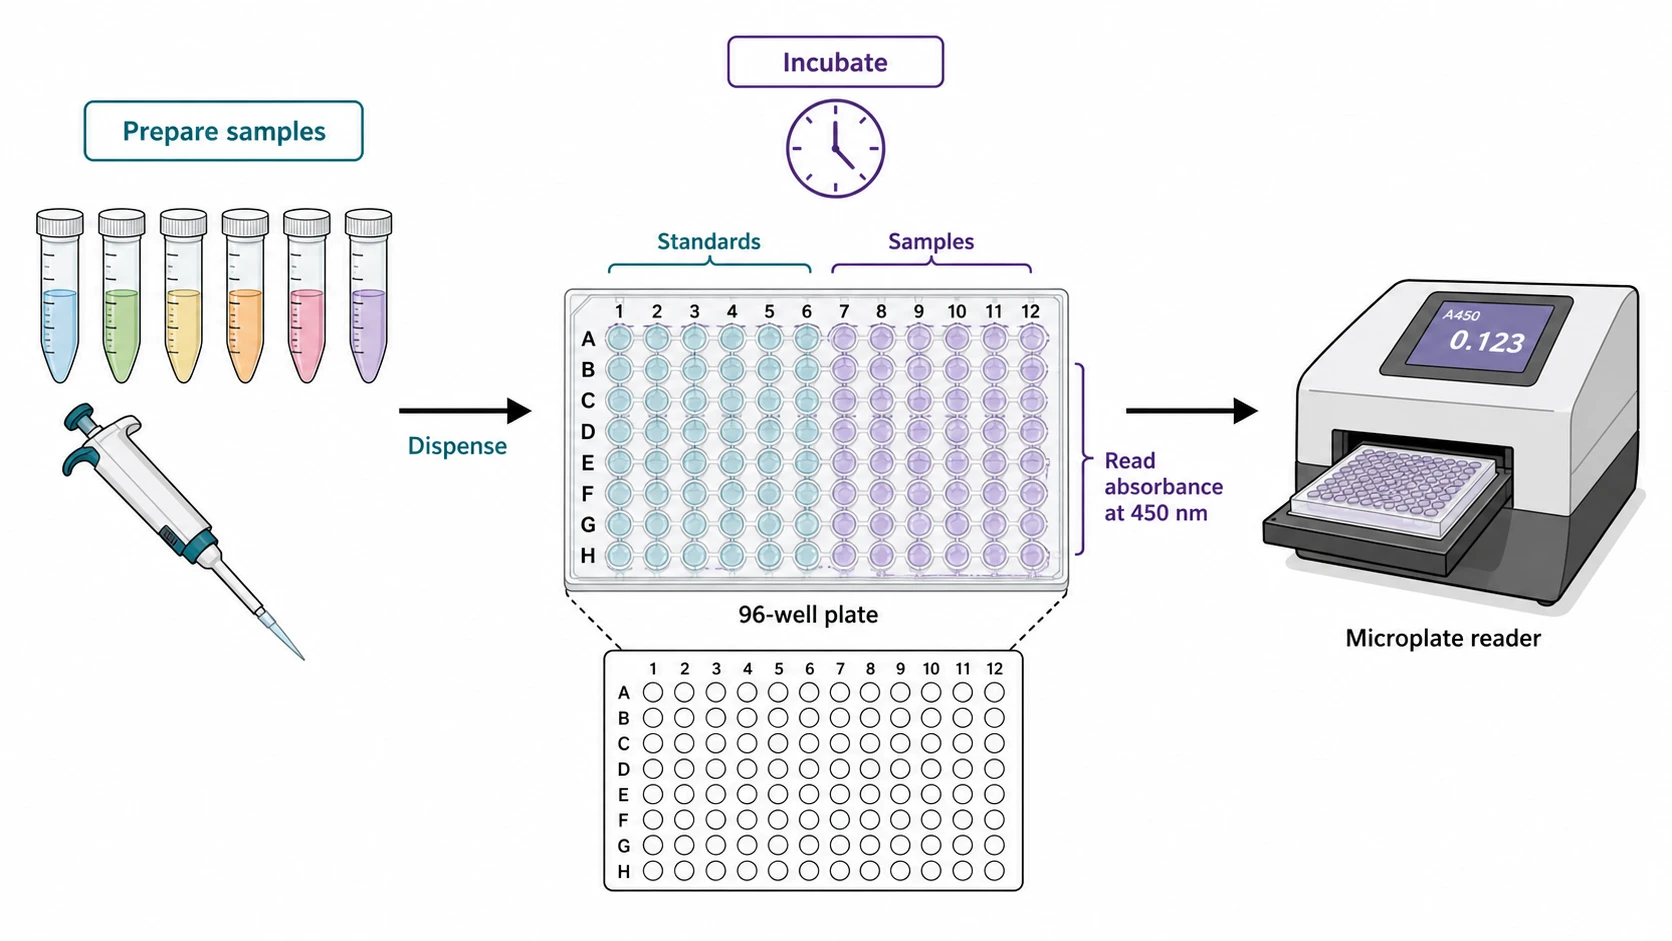
Export a reviewable figure
Check every generated component against the bench, then prepare a lab setup diagram for a protocol, practical worksheet, or methods section. A lab setup diagram maker draft is ready for a final bench check.
What is a lab diagram?
A lab diagram is a simplified, labeled view of an experiment setup. It shows the equipment, connections, material or energy flow, measurements, and safety-critical orientation without the visual clutter of a photograph. SciFig's lab diagram maker turns a plain-English description into a clean schematic you can refine and export for a lab report, protocol, presentation, or methods section.
Why use a lab diagram maker
- Reproducibility — show how components connect rather than listing equipment without spatial relationships.
- Connection clarity — distinguish tubing, wiring, optical paths, and structural supports with consistent lines.
- Measurement context — place values and units beside the point where each condition is measured.
- Safer communication — mark flow direction and critical orientation so the setup is not read backwards.
- Faster revision — change one component or label without rebuilding the entire experiment diagram by hand.
- Publication-ready structure — replace background clutter with a focused schematic for methods and reports.
Key components of a lab diagram
- Apparatus symbols — recognizable outlines for vessels, instruments, probes, supports, and power sources.
- Connection lines — explicit joints for tubes, cables, pipes, optical paths, or mechanical links.
- Directional arrows — restrained cues for liquid, gas, current, light, heat, or sample movement.
- Labels and callouts — concise names positioned close to the relevant part without crossing leaders.
- Measurements and conditions — units, set points, durations, concentrations, or wavelengths at their source.
- Legend and boundary — only when needed to explain symbols, grouped stages, or the limits of the setup.
Where lab diagrams are used
- Lab reports — document the actual arrangement used to collect observations and measurements.
- Experimental protocols — show assembly order, ports, flow direction, and instrument handoffs.
- Methods sections — summarize a custom rig or measurement path that prose alone cannot describe clearly.
- Practical worksheets — give learners a labeled reference or a blank setup to complete and discuss.
- Research presentations — explain the apparatus before showing results, plots, or derived models.
- Risk assessments — identify heat, pressure, electricity, glassware, and containment boundaries for review.
How to make a lab diagram
Describe your lab diagram
Tell SciFig what to draw in plain language — no design tools required.
Generate with SciFig
Get a clean, publication-ready figure that matches your description in seconds.
Edit & export
Vectorize it into editable SVG, relabel everything, and export for your paper, poster, or slides.
Lab Diagram Maker — Frequently Asked Questions
Common questions about Lab Diagram Maker.
More tools

Circuit Diagram Maker
Generate accurate circuit diagrams with labeled schematic symbols for research papers, lab reports, and technical publications.

Free Body Diagram Generator
Create accurate, publication-ready free body diagrams with labeled force vectors for weight, normal force, friction, and tension in seconds.

Graphical Abstract Maker
Generate a publication-ready graphical abstract — a single-panel visual summary that captures your study's methods, key finding, and result with clear icons and flow arrows.
Home
Free AI Scientific Figure Generator and Figure Maker — Create Research Figures, Images, Illustrations and Diagrams
Text-to-Figure
Generate a figure from a plain-language description
Models
Default to GPT Image 2 for journal papers; switch to Nano Banana Pro for slides and posters; pick Nano Banana 2 for routine figure work
Tutorials
Seven short walkthroughs of the AI scientific figure generator
Blog
Tutorials, tool comparisons, and publication tips for researchers.
Inspiration
Explore publication-ready scientific figure examples, copy the prompts, and use them as starting points for your own work.

Ready to publish?
Make your own lab diagram in minutes.
Start for freeFree to start · No credit card required · Built for researchers