
Free PCR Diagram Generator
Generate accurate PCR figures showing denaturation, annealing, and extension with the temperatures and primers labeled — ready for protocols and methods sections.
Start with up to 150 free credits|No credit card required
Get up to 350 free credits on day one when you join through an invite.
Updated
Free PCR Diagram Generator— templates & examples
Everything you need to build a clear pcr diagram
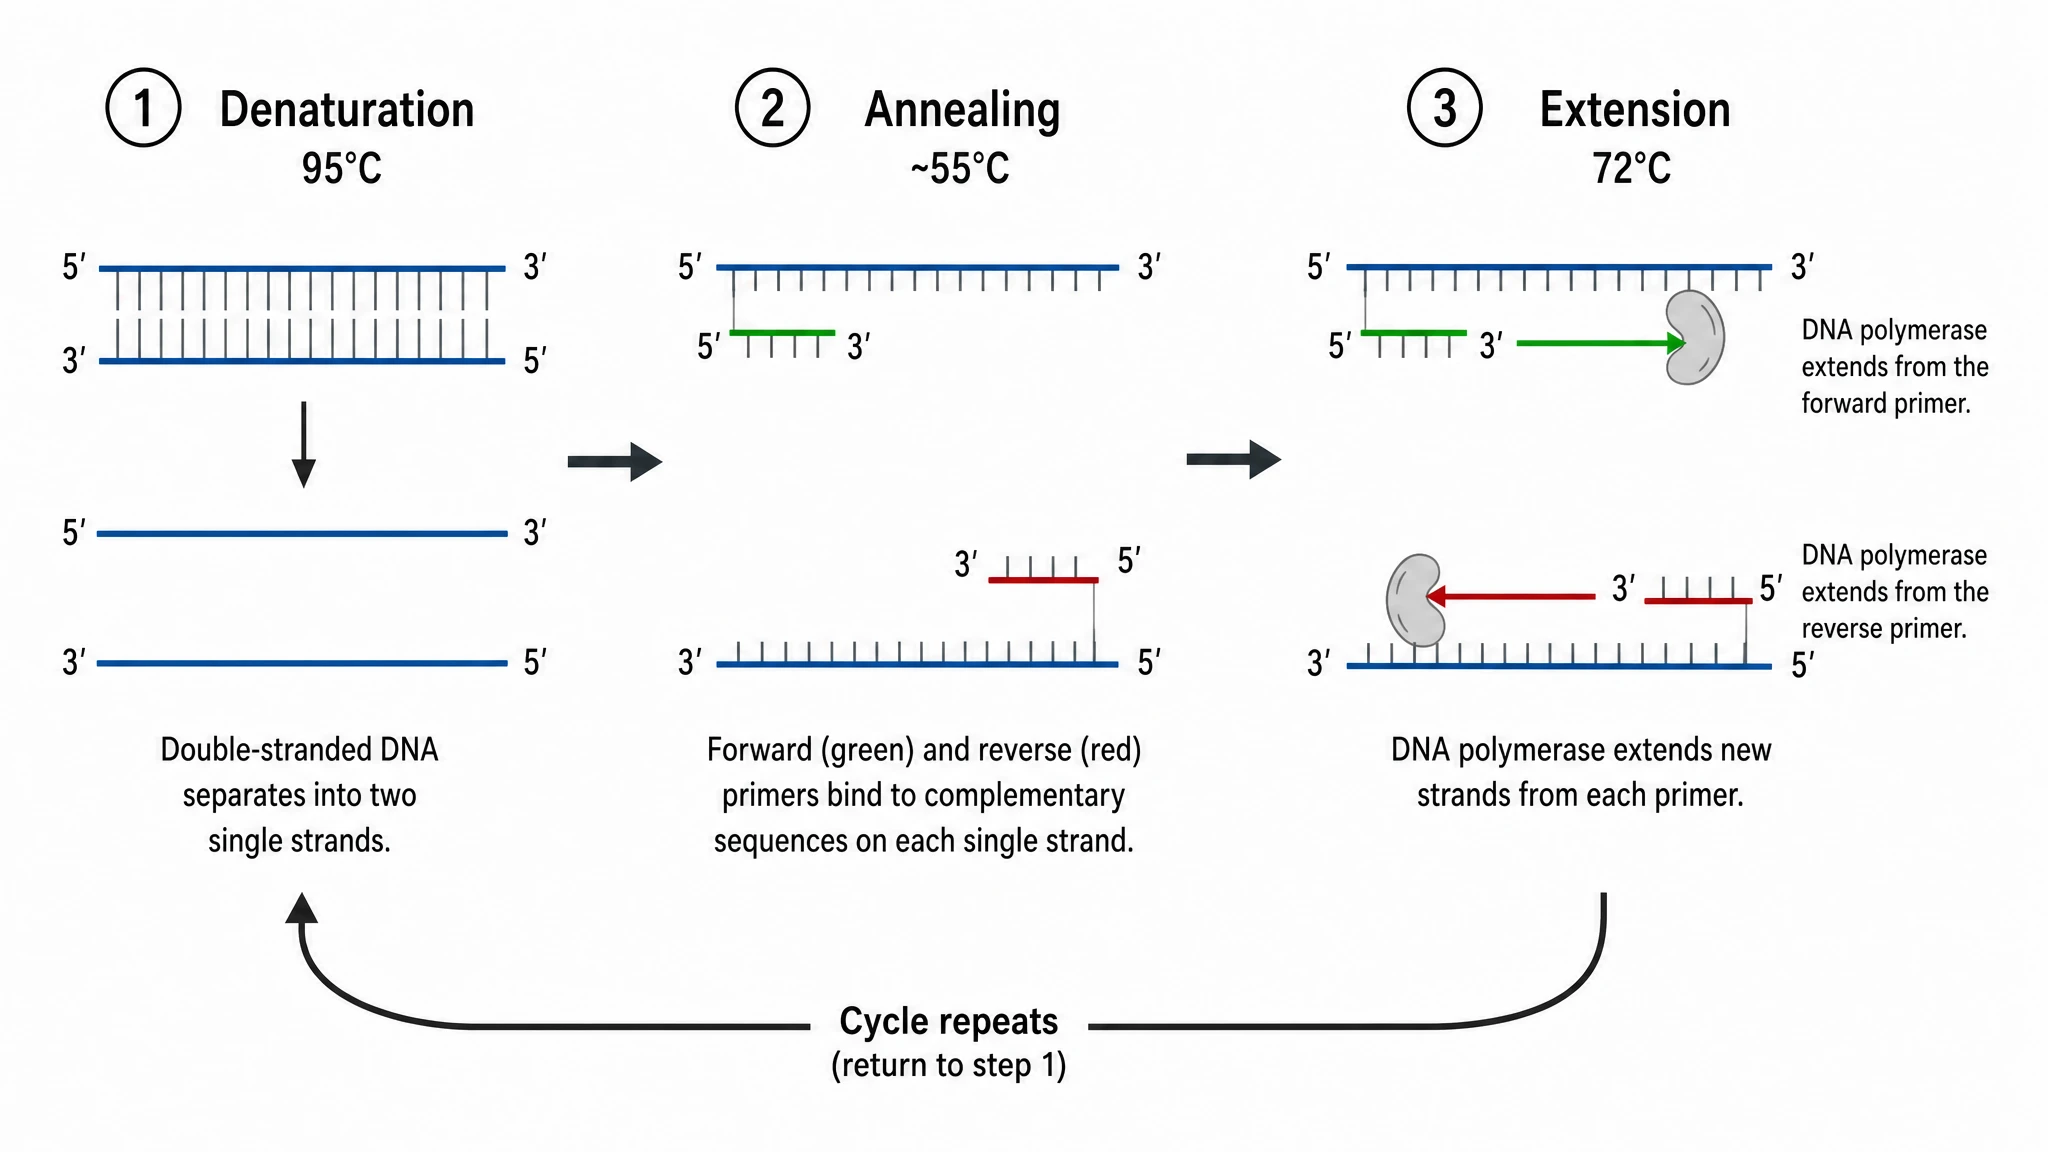
Draw all three stages with correct temperatures
A methods figure is only useful if the numbers are right. SciFig's pcr diagram generator labels denaturation near 95°C, annealing between 50°C and 65°C, and extension at 72°C, with the template, primers, and polymerase drawn in their correct positions at each stage.
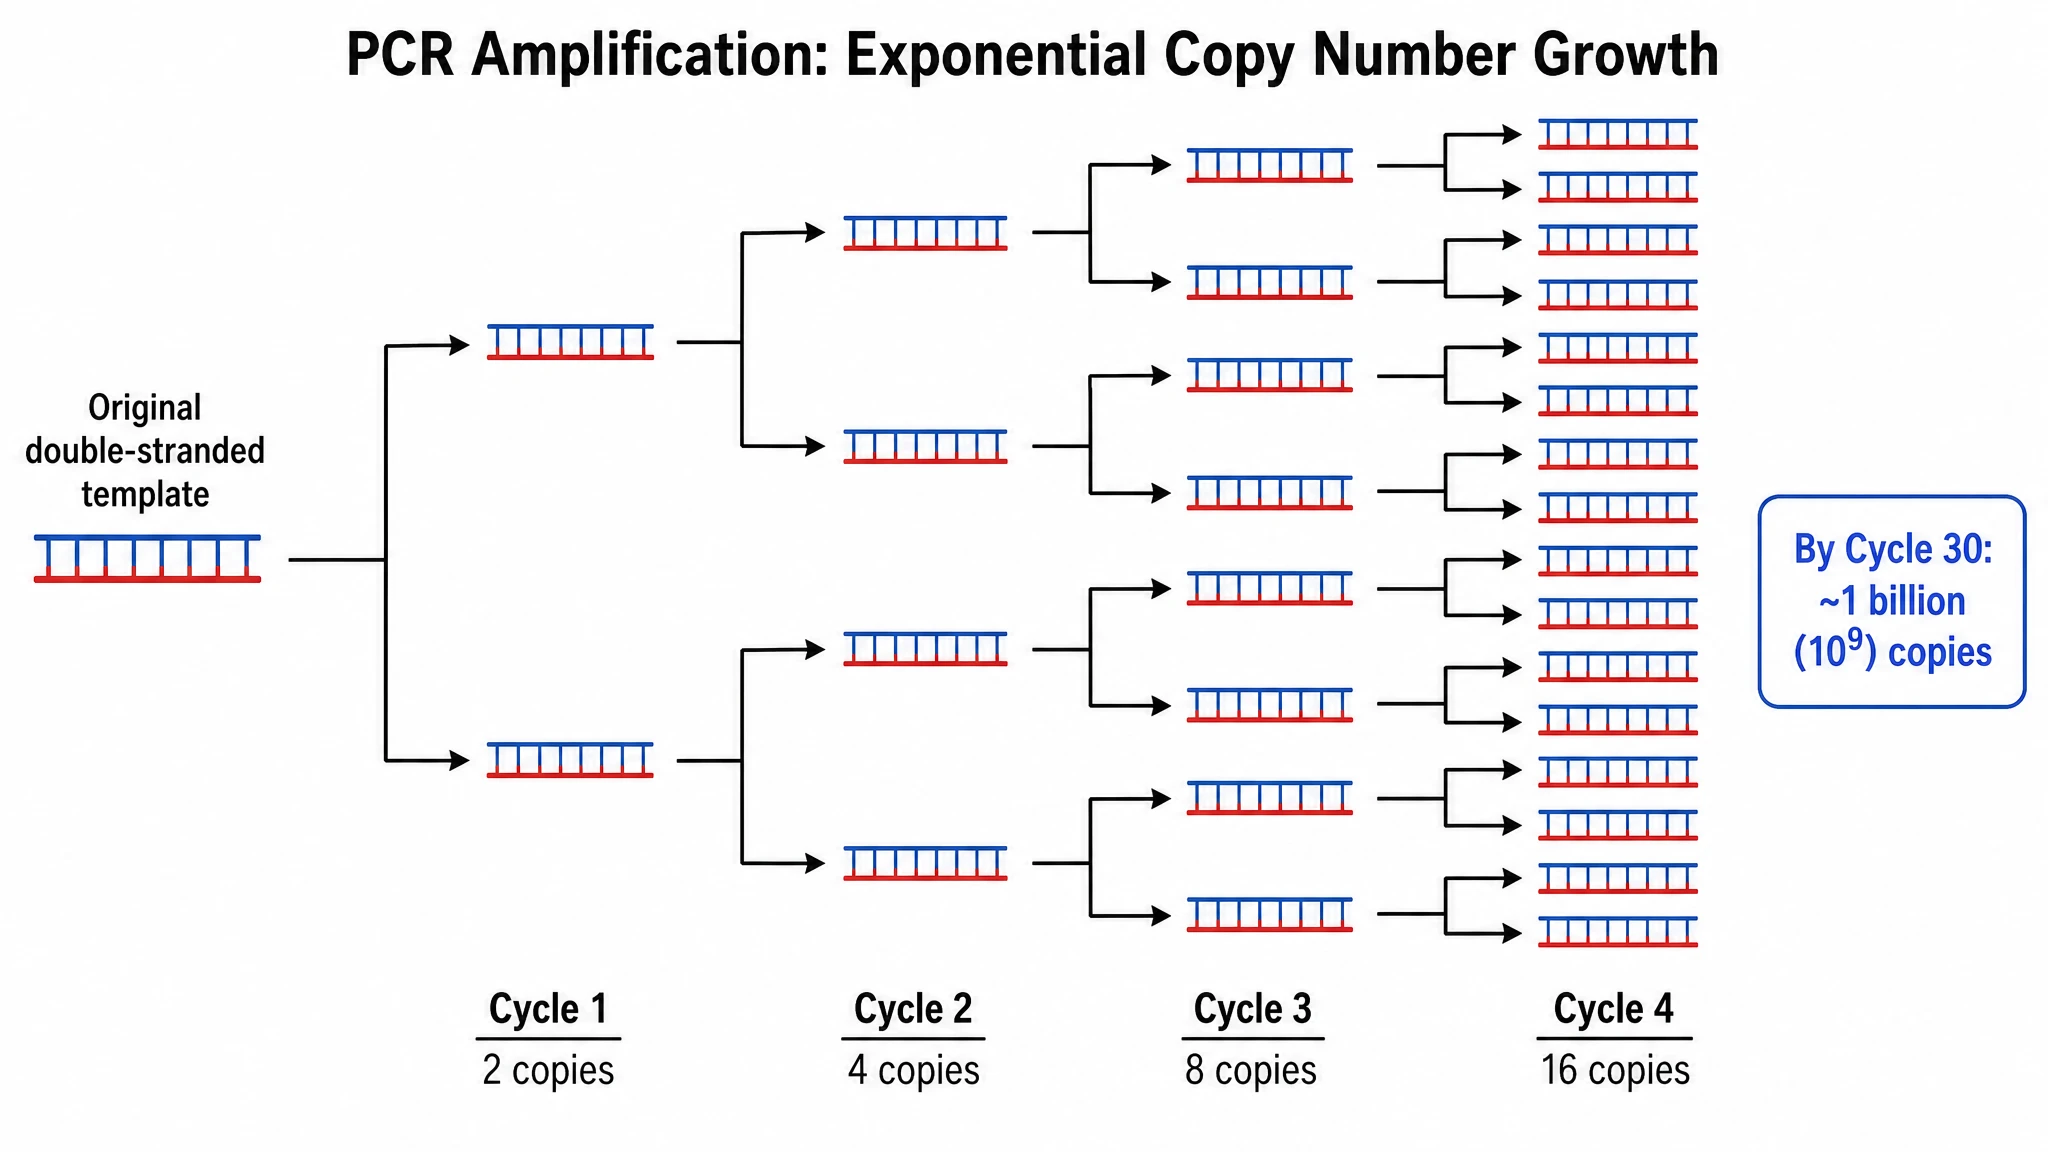
Show exponential amplification across cycles
One cycle explains the chemistry; several explain the power. A pcr cycle diagram from SciFig can extend to show copy number doubling from one template to two, four, and eight, making it obvious why thirty cycles yield millions of copies of the target region.
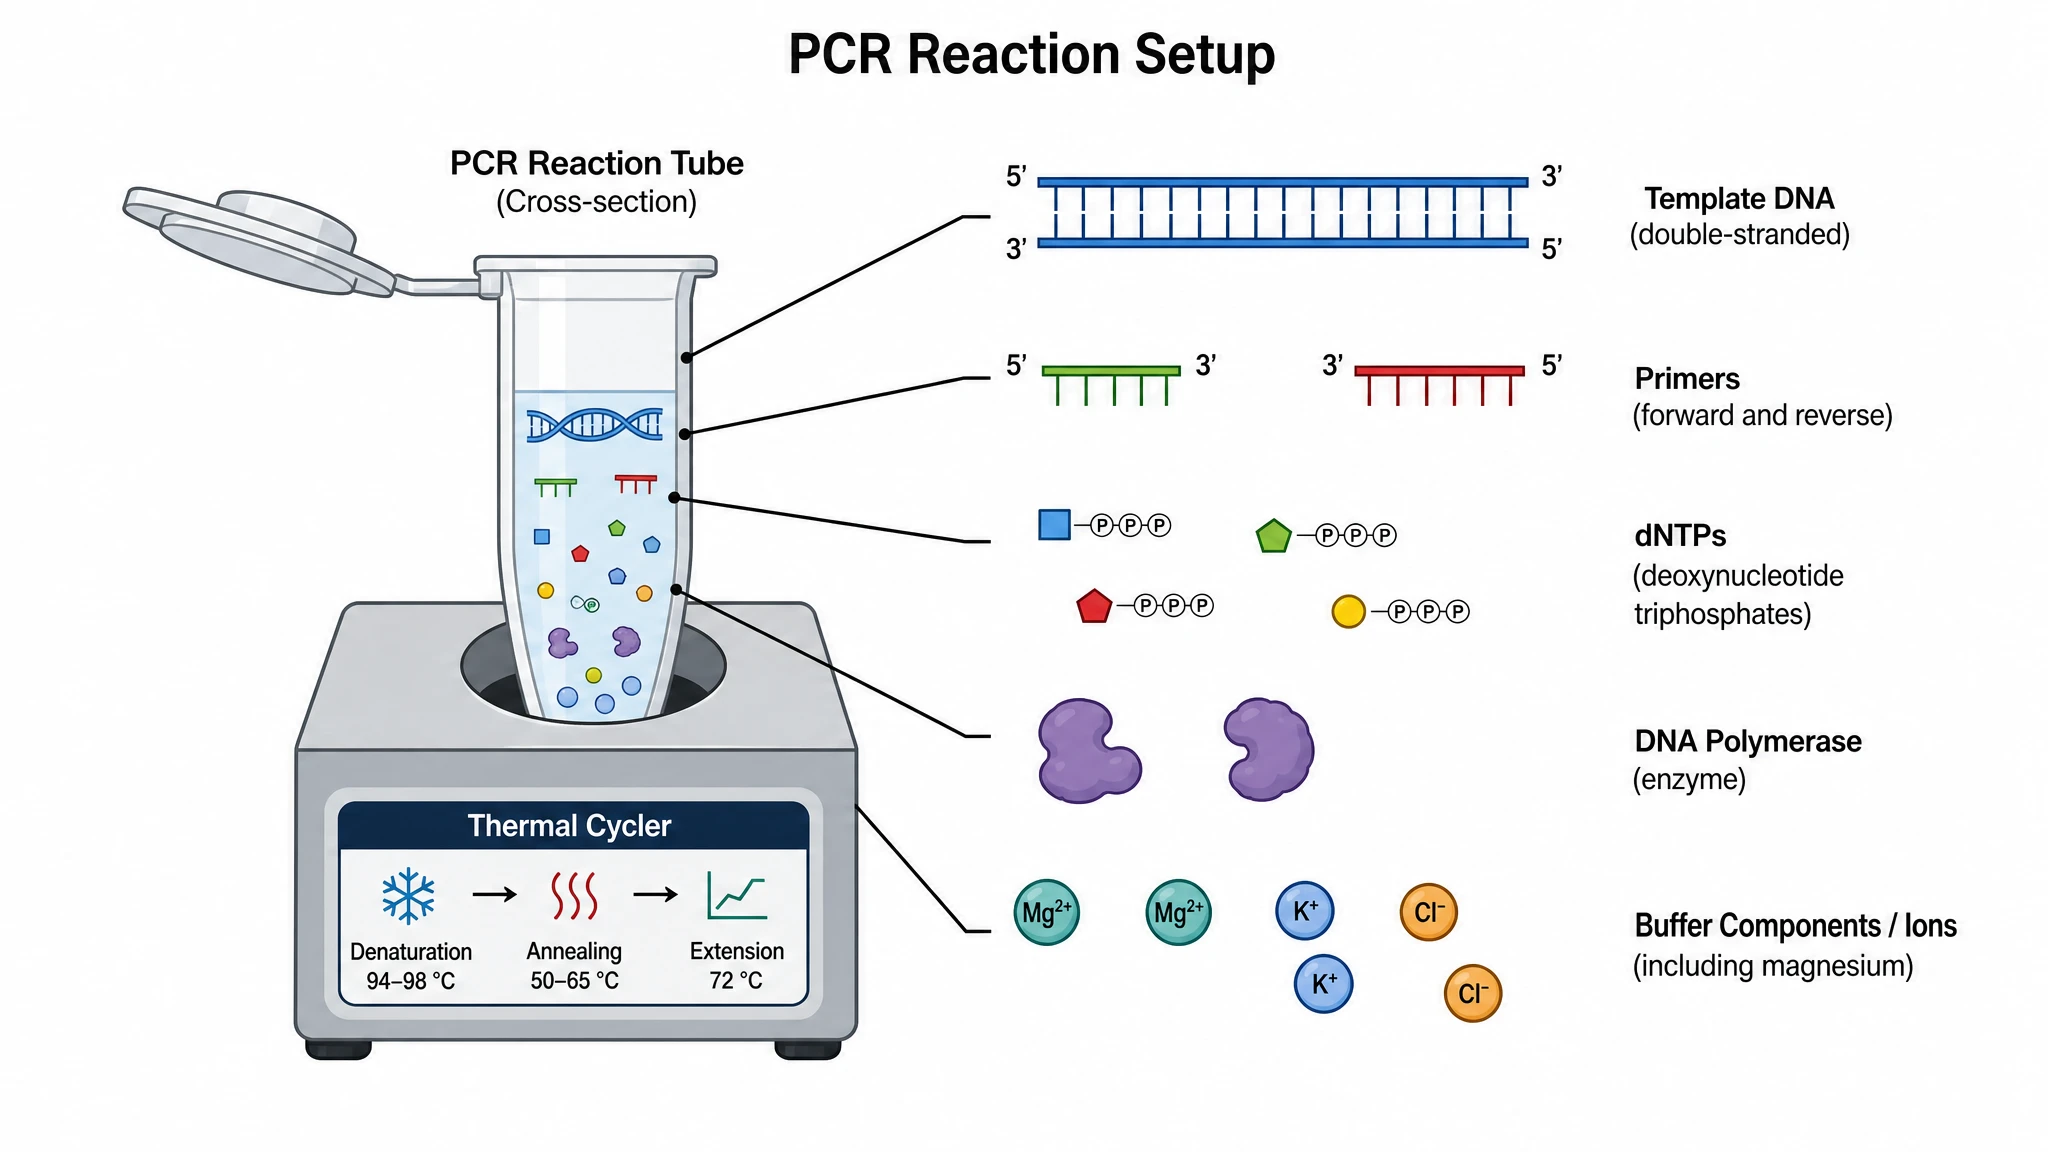
Export protocol and publication figures
Whether you need a simple pcr steps diagram for a lab handout or a detailed reaction schematic for a manuscript, SciFig exports clean high-resolution figures. Labels stay editable, so you can swap in your own primer names or annealing temperature without rebuilding the figure.
What is a pcr diagram?
PCR is the thermal cycling reaction that copies a target DNA sequence millions of times using primers and a heat-stable polymerase. A pcr steps diagram draws one cycle as three temperature stages: denaturation separates the double-stranded template near 95°C, annealing lets primers bind around 55°C, and extension has Taq polymerase build new strands at 72°C. With SciFig's pcr diagram generator you describe the stages and labels you need and get an accurate figure ready to export.
Why you need a pcr diagram
- Show how a single target sequence is amplified into millions of copies
- Document the exact thermal cycling profile used in a methods section
- Explain why primers determine which region of the genome is amplified
- Make the role of a heat-stable polymerase clear to students
- Illustrate exponential doubling that a written protocol only implies
- Support figures for diagnostics, genotyping, cloning, and sequencing workflows
Key components of a pcr diagram
- Template DNA — the double-stranded target that is melted apart each cycle
- Forward and reverse primers — short oligonucleotides defining the amplified region
- Taq polymerase — the heat-stable enzyme that survives repeated denaturation
- dNTPs — the nucleotide building blocks incorporated during extension
- Temperature annotations — the three set points that define one thermal cycle
- Cycle arrows — the loop showing the reaction repeating twenty-five to forty times
- Amplification tree — the branching that shows copy number doubling per cycle
Where pcr diagrams are used
- Methods sections and supplementary protocols in molecular biology papers
- Lab handouts and SOPs describing a genotyping or cloning workflow
- Molecular biology and genetics teaching on nucleic acid amplification
- Diagnostics posters covering pathogen detection assays
- Grant applications outlining an amplification-based experimental plan
- Student lab reports and thesis methods chapters
How to make a pcr diagram
Describe your pcr diagram
Tell SciFig what to draw in plain language — no design tools required.
Generate with SciFig
Get a clean, publication-ready figure that matches your description in seconds.
Edit & export
Vectorize it into editable SVG, relabel everything, and export for your paper, poster, or slides.
Free PCR Diagram Generator — Frequently Asked Questions
Common questions about Free PCR Diagram Generator.
More tools
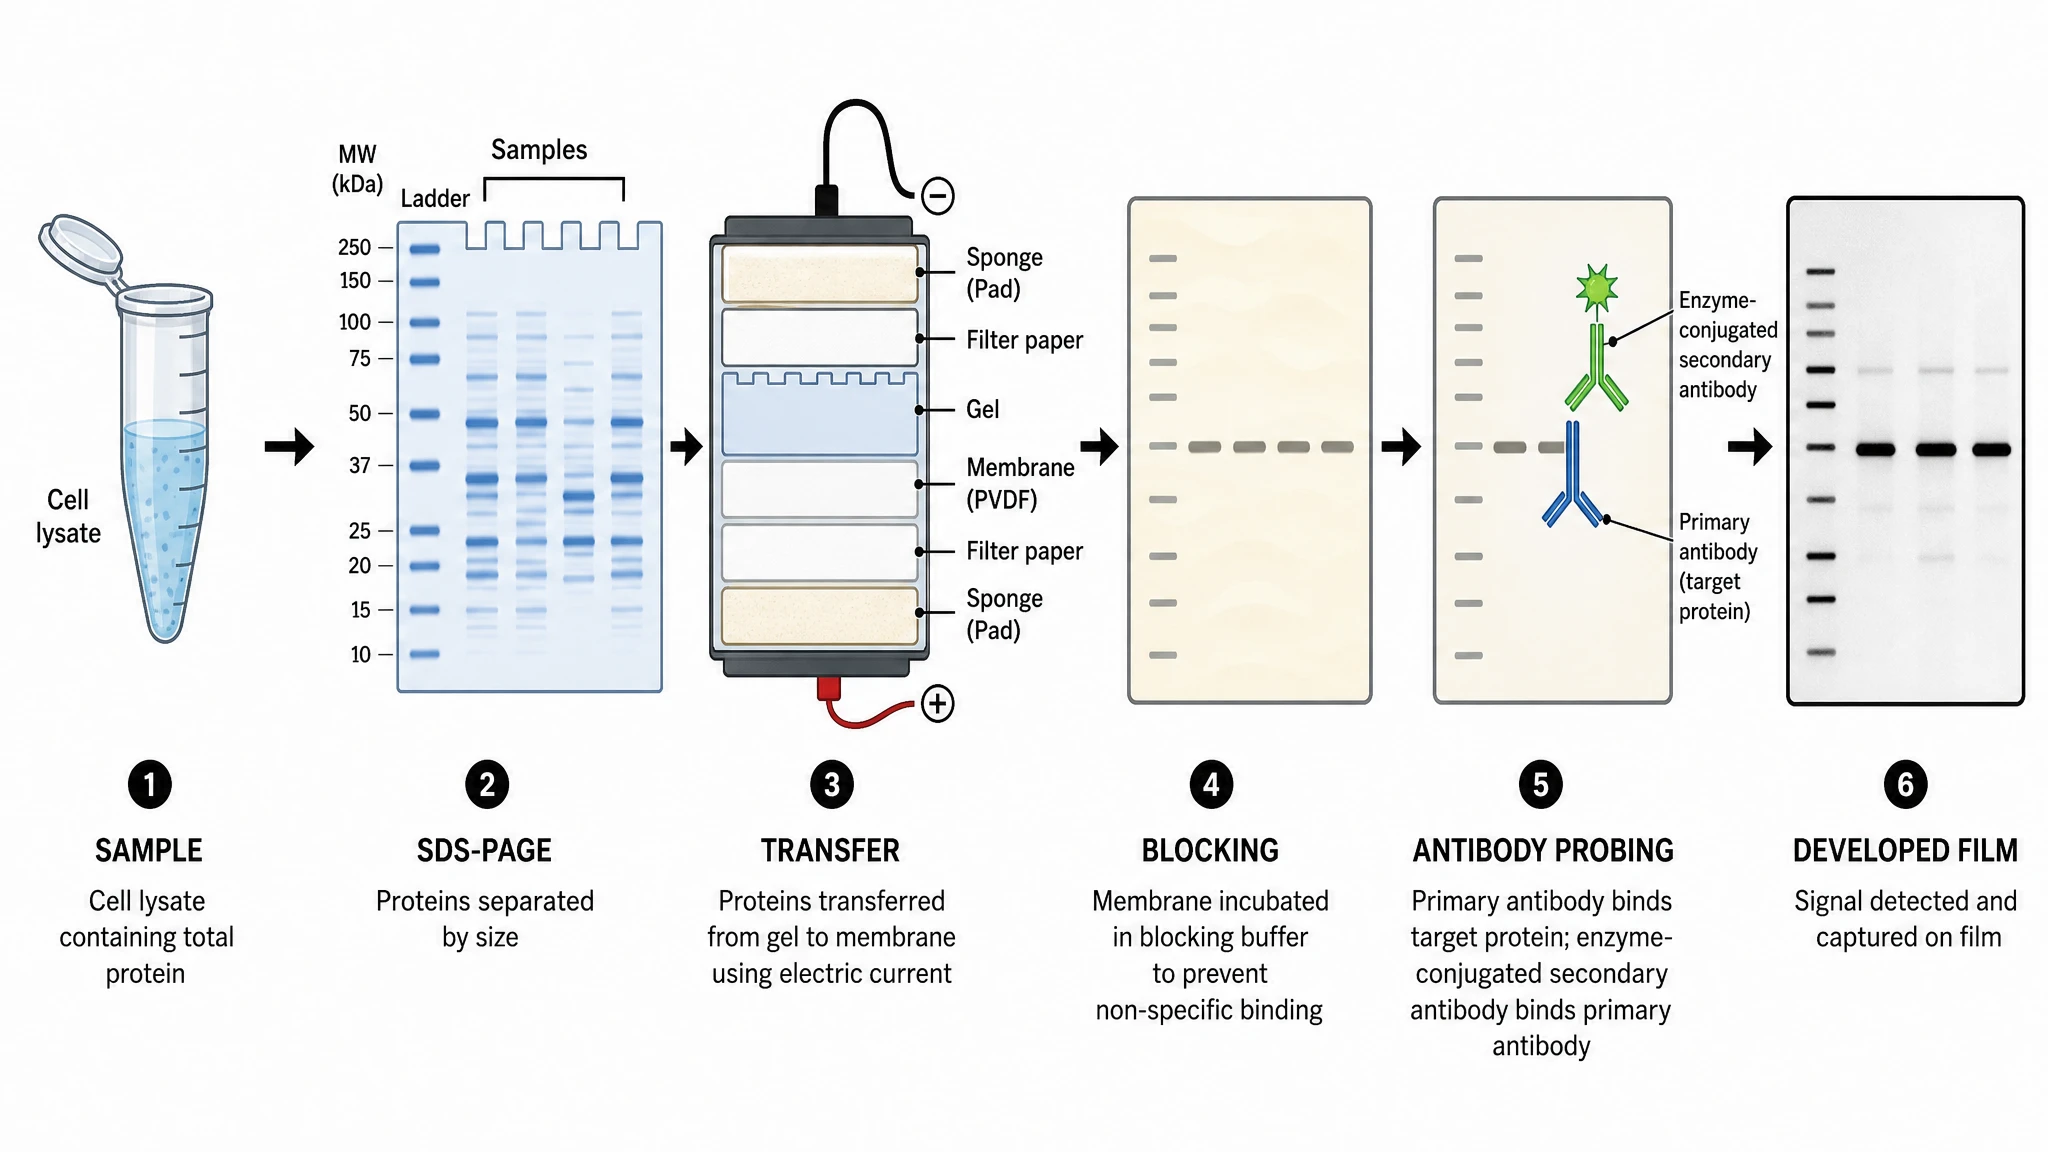
Western Blot Diagram Generator
Chart gel, transfer, and antibody detection

Circuit Diagram Maker
Draw electronic circuit schematics

Free Body Diagram Generator
Show forces acting on an object
SciFig
Free AI Scientific Figure Generator for Illustrations, Images, Charts and Flowcharts
Models
Default to GPT Image 2 for journal papers; switch to Nano Banana Pro for slides and posters; pick Nano Banana 2.1 for routine figure work
Tutorials
Seven short walkthroughs of the AI scientific figure generator
Blog
Tutorials, tool comparisons, and publication tips for researchers.
Inspiration
Explore publication-ready illustrations, charts and flowcharts. Copy a prompt or open any template as the starting point for your own figure.
Pricing
View pricing

Ready to publish?
Make your own pcr diagram in minutes.
Start for freeFree to start · No credit card required · Built for researchers