
Free Histogram Maker
Turn a set of measurements into a clean, publication-ready histogram — choose your bins, label both axes, and show the real shape of your data distribution.
Start with up to 150 free credits|No credit card required
Get up to 350 free credits on day one when you join through an invite.
Updated
Free Histogram Maker— templates & examples
Everything you need to build a clear histogram
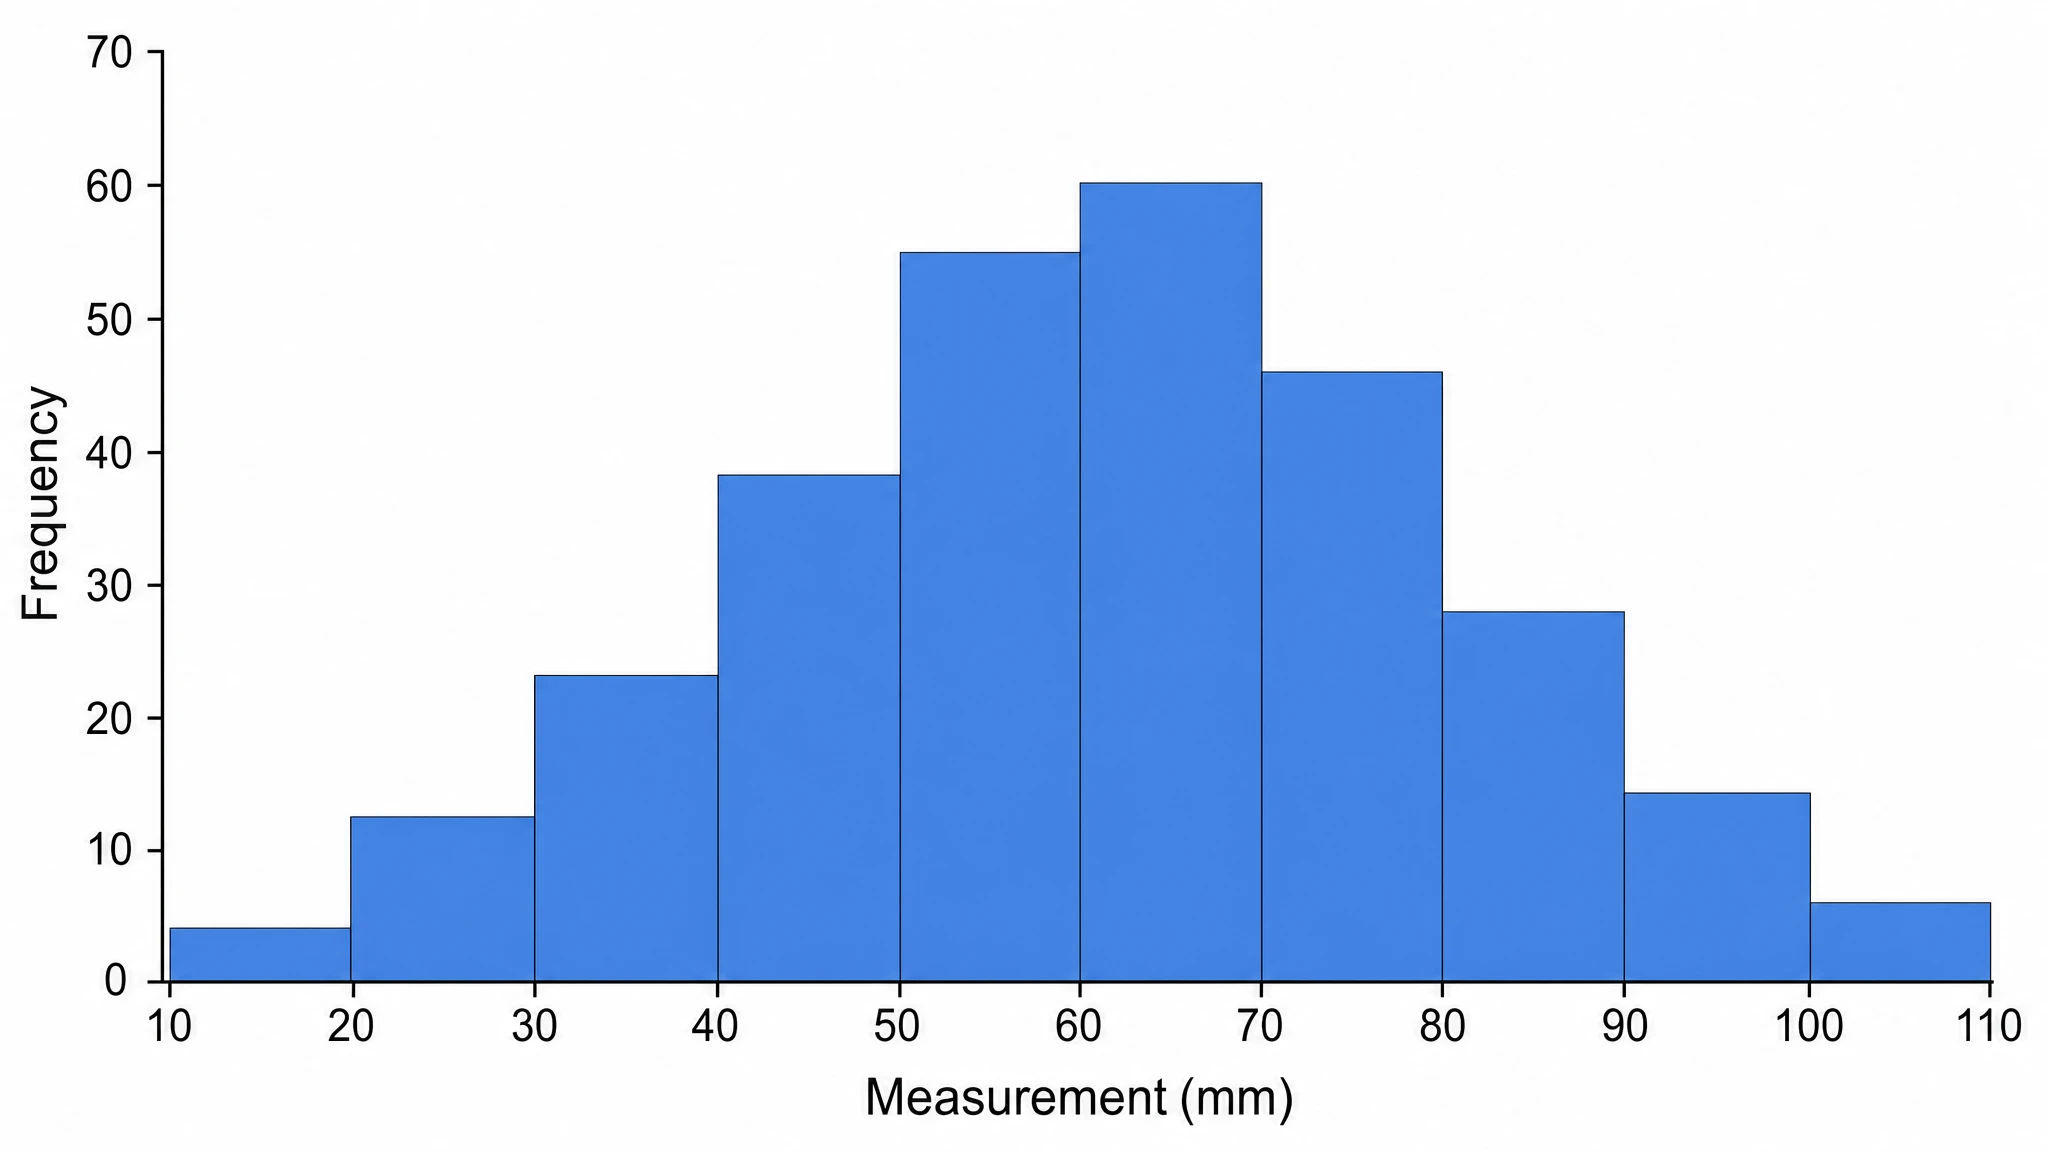
Control bins, range, and axis labels
Bin width decides what your reader sees. Upload your measurements to SciFig DataChart (data-driven charts) and state the range and interval you want, and it draws adjacent bars with a labeled frequency axis and a measured-variable axis carrying its units — the details reviewers check first in a distribution figure. Unlike a spreadsheet chart wizard, this histogram generator keeps the axis titles and units you specify.
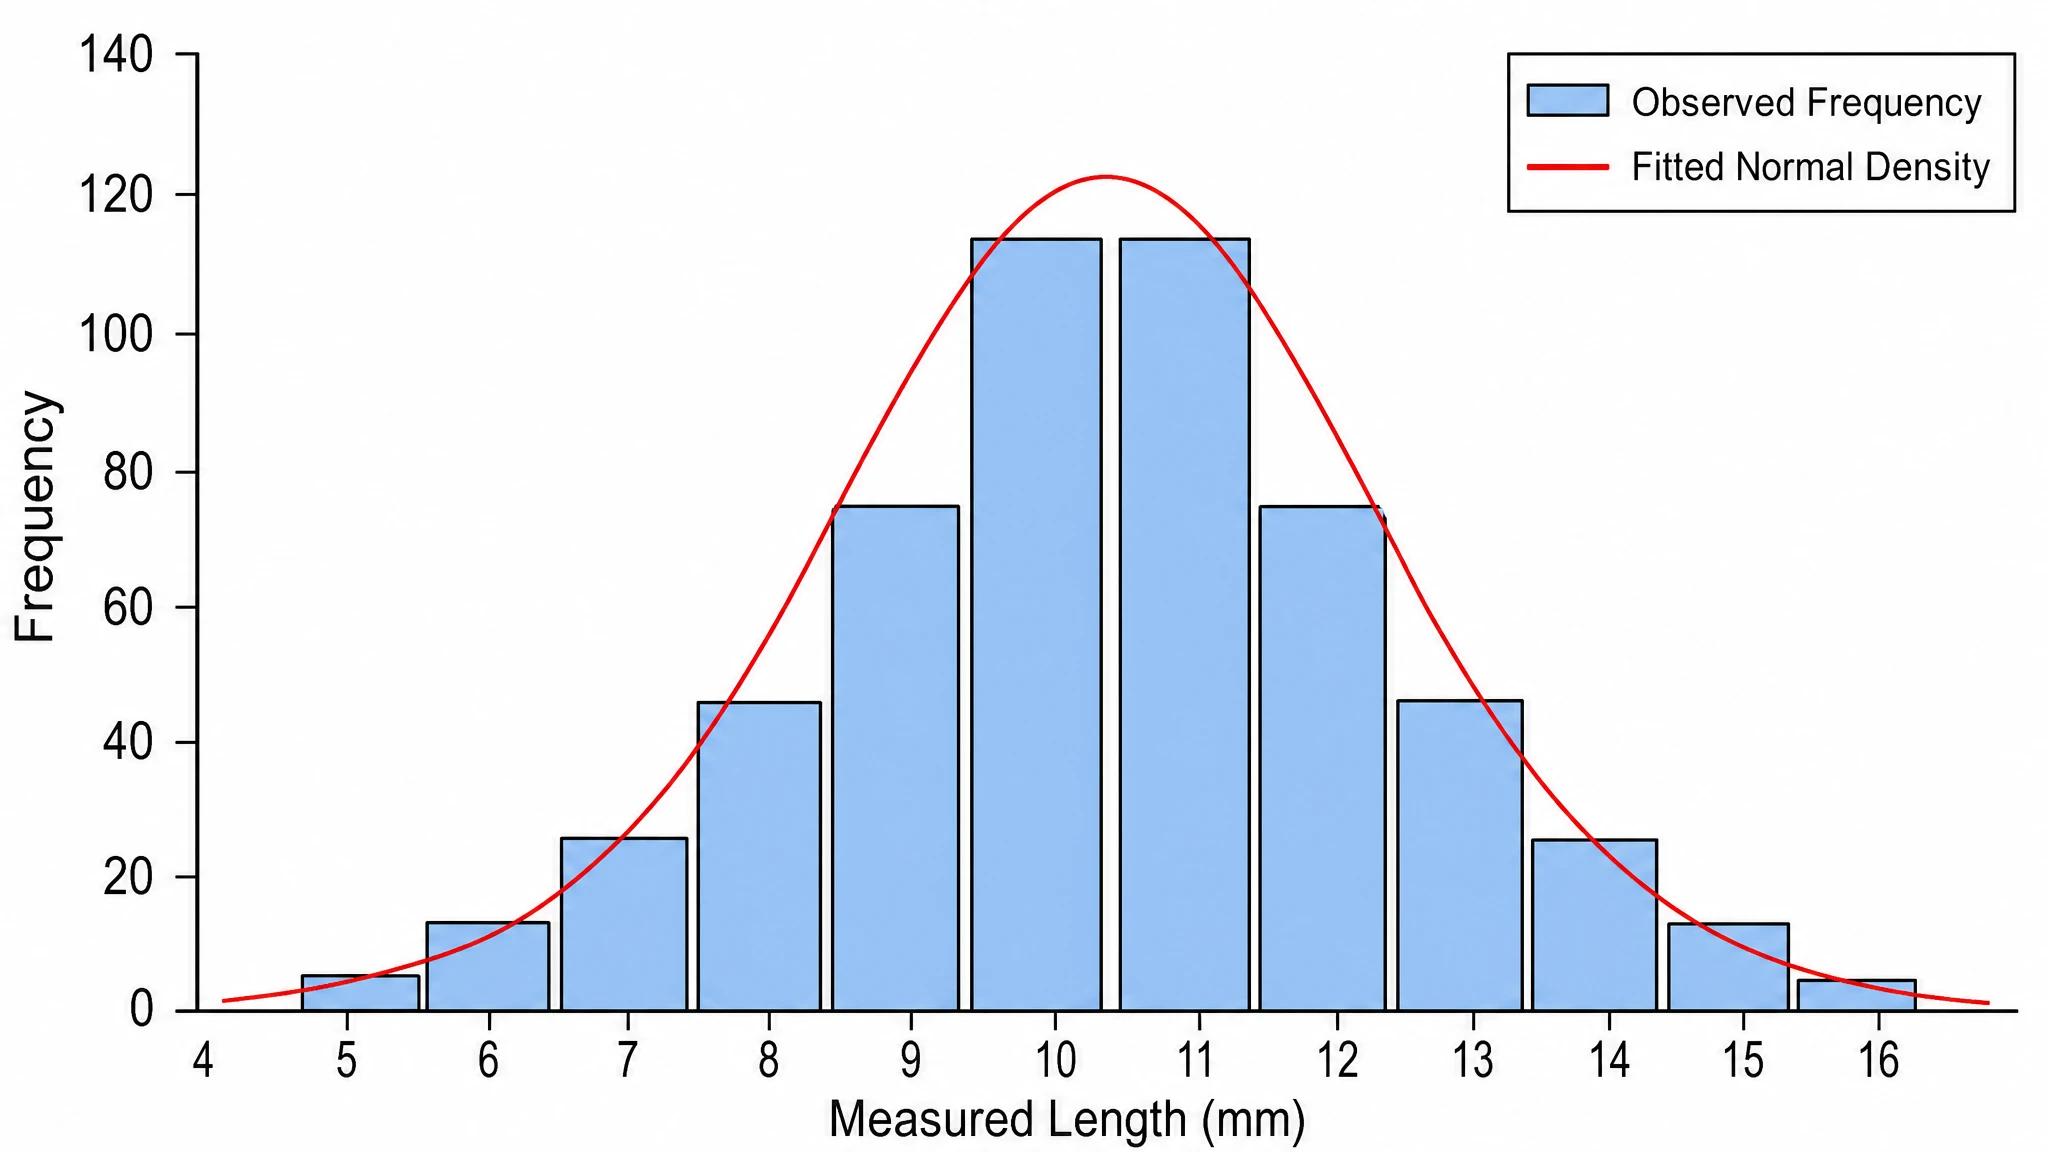
Compare distributions side by side
Use a histogram creator to place two groups on the same axes, or to draw a fitted normal curve over the bars when you need to argue about normality. Both variants come out of the same description, so a control-versus-treatment panel stays visually consistent.
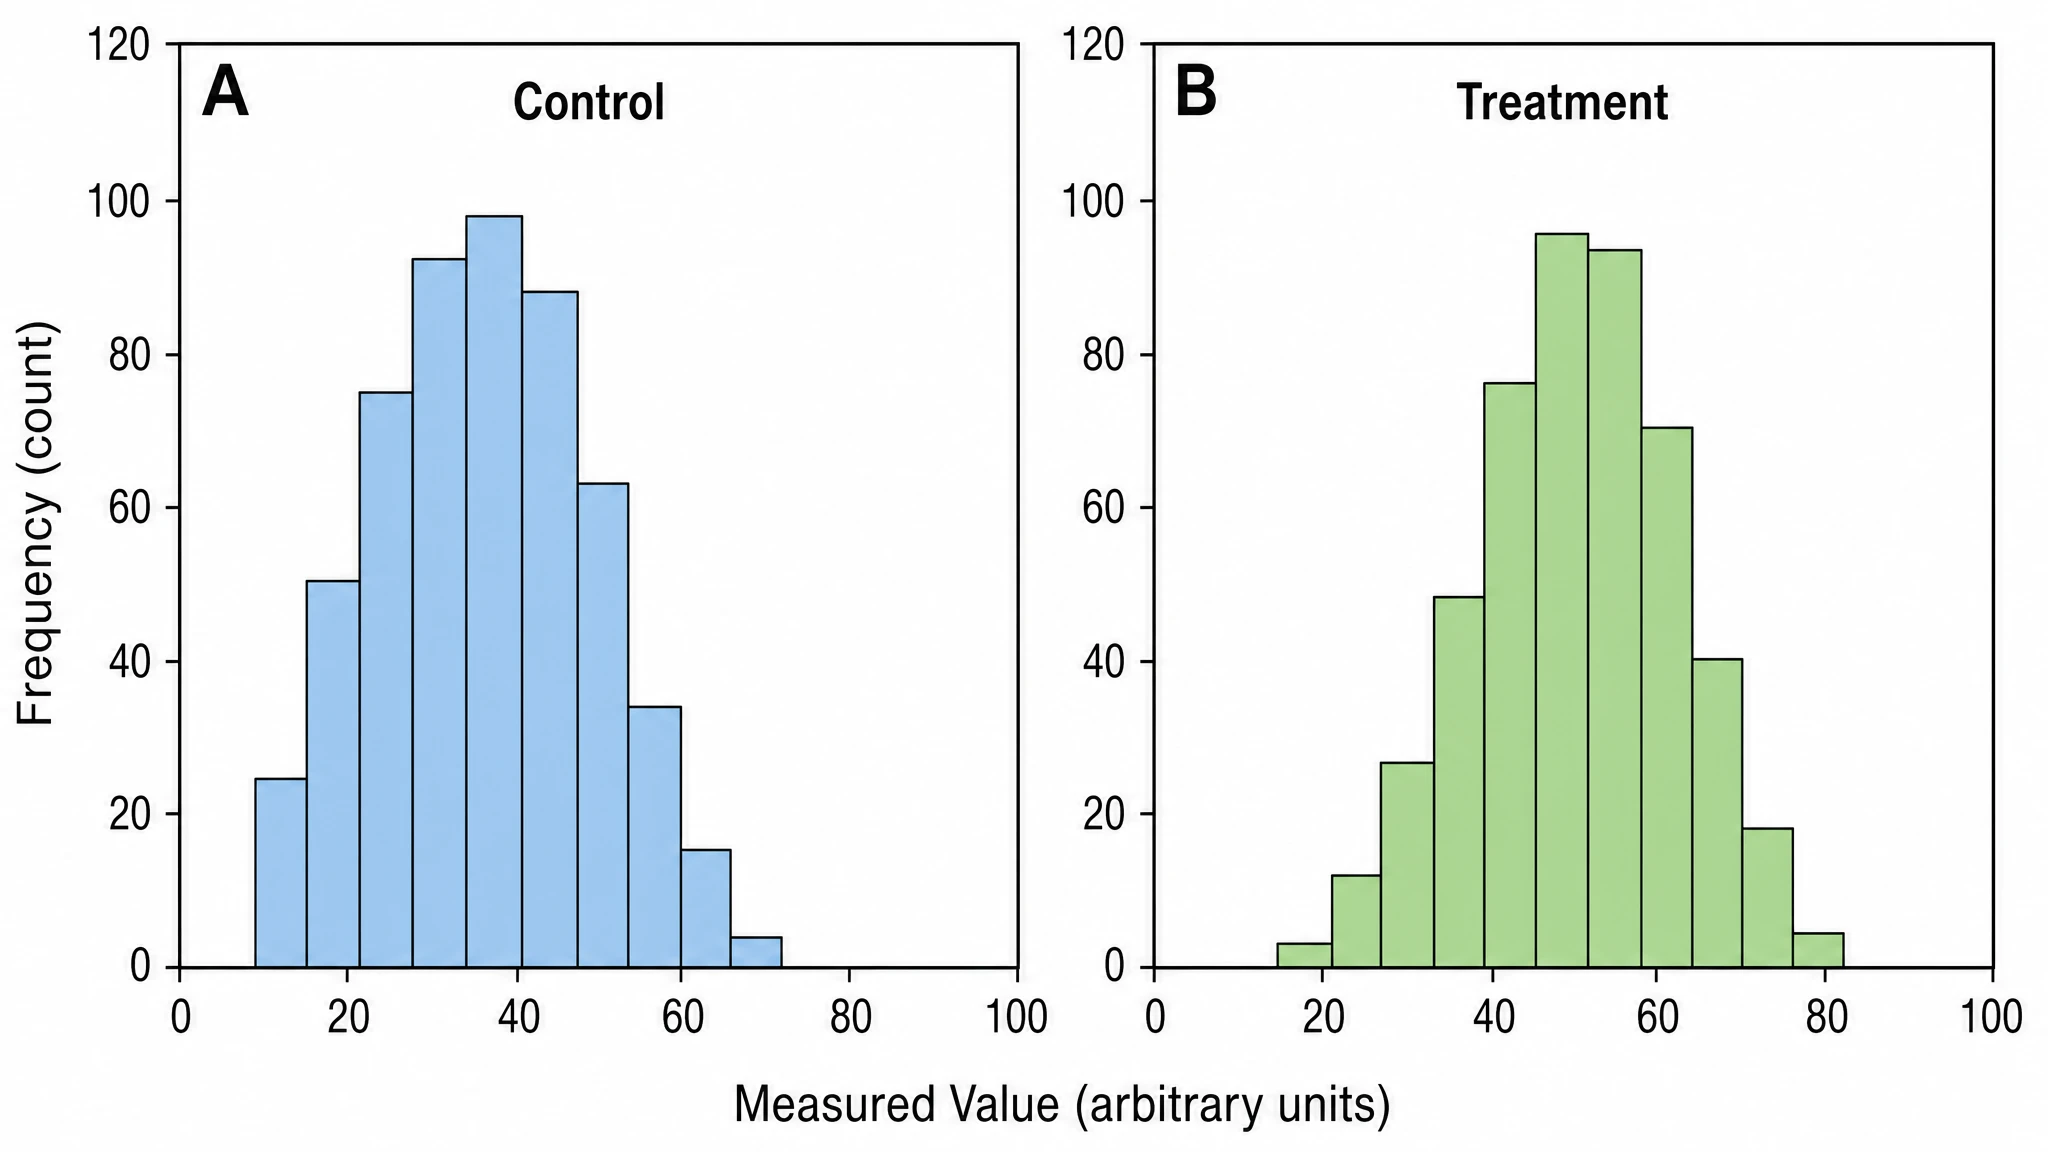
Export figures ready for papers and posters
Every chart from this online histogram maker exports at publication resolution with legible tick labels at print size. Drop it into a manuscript, a poster panel, or a lecture slide, and edit the labels later without rebuilding the figure from scratch.
What is a histogram?
A histogram is a chart that groups continuous measurements into bins and draws adjacent bars whose heights show how many values fall in each bin. It reveals the shape of a distribution — whether the data are symmetric, skewed, or bimodal — in a way a table of numbers cannot. Upload the individual measurements that make up your distribution. Choose the column mappings in SciFig DataChart (data-driven charts) and generate the plot from your table.
Why you need a histogram
- Reveal the shape of a distribution that summary statistics like the mean conceal
- Check whether data are approximately normal before applying a parametric test
- Expose skew, outliers, and bimodality that suggest a mixed population
- Communicate spread and central tendency to readers in a single panel
- Compare the distribution of a control group against a treatment group
- Meet journal expectations for showing raw data rather than only averages
Key components of a histogram
- Bins — equal-width intervals that divide the measured range into groups
- Frequency axis — the vertical scale counting observations in each bin
- Measured-variable axis — the horizontal scale carrying values and units
- Adjacent bars — touching rectangles that signal a continuous underlying scale
- Bin width — the interval size that controls how much structure is visible
- Optional density curve — a fitted line overlaid to compare against a normal distribution
Where histograms are used
- Results sections showing the distribution of a measured variable
- Quality control reports tracking process variation over a production run
- Statistics and biostatistics teaching on distributions and sampling
- Exploratory data analysis before selecting a statistical model
- Conference posters presenting participant or specimen characteristics
- Thesis chapters documenting measurement spread across experimental groups
How to make a histogram
Upload your table
Upload a CSV or Excel file with the measurements and column names needed for your chart.
Set up the chart and analysis
Choose a chart type, then set the column mapping, units, filters and statistical options; SciFig DataChart plots every value from your table.
Download your results
Export the chart and analysis files, or convert the result to SVG for editing in SciFig Vector Canvas.
Free Histogram Maker — Frequently Asked Questions
Common questions about Free Histogram Maker.
More tools
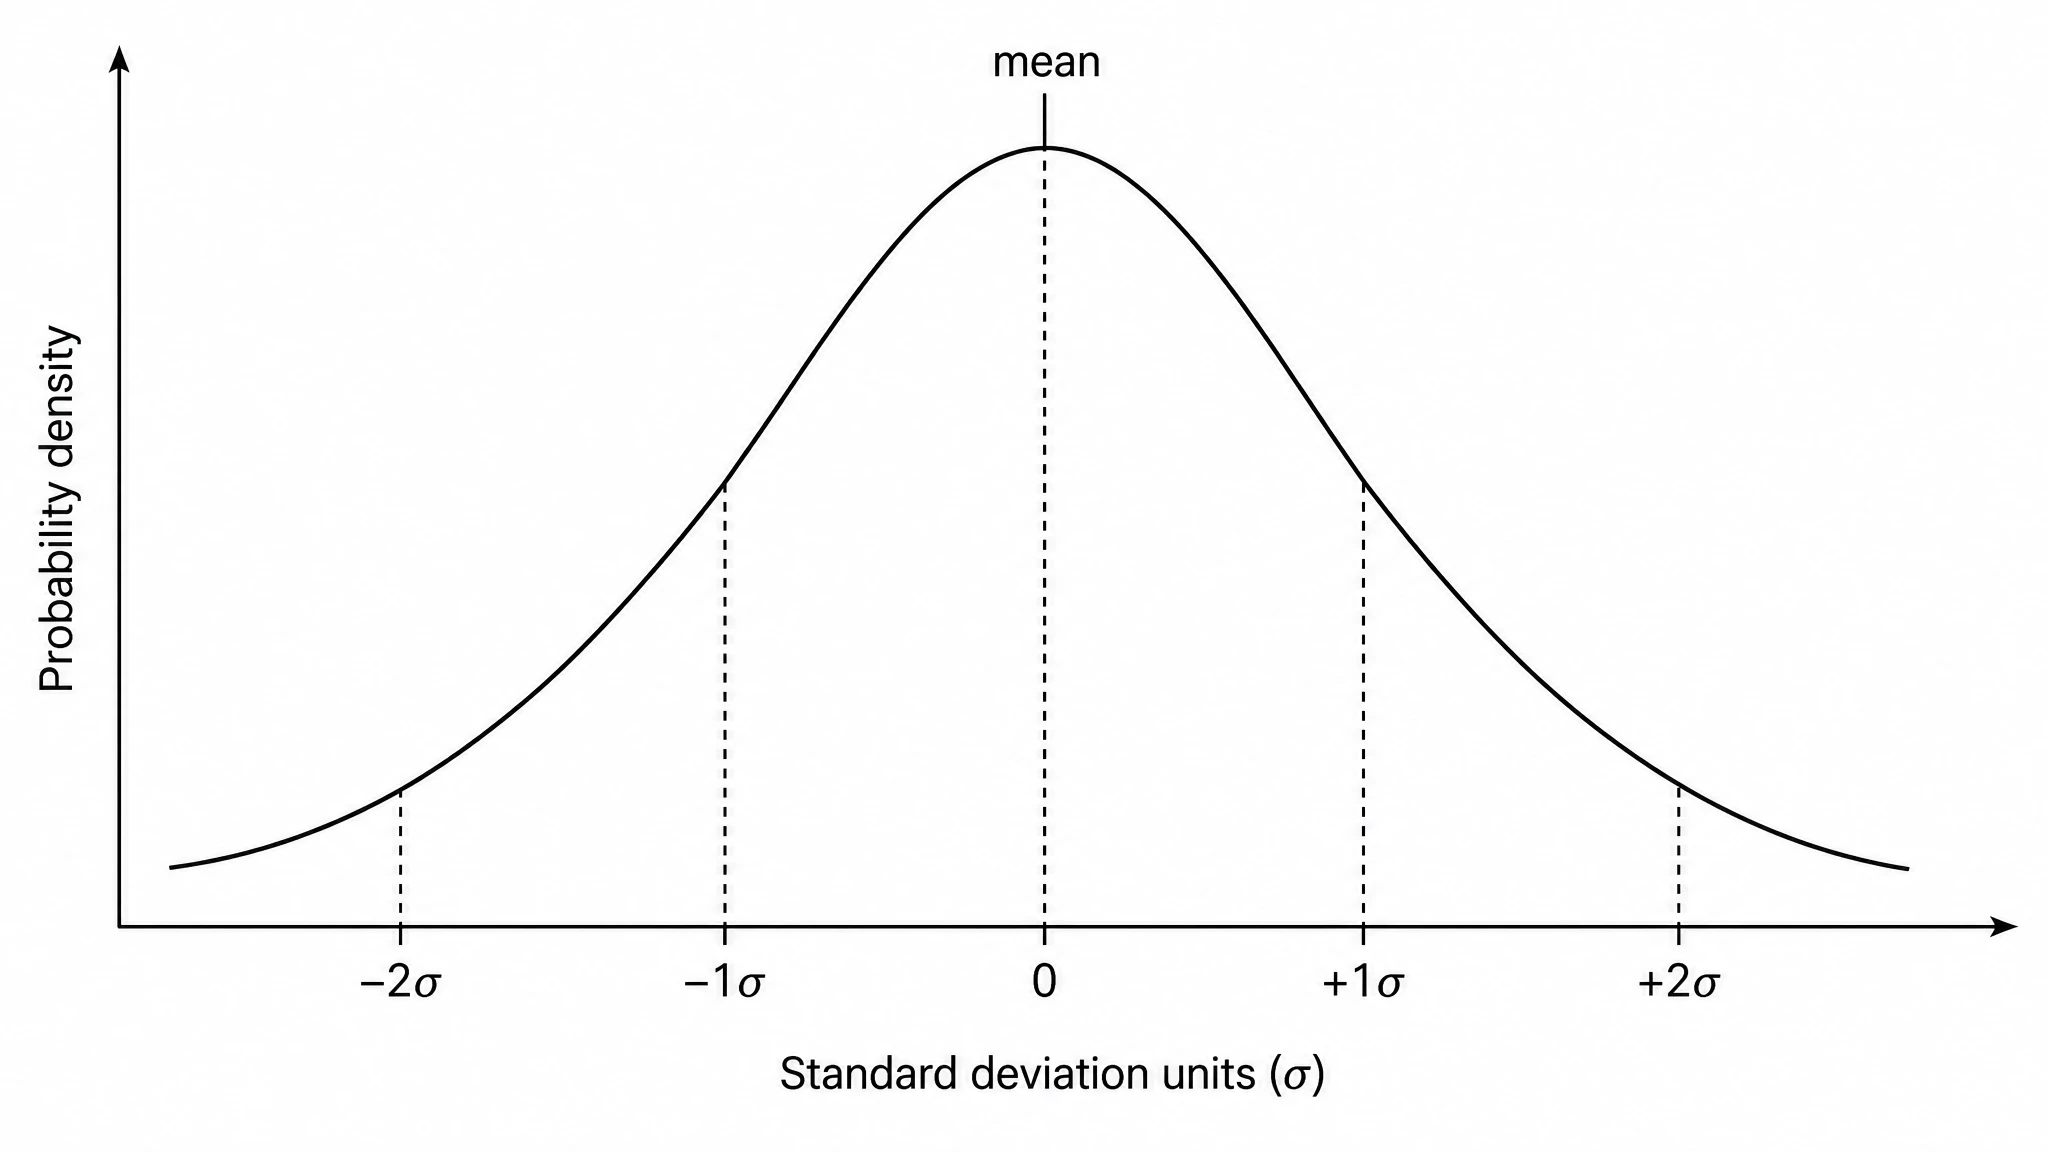
Bell Curve Generator
Plot a normal distribution curve

Circuit Diagram Maker
Draw electronic circuit schematics

Free Body Diagram Generator
Show forces acting on an object
SciFig
Free AI Scientific Figure Generator for Illustrations, Images, Charts and Flowcharts
Models
Default to GPT Image 2 for journal papers; switch to Nano Banana Pro for slides and posters; pick Nano Banana 2.1 for routine figure work
Tutorials
Seven short walkthroughs of the AI scientific figure generator
Blog
Tutorials, tool comparisons, and publication tips for researchers.
Inspiration
Explore publication-ready illustrations, charts and flowcharts. Copy a prompt or open any template as the starting point for your own figure.
Pricing
View pricing

Ready to publish?
Make your own histogram in minutes.
Start for freeFree to start · No credit card required · Built for researchers