Sequence Diagram Generator
Create precise sequence diagrams with actors, lifelines, and message flows — using SciFig's AI sequence diagram generator for research and technical papers.
Figure prompt
Core Subject (e.g., Cas9 protein cutting DNA)
Action / Details (e.g., Double strand break, detailed molecular view)
Start with 100 free credits|No credit card required
Get up to 300 free credits on day one when you join through an invite.
Reviewed by SciFig TeamUpdated
Sequence Diagram Generator— templates & examples
Everything you need to create a publication-ready sequence diagram
Actors, lifelines, and messages from plain language
Describe your interaction scenario in natural language — name your participants, list the messages they send in order, and specify synchronous or asynchronous call types — and SciFig's sequence diagram generator renders a complete UML sequence diagram with vertical lifelines, labeled horizontal message arrows, activation bars, and return messages. The figure uses standard UML notation throughout, meeting the format expected in software engineering and systems research publications.
Full editing and UML notation support
Every sequence diagram generated by SciFig's sequence diagram maker stays fully editable. Rename participants, add or reorder messages, introduce combined fragments (loops, alternatives, optional blocks), or adjust the layout after generation. The sequence diagram generator is designed for iterative documentation — refine your interaction model through review cycles and export a final figure that meets the visual standards of IEEE, ACM, and Springer venues.
Built for software engineering and systems research
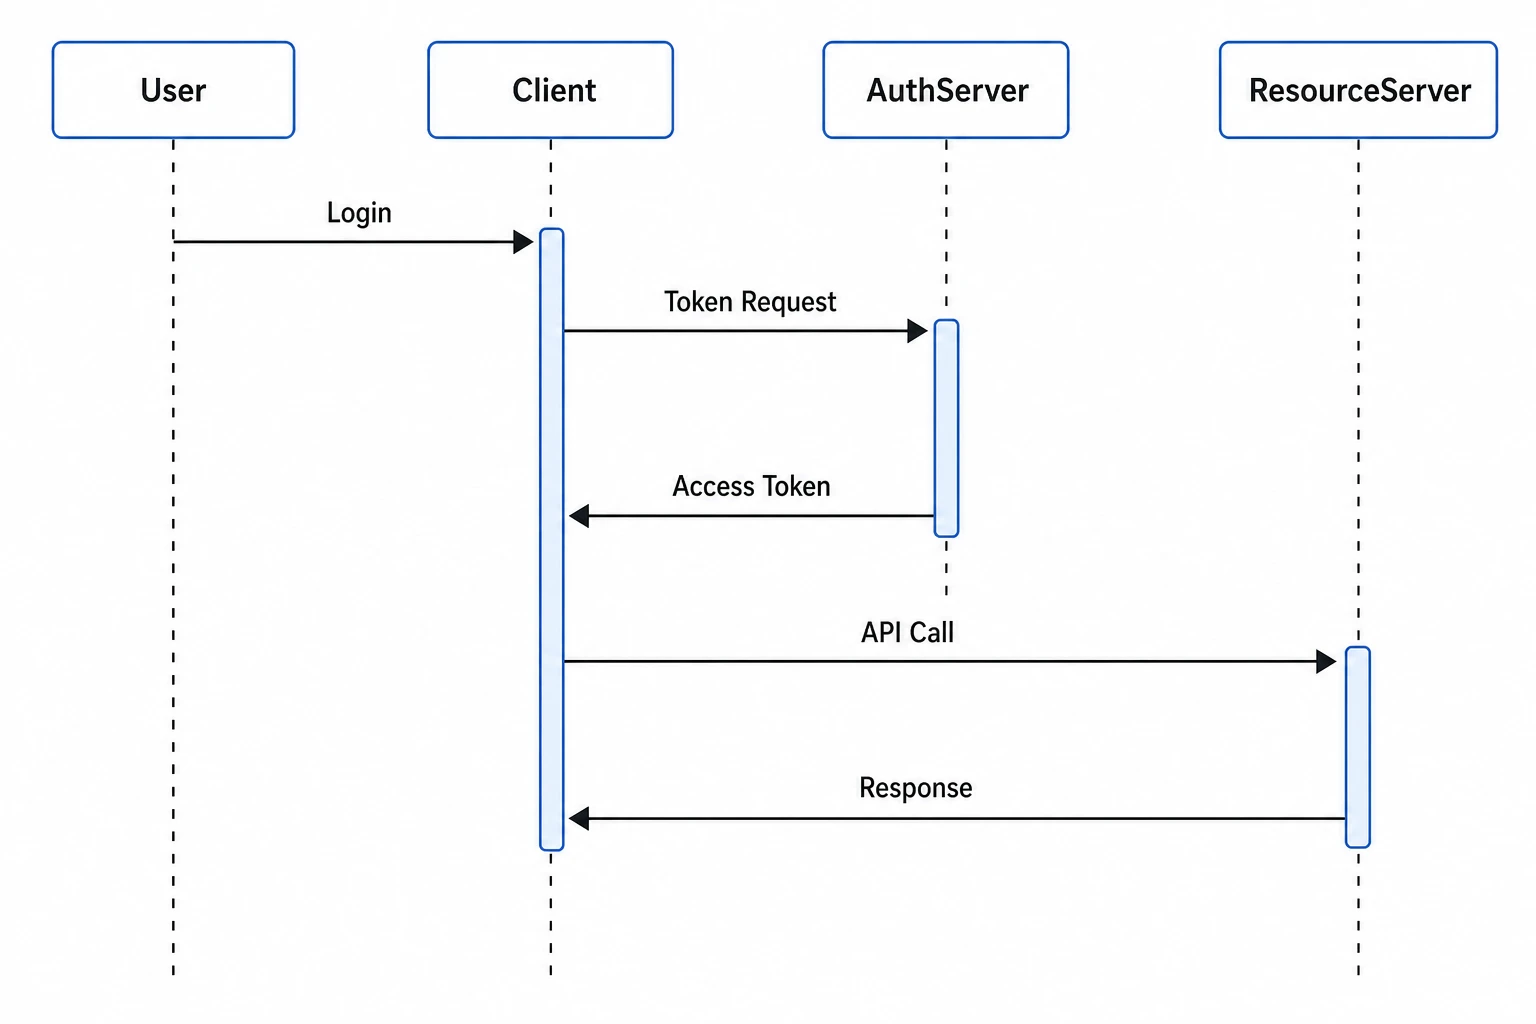
From client-server authentication flows in security papers to microservice interaction diagrams in distributed systems research to API documentation sequence diagrams for technical reports, SciFig's sequence diagram generator produces figures at the publication quality that conference and journal reviewers expect. Export high-resolution sequence diagrams for any publication venue — with clean lifelines, legible message labels, and properly styled synchronous and asynchronous arrows.
What is a sequence diagram?
A sequence diagram is a UML behavioral diagram that shows the chronological order of messages exchanged between actors over time, with each participant drawn as a vertical lifeline and messages as horizontal labeled arrows arranged top to bottom in time order. With SciFig's sequence diagram generator you describe your actors and messages in plain language and receive a clean, labeled figure suitable for software engineering, networking, and API documentation research papers.
Why sequence diagrams are essential in software and systems research
- Communicate multi-party interaction scenarios clearly without requiring readers to trace source code
- Document API call flows, protocol message exchanges, and system use case interactions in a single figure
- Required in software engineering and distributed systems papers to show component communication
- Make the temporal order of messages and the responsibilities of each participant immediately visible
- Enable peer reproducibility by providing a precise behavioral specification of system interactions
- Serve as the authoritative interaction model in security, networking, and HCI research
Key elements of a sequence diagram
- Participants — boxes at the top of the diagram representing actors, objects, services, or system components
- Lifelines — vertical dashed lines below each participant indicating their presence over the interaction timeline
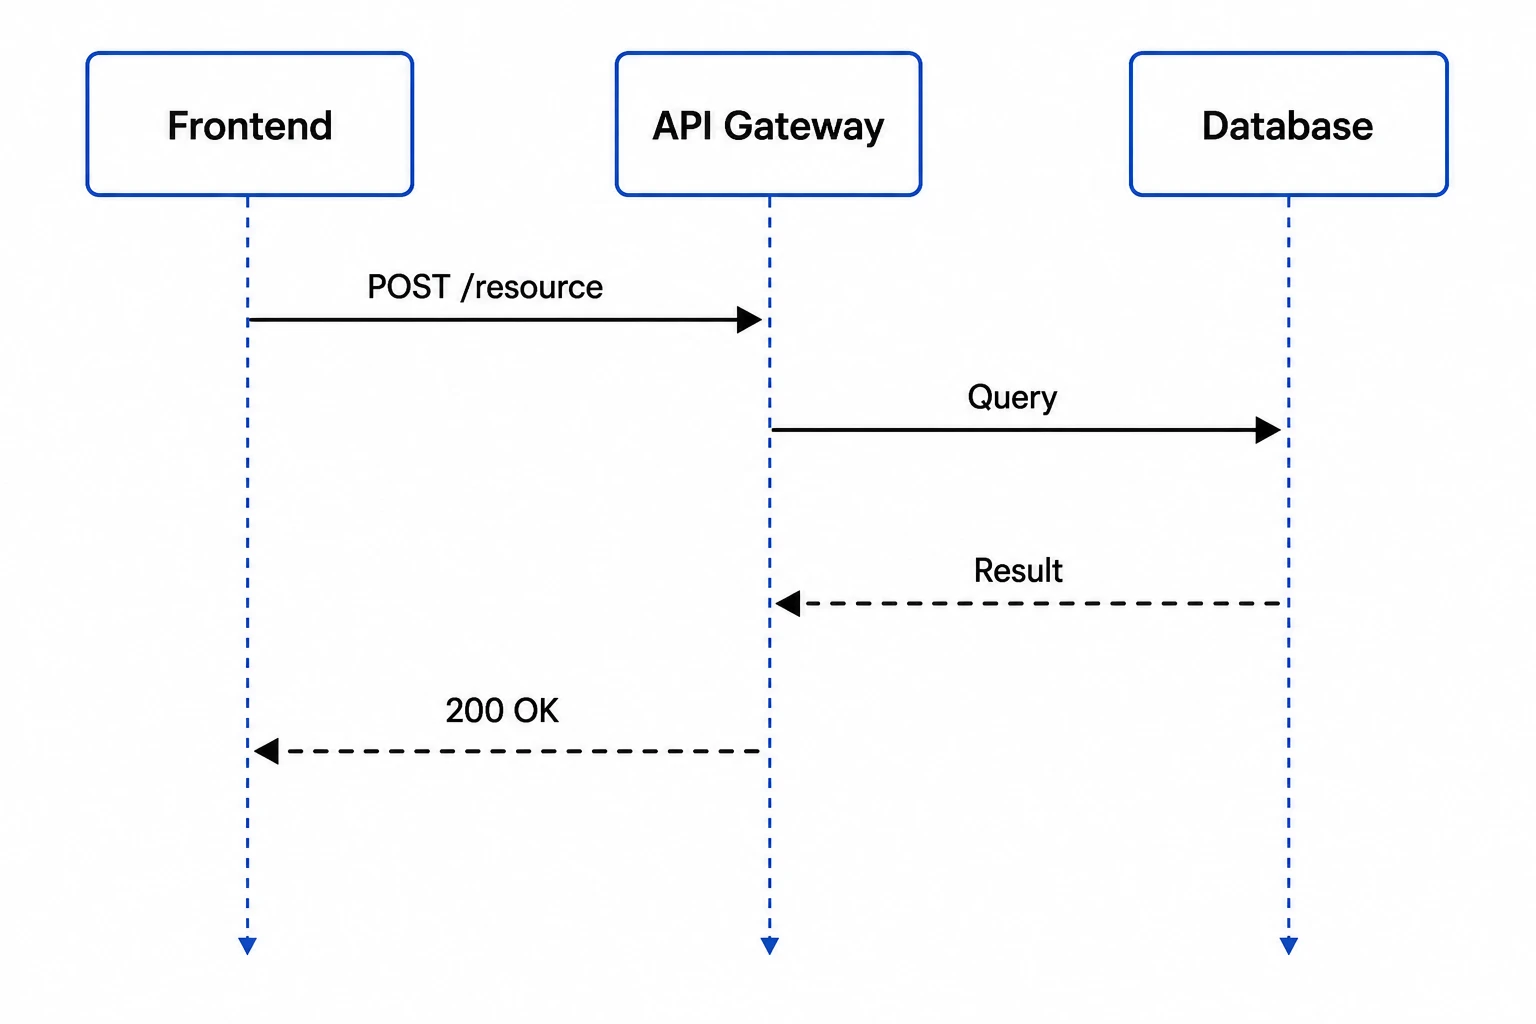
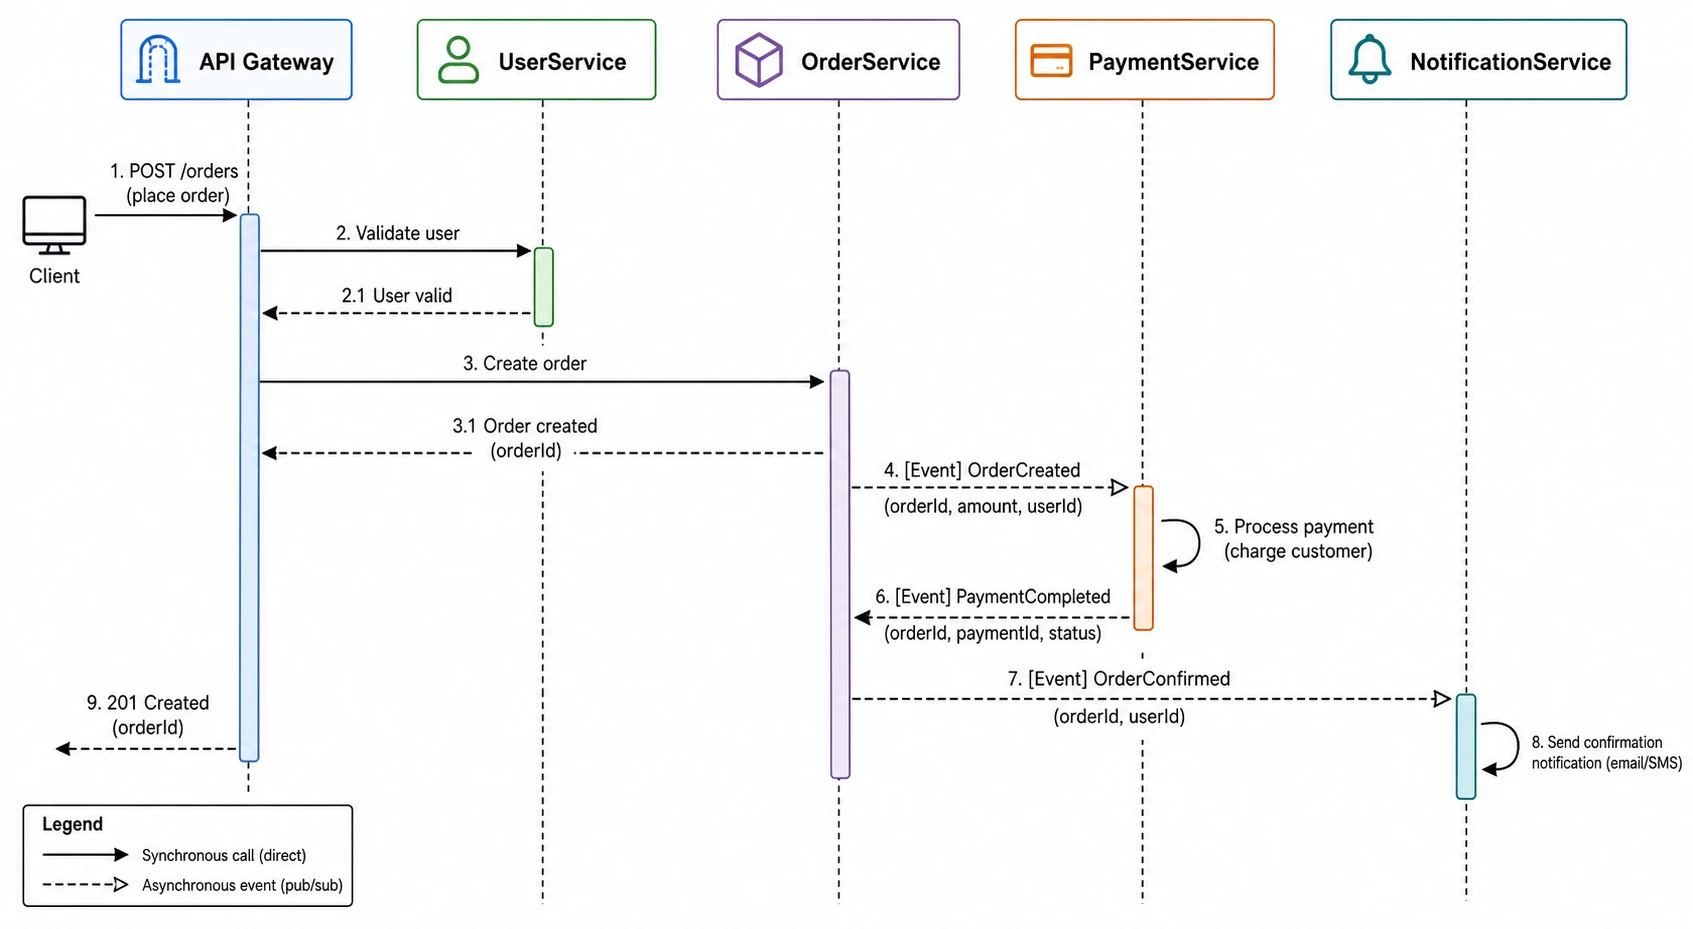
- Synchronous messages — solid arrows with filled heads indicating a call that blocks the sender until a return is received
- Asynchronous messages — open-headed arrows indicating a send-and-continue operation with no wait
- Return messages — dashed arrows indicating the response or return value from a called participant
- Activation bars — narrow rectangles on lifelines showing the period during which a participant is actively executing
Where sequence diagrams appear in research and documentation
- Software engineering papers documenting system interaction scenarios and use case realizations
- Distributed systems and microservices research showing inter-service message flows and communication patterns
- Network protocol papers illustrating handshake, authentication, and data exchange message sequences
- Security research papers documenting OAuth, TLS, and custom authentication protocol flows
- API documentation showing the sequence of calls between client, server, and third-party services
- Human-computer interaction papers modeling multi-actor workflows and system event sequences
How to make a sequence diagram
Describe your sequence diagram
Tell SciFig what to draw in plain language — no design tools required.
Generate with SciFig
Get a clean, publication-ready figure that matches your description in seconds.
Edit & export
Vectorize it into editable SVG, relabel everything, and export for your paper, poster, or slides.
Sequence Diagram Generator — Frequently Asked Questions
Common questions about Sequence Diagram Generator.
More tools

Conceptual Framework Generator
Create professional conceptual framework diagrams showing variable relationships, hypotheses, and theoretical models for your research.

Free Body Diagram Generator
Create accurate, publication-ready free body diagrams with labeled force vectors for weight, normal force, friction, and tension in seconds.

Bell Curve Generator
Generate a precise, fully labeled bell curve showing mean, standard deviations, and percentile regions — ready to export for your paper, thesis, or classroom.
Related links
Home
Turn text, sketches, references, PDFs, and photos into Scientific Figures
Text-to-Figure
Generate a figure from a plain-language description
Models
Default to GPT Image 2 for journal papers; switch to Nano Banana Pro for slides and posters; pick Nano Banana 2 for routine figure work
Tutorials
Seven short walkthroughs of the AI scientific figure generator
Blog
Tutorials, tool comparisons, and publication tips for researchers.
Inspiration
Explore publication-ready scientific figure examples, copy the prompts, and use them as starting points for your own work.

Ready to publish?
Make your own sequence diagram in minutes.
Start for freeFree to start · No credit card required · Built for researchers