SciFig

Free Complement System Diagram Generator

Select complement pathways and follow their convergence at C3, C5 and the membrane attack complex in one labeled mechanism figure.

Describe what you need in the box above.

Start with up to 150 free credits|No credit card required

Get up to 350 free credits on day one when you join through an invite.

3 figure engines · 500+ templatesEvery label editable · 60+ color schemesEditable PPTX · Layered SVG · 8K PNG / JPG

Free Complement System Diagram Generator— templates & examples

Updated

Complement system diagram tools

Free Complement System Diagram Generator

Select complement pathways and follow their convergence at C3, C5 and the membrane attack complex in one labeled mechanism figure.

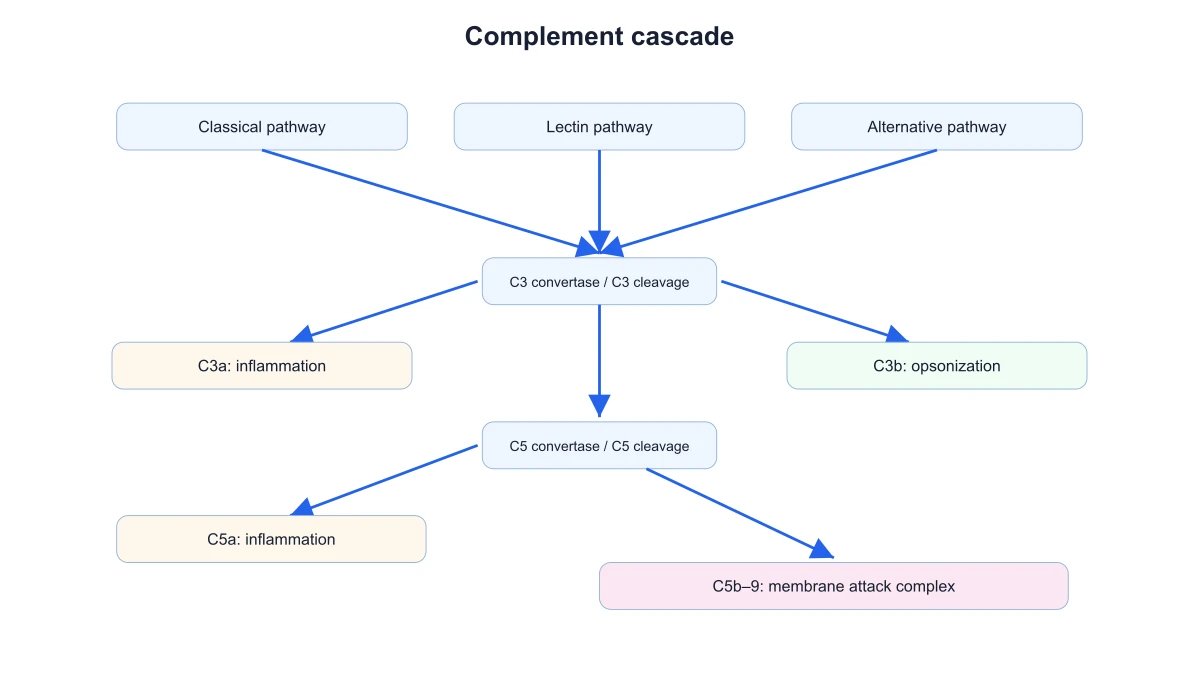
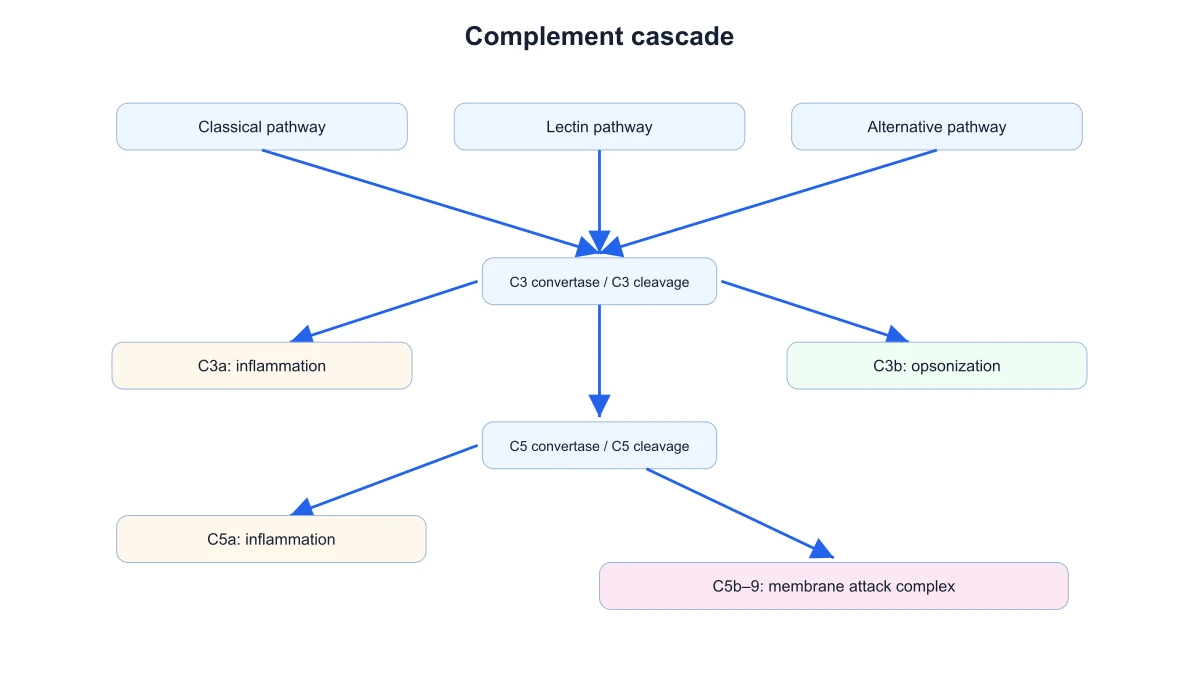
A complement system diagram shows classical, lectin and alternative pathways converging on shared complement components. Select complement pathways and follow their convergence at C3, C5 and the membrane attack complex in one labeled mechanism figure.

Classical, lectin and alternative complement pathways converging on shared C3, C5 and MAC stages
  • Show the classical pathway
  • Choose the visible branches
  • Use shared C3 nodes
  • Identify the terminal MAC stage

Complement System Diagram Features

SciFig’s complement system diagram brings the inputs, diagram choices and exported result into one focused tool.

Compare the three activation pathways

Display classical, lectin and alternative complement activation in one overview. Each branch retains its initiating context before reaching the shared downstream cascade. This side-by-side organization helps a reader distinguish pathway initiation from the common components that follow.

  • Show the classical pathway
  • Show the lectin pathway
  • Show the alternative pathway
Compare the three activation pathways

Focus on a selected complement branch

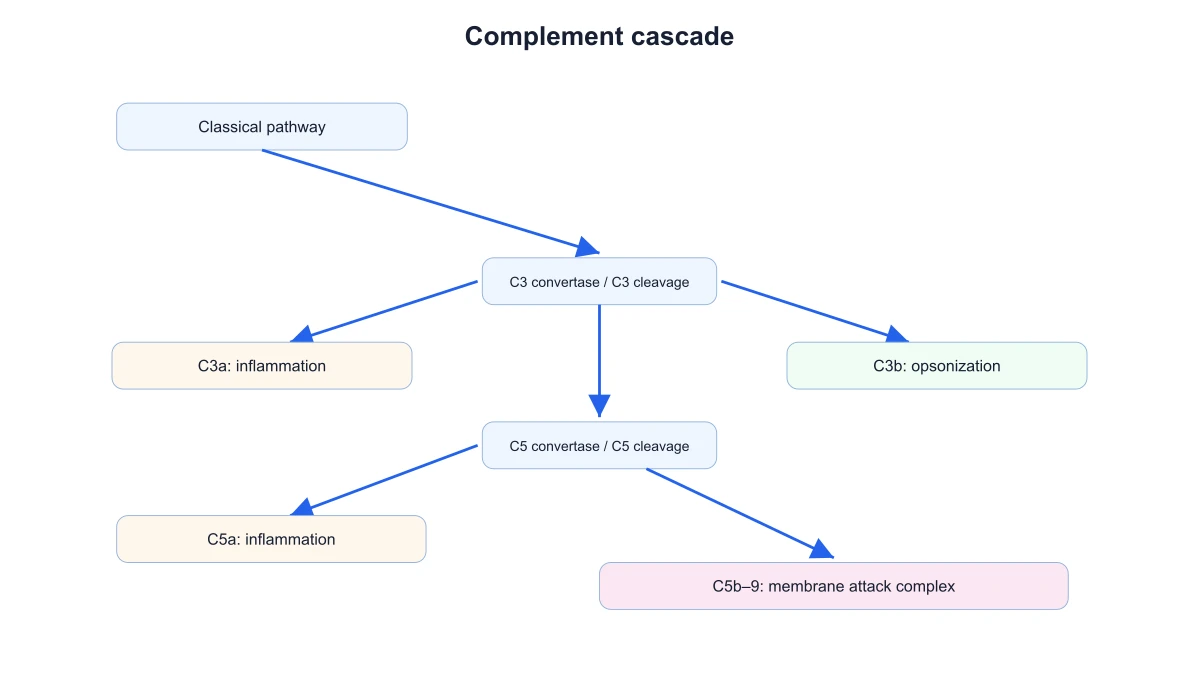
Turn individual pathways on or off when the explanation concerns one route. A classical-pathway lesson can keep its branch visible without carrying the other initiating stages into every discussion. The shared downstream components stay connected to the selected route instead of becoming separate duplicated cascades.

  • Choose the visible branches
  • Keep initiating stages distinct
  • Retain the connected downstream cascade
Focus on a selected complement branch

Follow convergence through C3 and C5

Show the common C3 and C5 stages once, even when several initiating routes are visible. The shared geometry makes convergence explicit and avoids presenting three independent terminal cascades. Label these nodes so that the figure can connect the overview with a more detailed discussion of complement mechanisms.

  • Use shared C3 nodes
  • Use shared C5 nodes
  • Keep branch convergence visible
Follow convergence through C3 and C5

Show the terminal membrane attack complex

Use SciFig’s complement system diagram to retain the terminal MAC stage after the common cascade and choose the labels needed for your explanation. Export SVG or PNG with the selected branches and shared nodes. The resulting mechanism figure organizes complement activation rather than simulating reaction rates or predicting clinical outcomes.

  • Identify the terminal MAC stage
  • Edit complement labels
  • Download the pathway figure
Show the terminal membrane attack complex

How to Create the Figure

Use the complement system diagram controls below to prepare the figure from your selected mechanism and labels.

  1. Choose a complement pathway view

    Start with all three initiating pathways for an overview or a focused branch preset. The classical, lectin and alternative routes lead toward shared downstream components. Choose the starting view according to whether your material compares initiation routes or follows a single route.

  2. Select the initiating branches

    Use the classical, lectin and alternative pathway controls to choose the visible branches. C3, C5 and the terminal MAC stage remain shared downstream. The preview lets you follow the selected initiation route without drawing separate copies of the common cascade.

  3. Edit the title and labels

    Enter a descriptive title and replace the node or structure labels with the terminology used in your document. The preset retains its arrangement while the visible names change. Keep molecular abbreviations consistent with the explanation beside the figure.

  4. Download the labeled figure

    Choose SVG for a scalable vector figure or PNG for a slide, handout or document. The exported diagram retains the selected view and labels. Keep the figure alongside the corresponding explanation so later wording changes can be reflected in another export.

Complement System Diagram Uses

Use a labeled complement system diagram to connect the explanation in your material with a visible figure.

Classical, lectin and alternative complement pathways converging on shared C3, C5 and MAC stages

Introduce complement in immunology

Use the three-pathway overview to introduce complement activation before describing individual proteins. Show how distinct initiating routes reach shared downstream components. A labeled PNG gives students a reference figure that can accompany the explanation in lecture notes or a handout.

Explore this example
Classical complement pathway connected to the shared C3, C5 and membrane attack complex stages

Explain classical pathway initiation

Select the classical branch for a focused discussion, then retain the common C3, C5 and MAC stages downstream. This keeps the pathway connected to its outcome without filling the slide with other initiating routes. Add the labels used in the accompanying course material.

Explore this example
Classical, lectin and alternative complement pathways converging on shared C3, C5 and MAC stages

Compare lectin and alternative pathways

Place both selected branches in one figure to discuss their different initiating contexts and shared cascade. The common nodes remain visible once. This helps a seminar audience compare the routes without mistaking repeated labels for separate terminal systems.

Explore this example
Shared C3 and C5 cleavage stages leading to the C5b–9 membrane attack complex after three complement pathways

Teach pathway convergence

A mechanism lesson can emphasize the points where distinct complement routes meet. Keep C3 and C5 labels visible and follow the common route toward MAC. The figure communicates convergence as a structural relationship rather than as a quantitative time course.

Explore this example
Shared C3 and C5 cleavage stages leading to the C5b–9 membrane attack complex after three complement pathways

Prepare an innate-immunity panel

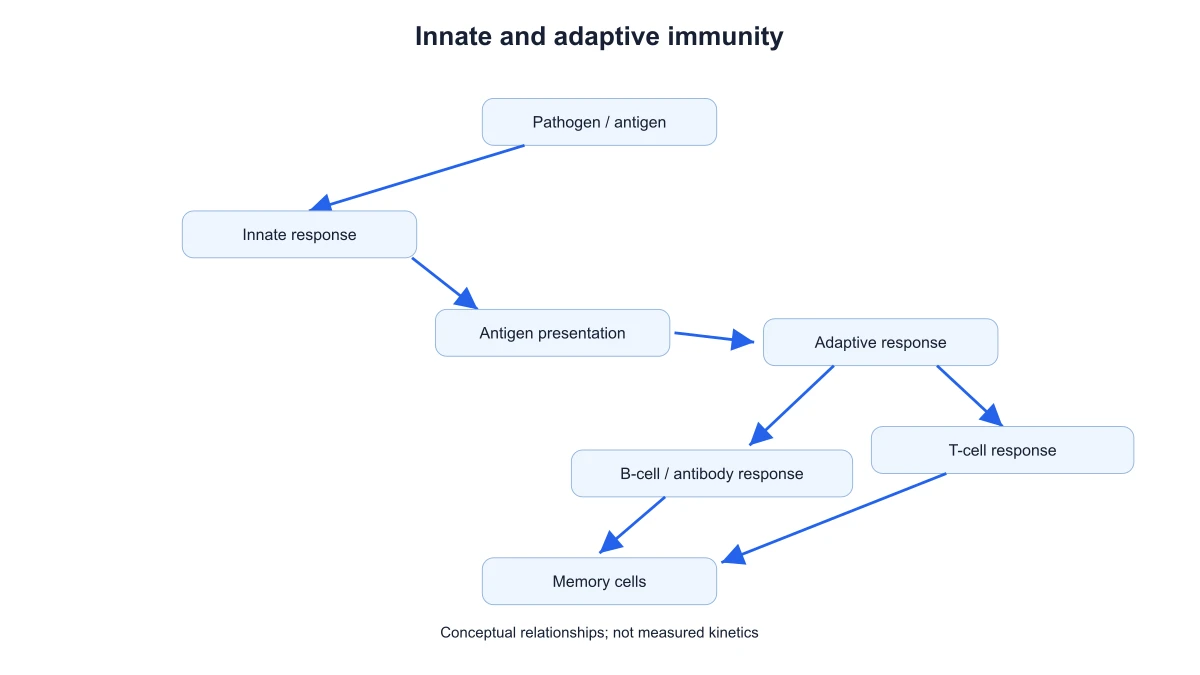
Export a complement schematic for a broader presentation about innate immunity. The selected branches provide mechanism detail, while a separate immune-response diagram can show how innate and adaptive processes relate. Each figure retains a clear role in the explanation.

Explore this example
Classical complement pathway connected to the shared C3, C5 and membrane attack complex stages

Connect antibodies with complement

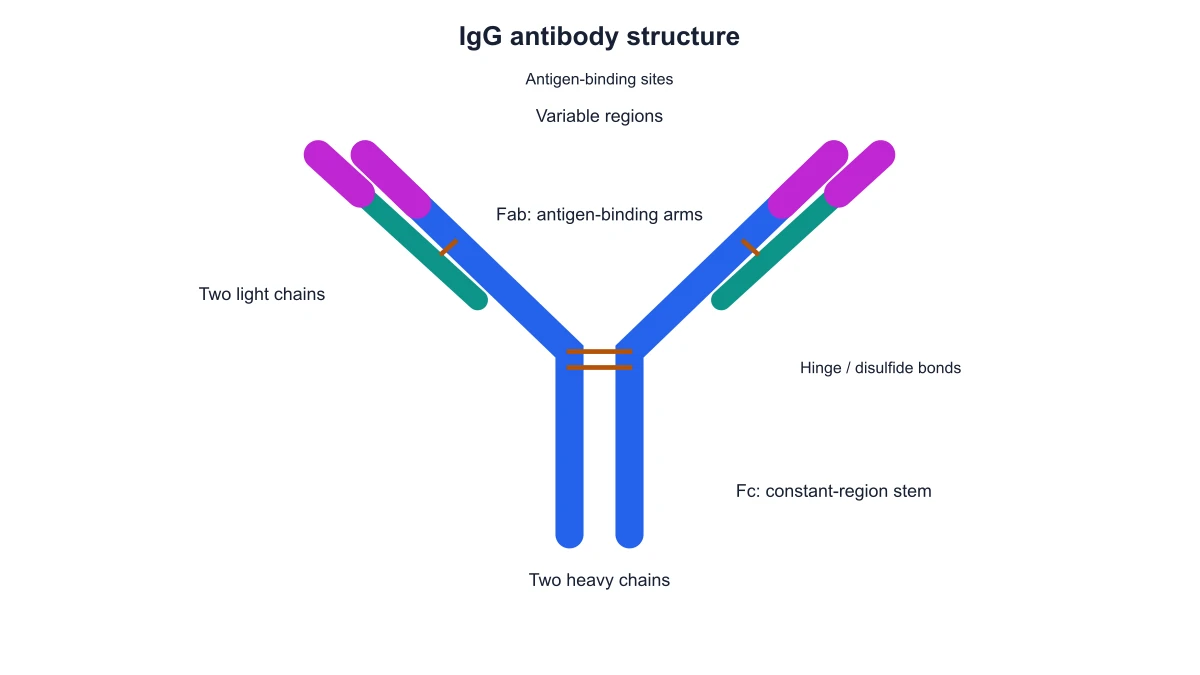
Use the complement diagram when discussing how antibody-associated classical activation connects with the common cascade. Pair it with an IgG structure figure when introducing antibody regions. The structure panel and pathway panel answer different questions without conflating complement with antibody variable-region terminology.

Explore this example
How Researchers Use SciFig

My introductory slide showed three separate terminal cascades, which made the pathways look unrelated. The complement system diagram kept C3, C5 and MAC shared after the initiating branches. I exported the combined view so students could compare the beginnings while following their convergence into the same downstream mechanism in the notes.

Lea C.

Immunology lecturer, University of Antwerp

Free tools

A tool for every scientific figure

120 focused generators for the scientific figure you need — each opens in the right workspace with a matching example.

Illustrations, structures and concept diagrams

60 tools
Chemistry Structure Generator example figureChemistry Structure GeneratorGraphical Abstract Maker example figureGraphical Abstract MakerFree Body Diagram Generator example figureFree Body Diagram GeneratorCircuit Diagram Maker example figureCircuit Diagram MakerAI Scientific Image Generator example figureAI Scientific Image GeneratorEditable 96-Well Plate example figureEditable 96-Well PlateLewis Dot Structure Generator example figureLewis Dot Structure GeneratorDNA Structure Diagram Generator example figureDNA Structure Diagram GeneratorWiring Diagram Maker example figureWiring Diagram MakerP&ID Diagram Generator example figureP&ID Diagram GeneratorScientific Poster Generator example figureScientific Poster GeneratorCladogram Maker example figureCladogram MakerFood Web Maker example figureFood Web MakerMedical Illustration Generator example figureMedical Illustration GeneratorPCR Diagram Generator example figurePCR Diagram GeneratorPPT Text to Visual Converter example figurePPT Text to Visual ConverterMitosis Diagram Generator example figureMitosis Diagram GeneratorAI Infographic Generator example figureAI Infographic GeneratorAnatomical Drawing Generator example figureAnatomical Drawing GeneratorAnimal and Plant Cell Comparison example figureAnimal and Plant Cell ComparisonAnimal Cell Diagram Generator example figureAnimal Cell Diagram GeneratorAntibody Structure Diagram Generator example figureAntibody Structure Diagram GeneratorApoptosis Diagram Generator example figureApoptosis Diagram GeneratorBacteria Diagram Generator example figureBacteria Diagram GeneratorBlueprint Maker example figureBlueprint MakerBohr Model Maker example figureBohr Model MakerCalvin Cycle Diagram Generator example figureCalvin Cycle Diagram GeneratorCarbon Cycle Diagram Generator example figureCarbon Cycle Diagram GeneratorCell Cycle Diagram Generator example figureCell Cycle Diagram GeneratorCellular Respiration Diagram Generator example figureCellular Respiration Diagram GeneratorComplement System Diagram Generator example figureComplement System Diagram GeneratorCRISPR-Cas9 Diagram Generator example figureCRISPR-Cas9 Diagram GeneratorDNA Replication Diagram Generator example figureDNA Replication Diagram GeneratorElectron Configuration Diagram Generator example figureElectron Configuration Diagram GeneratorElectron Transport Chain Diagram Generator example figureElectron Transport Chain Diagram GeneratorGene Regulation Diagram Generator example figureGene Regulation Diagram GeneratorGlycolysis Diagram Generator example figureGlycolysis Diagram GeneratorImage to Editable SVG Converter example figureImage to Editable SVG ConverterImmune Response Diagram Generator example figureImmune Response Diagram GeneratorKrebs Cycle Diagram Generator example figureKrebs Cycle Diagram GeneratorLab Diagram Maker example figureLab Diagram MakerMeiosis Diagram Generator example figureMeiosis Diagram GeneratorMolecular Orbital Diagram Generator example figureMolecular Orbital Diagram GeneratorNitrogen Cycle Diagram Generator example figureNitrogen Cycle Diagram GeneratorPedigree Chart Maker example figurePedigree Chart MakerPhospholipid Diagram Generator example figurePhospholipid Diagram GeneratorPhosphorus Cycle Diagram Generator example figurePhosphorus Cycle Diagram GeneratorPhotosynthesis Diagram Generator example figurePhotosynthesis Diagram GeneratorPhylogenetic Tree Maker example figurePhylogenetic Tree MakerPhysics Vector Diagram Maker example figurePhysics Vector Diagram MakerPlant Cell Diagram Generator example figurePlant Cell Diagram GeneratorProtein Synthesis Diagram Generator example figureProtein Synthesis Diagram GeneratorPunnett Square Maker example figurePunnett Square MakerRay Diagram Maker example figureRay Diagram MakerScientific Color Palette Generator example figureScientific Color Palette GeneratorSignaling Pathway Diagram Generator example figureSignaling Pathway Diagram GeneratorSingle Line Diagram Generator example figureSingle Line Diagram GeneratorT-Cell Activation Diagram Generator example figureT-Cell Activation Diagram GeneratorWater Cycle Diagram Generator example figureWater Cycle Diagram GeneratorWestern Blot Diagram Generator example figureWestern Blot Diagram Generator
Complement System Diagram Questions

1.

2.

3.

4.

5.

6.

Call to action background

Complement system diagram

Create a complement system diagram

Create a complement system diagram

Free to start · No credit card required · Built for researchers