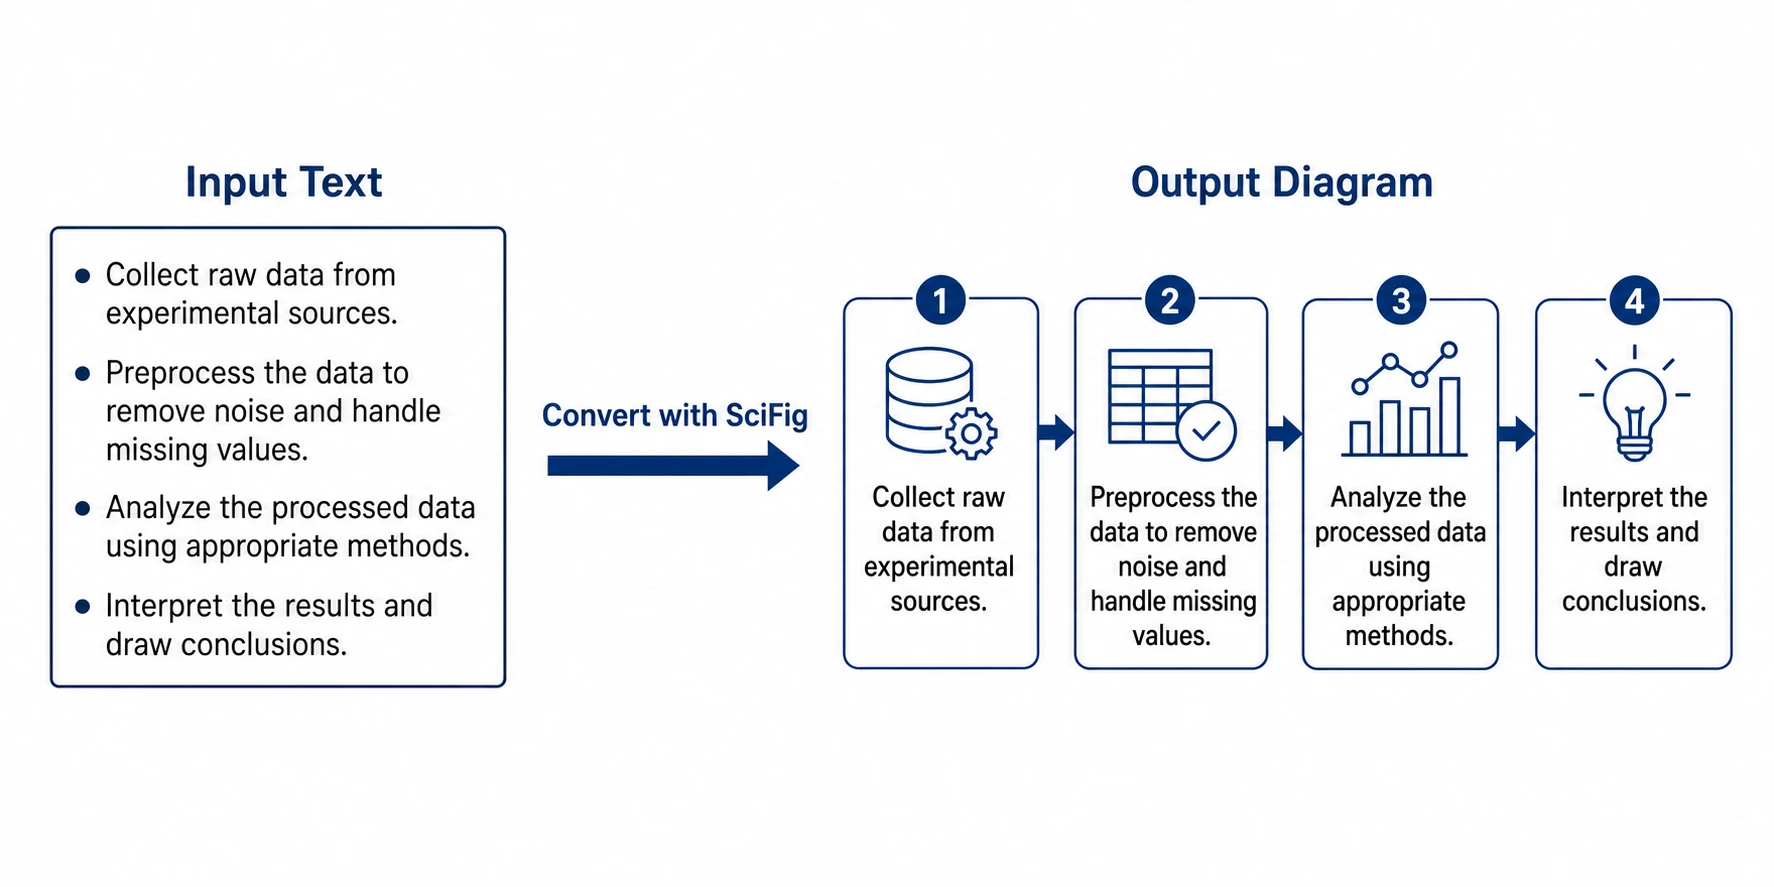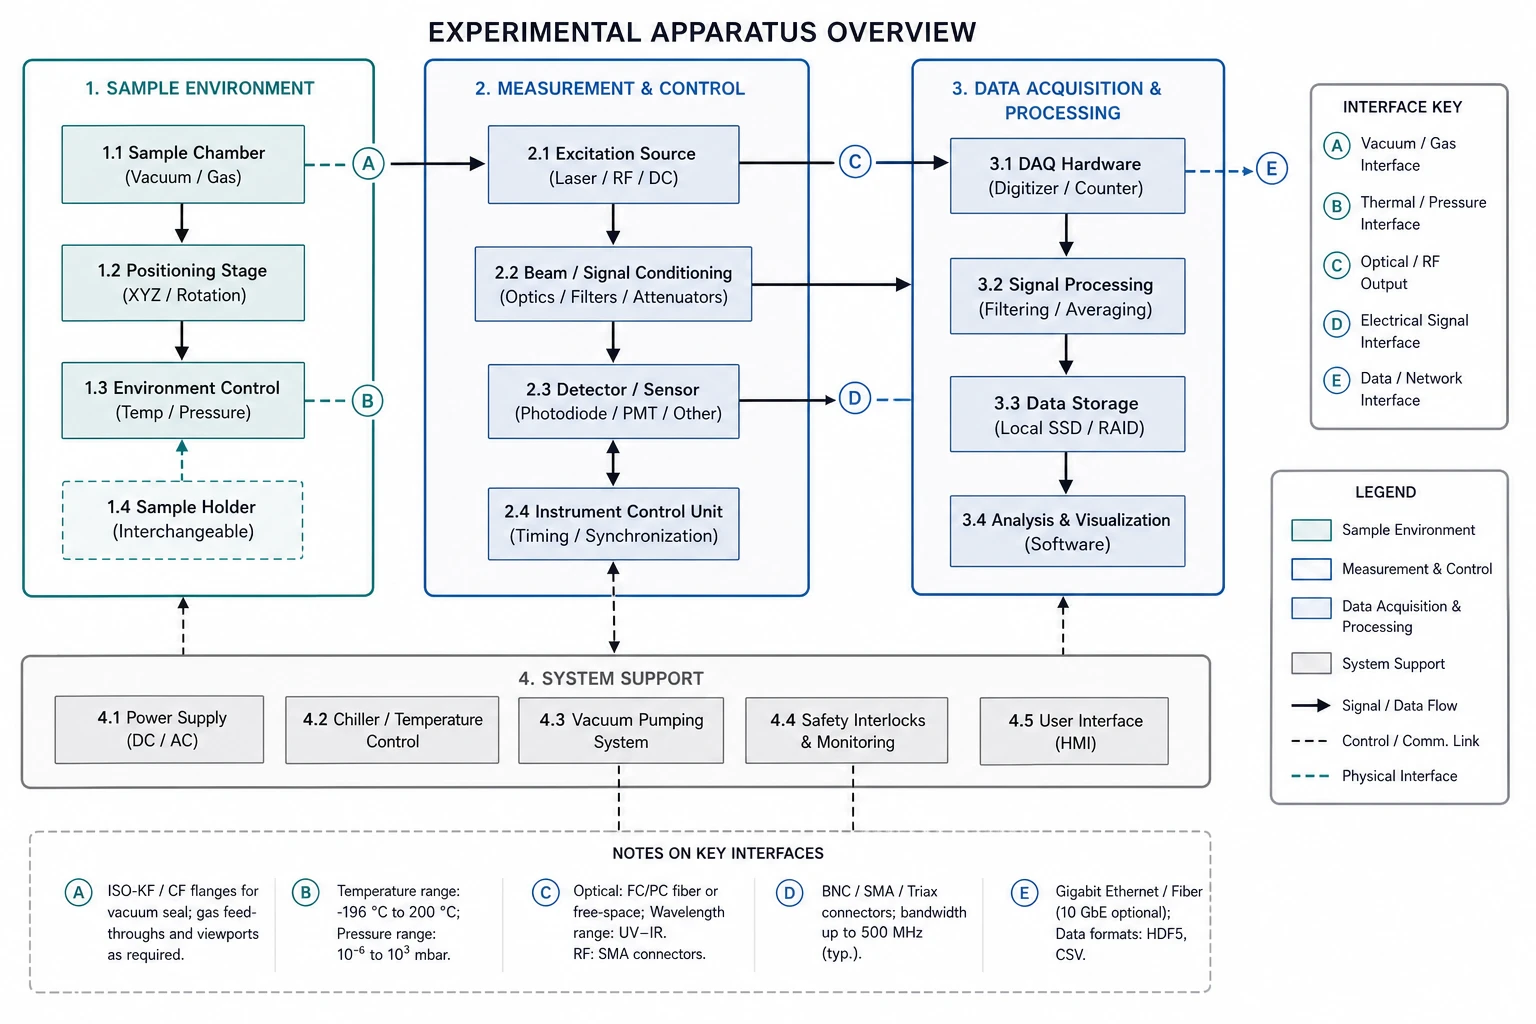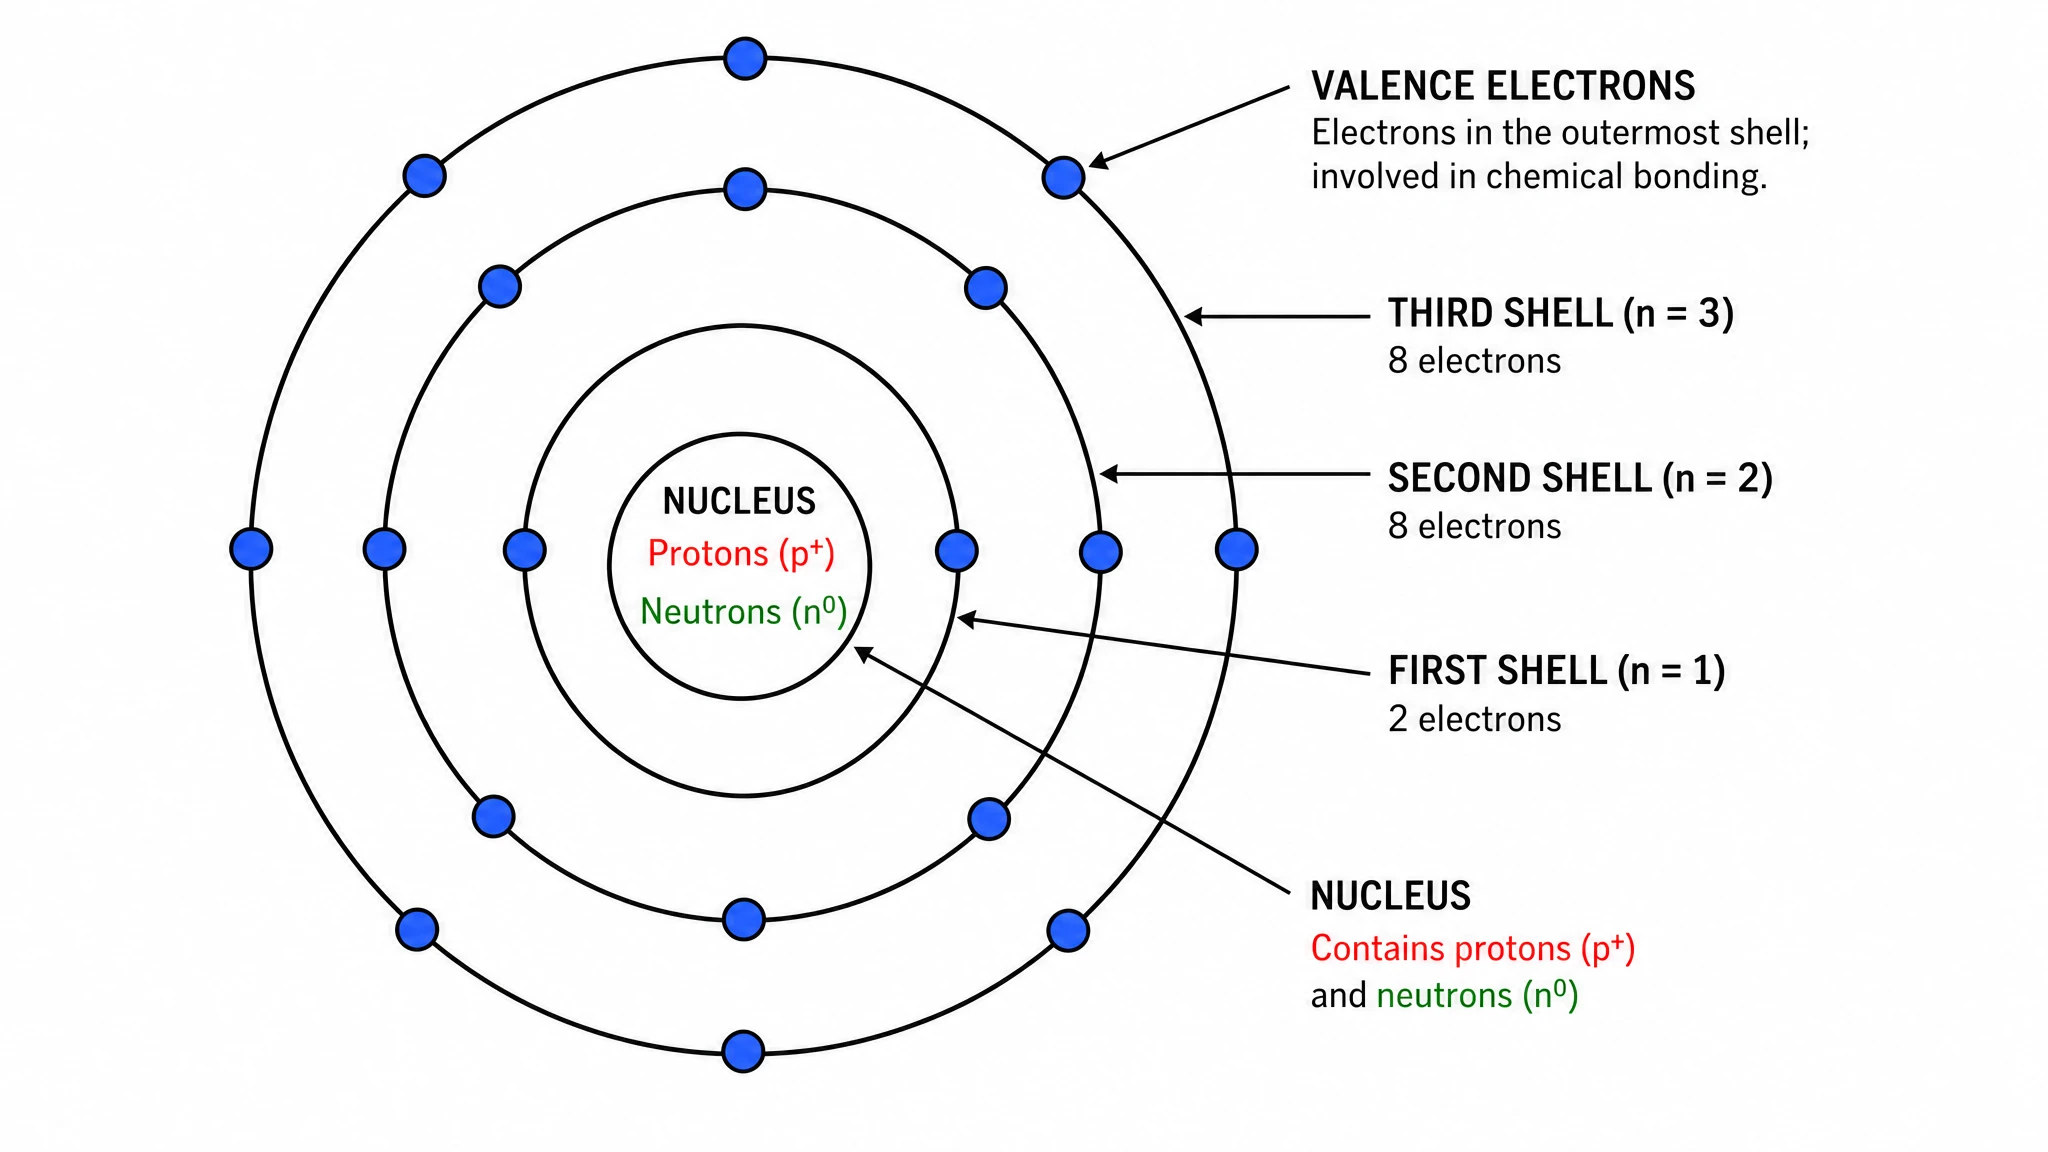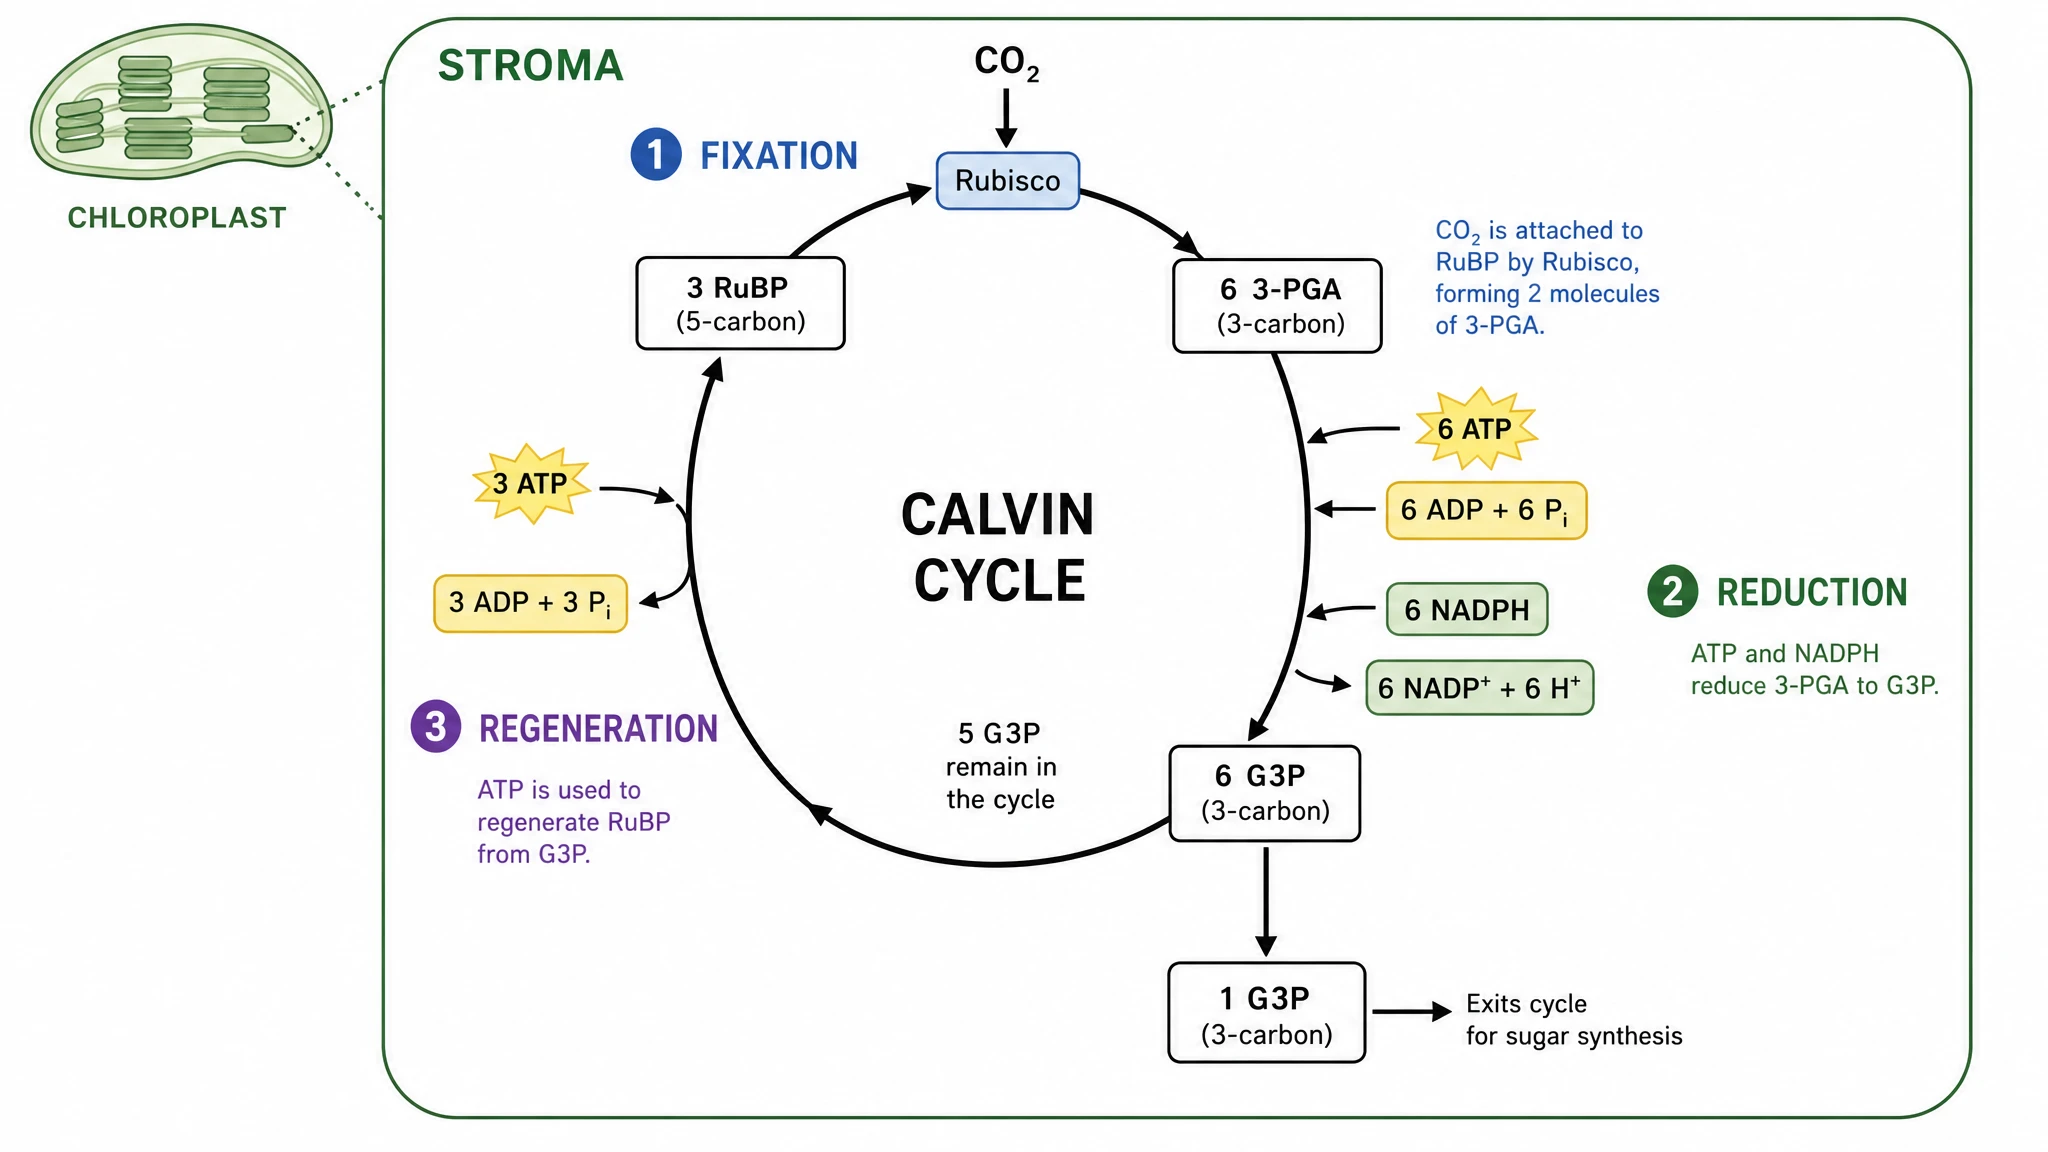
SciFig

Describe the scientific figure you need

Start from text, a sketch, a reference, a PDF, or a lab photo — publication-ready, every element editable.

Describe what you need in the box above.

Start with up to 150 free credits|No credit card required

Get up to 350 free credits on day one when you join through an invite.

3 figure engines · 500+ templatesEvery label editable · 60+ color schemesEditable PPTX · Layered SVG · 8K PNG / JPG

Free Number Line Maker for Math Teaching Diagrams— templates & examples

Updated

number line

Free Number Line Maker for Math Teaching Diagrams

Explain values and intervals with a number line made for your lesson.

A number line maker creates a visual diagram for explaining numbers and intervals. With SciFig, describe the range, tick labels, marked values and endpoint symbols you want, and Illustration generates an AI figure for your lesson or document. You can make a blank teaching axis, compare positive and negative values, show fractions between whole numbers or illustrate an interval with open and closed endpoints. The page focuses on AI number line diagrams; you can refine the figure and its labels in the editor and export it for a worksheet, slide or explanation.

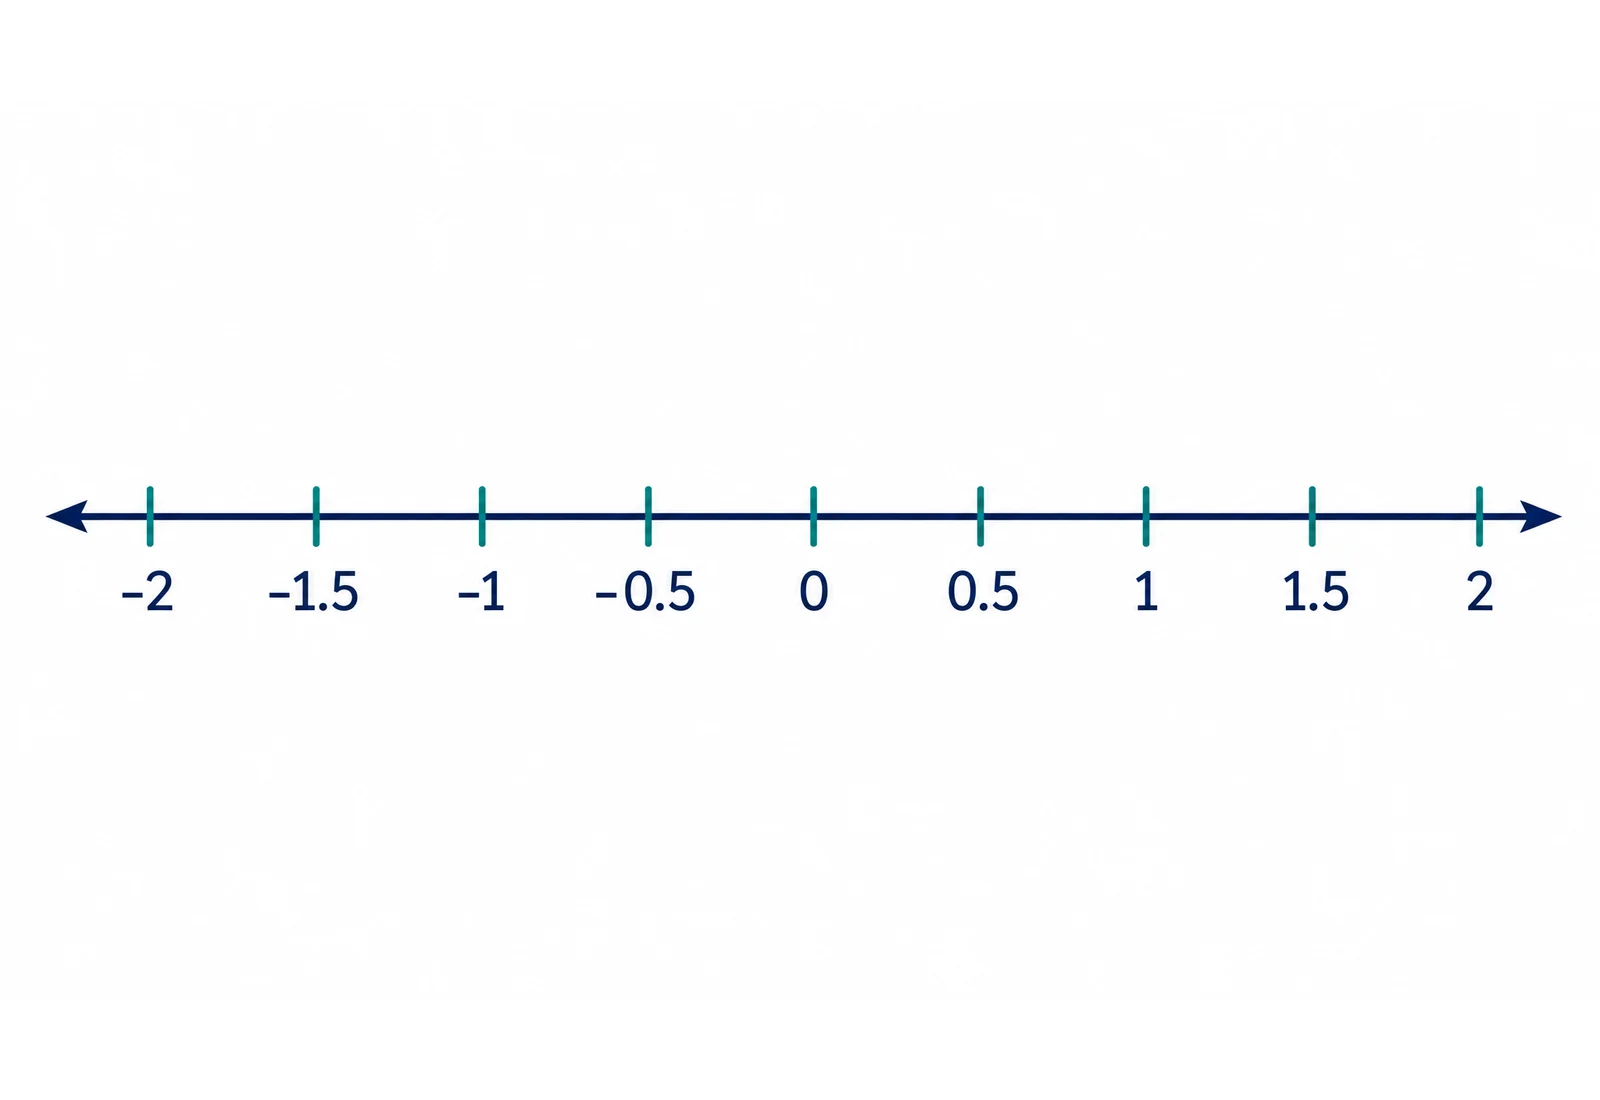
AI teaching number line from minus two to two with nine labeled half-step ticks and arrows at both ends
  • Describe the range and tick labels
  • Illustrate fractions and negative values
  • Show intervals with endpoint symbols
  • Refine the diagram for your document

Number Line Maker Features

Choose a structure that serves your explanation, with the labels and relationships supplied in your prompt.

Describe the range and tick labels

Tell the number line maker the start and end values and which numbers should appear as labels. A range from -2 to 2 with half-step labels can support a lesson on negative values and decimals. Specify the intended reading order and whether to include arrows, a zero label or highlighted points.

  • Choose a teaching range
  • List the tick labels
  • Highlight values with clear markers
Try this example

Illustrate fractions and negative values

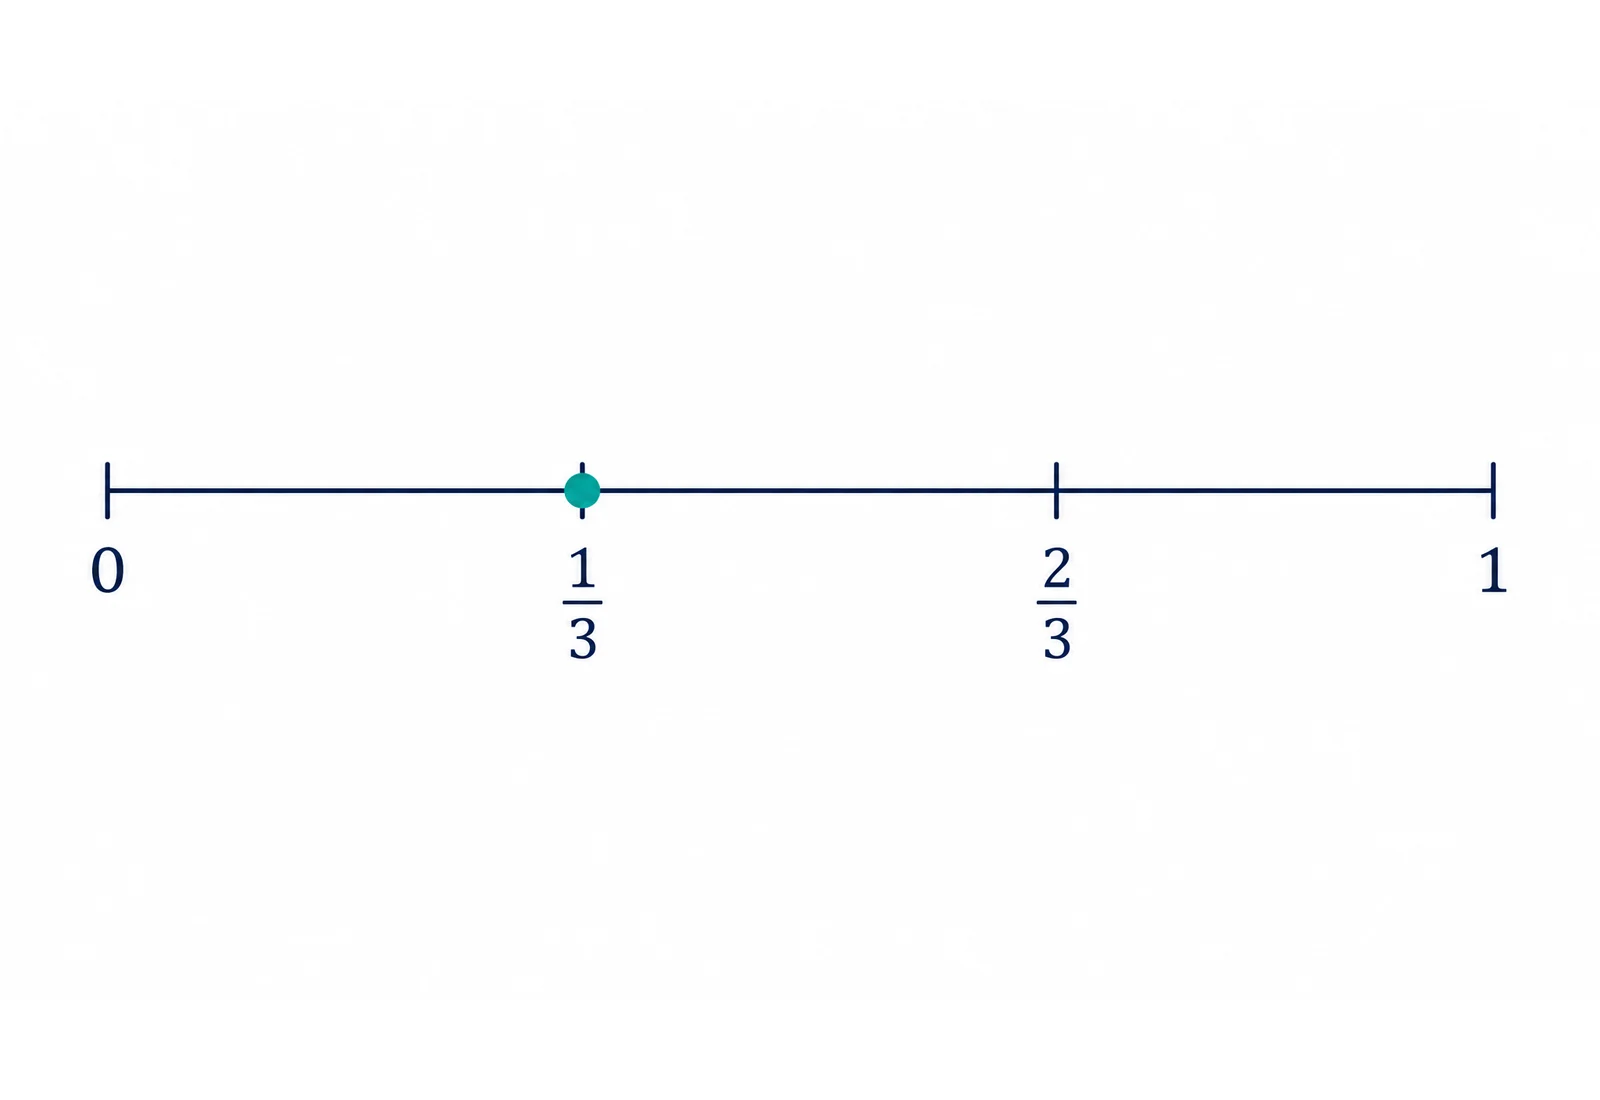
An AI number line graph generator can turn a written explanation into a labeled figure for fractions, decimals or signed values. Name the fractions exactly, such as 1/3 and 2/3, and describe which point should be emphasized. You can use colors to distinguish values while keeping the labels readable.

  • Preserve supplied fractions
  • Show values on either side of zero
  • Use a simple visual hierarchy
Try this example

Show intervals with endpoint symbols

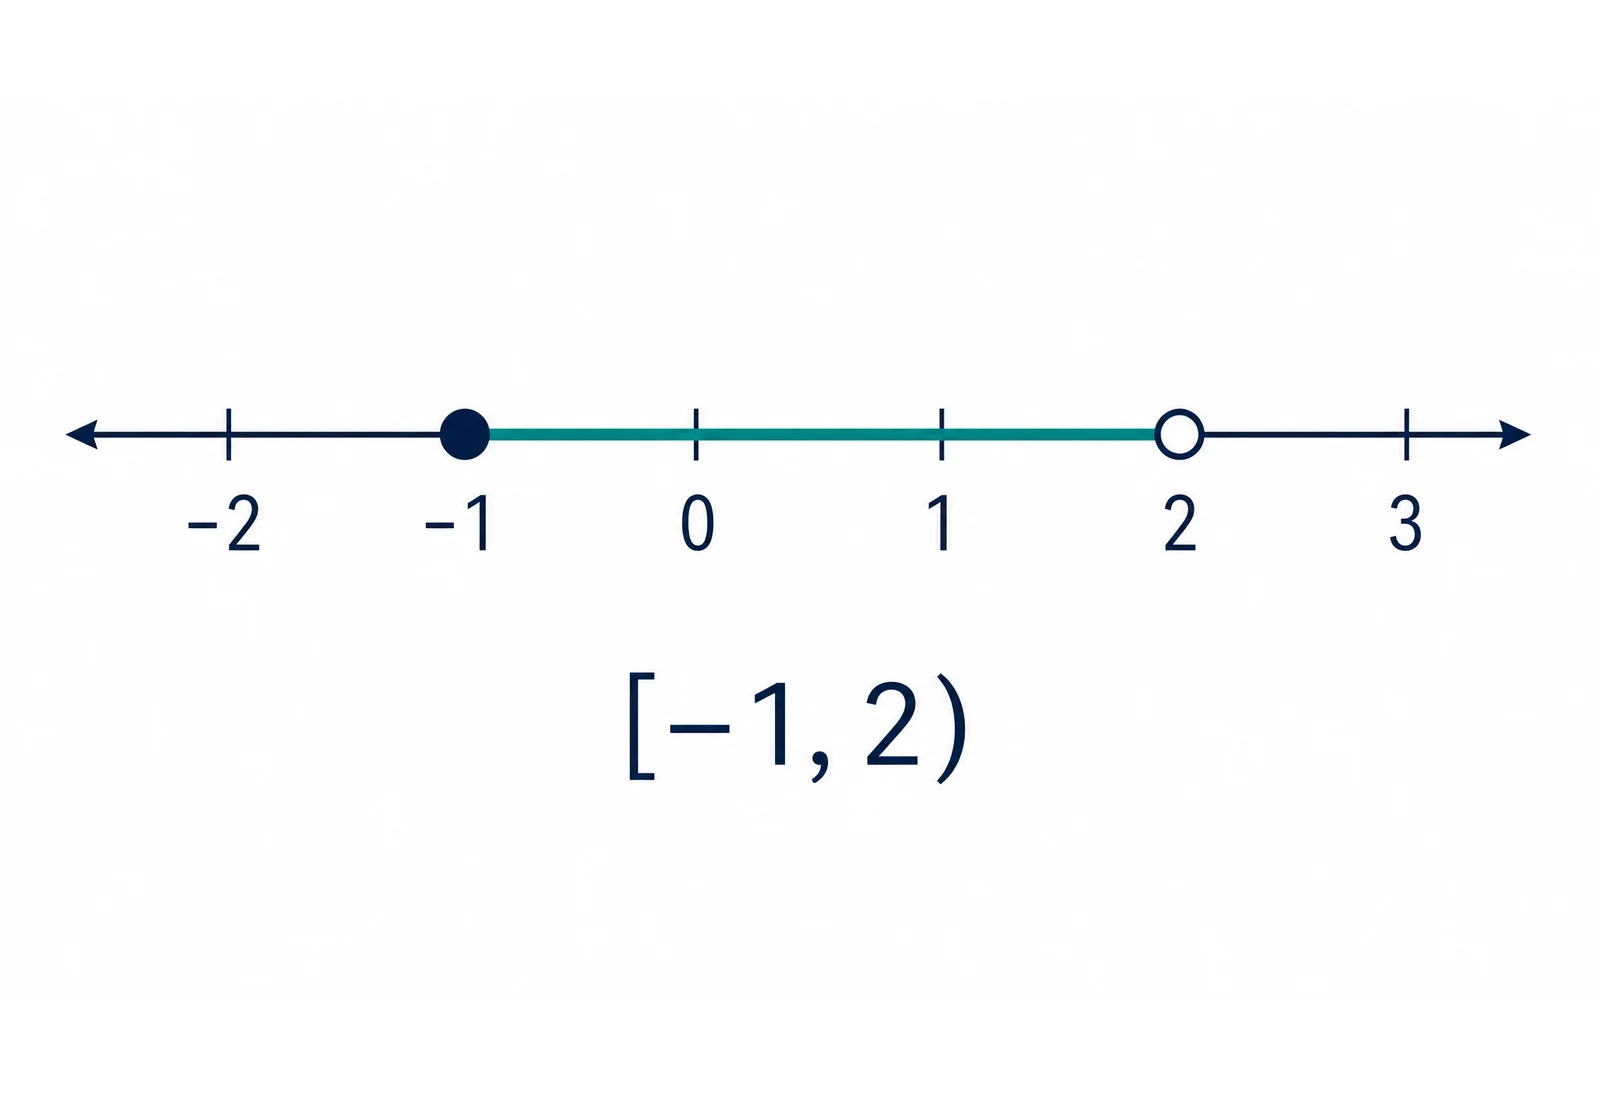
Explain an interval by giving its endpoints and whether each endpoint is included. A filled point commonly shows inclusion, while an open point shows exclusion. Describe the highlighted segment and the labels you want; the resulting number line diagram can accompany interval notation in a worksheet or slide.

  • Specify included and excluded endpoints
  • Pair the diagram with interval notation
  • Keep endpoint labels visible
Try this example

Refine the diagram for your document

You can edit the generated illustration, adjust labels and styling, and export it as SVG, PNG, JPG or PPTX. Keep the original teaching prompt with the figure so that a later version can use another range or set of labels. For exact two-dimensional grids and equations, use the coordinate plane generator.

  • Adjust the labels and appearance
  • Export for documents and slides
  • Use the coordinate tool for exact x/y plotting
Try this example

Number Line Maker Steps

Start from a specific explanation, supply the details and refine the result for your document.

  1. List the values and symbols

    Write the range, tick labels, marked points and any interval endpoints. Include the open or closed symbols explicitly rather than relying on the generator to infer them. For the supplied interval example, specify both endpoint values and which bound is included so the requested labels and symbols remain part of the input.

  2. Describe the teaching diagram

    Tell the number line maker who the figure is for and where it will appear. A blank worksheet axis and an annotated slide may need different labels and visual emphasis. Describe which values should stand out and whether learners need space to add their own marks, helping the diagram serve a specific classroom activity.

  3. Generate and refine

    Generate through Illustration and open the result in the editor. You can revise labels, colors and the layout to fit the explanation and the document. For related examples, you can retain the same label style and visual emphasis while changing the values in your input for the next illustration.

  4. Export the figure

    Download the number line as an image or editable figure for your worksheet or slides. Save the prompt and project if you want to create a related example later. A labeled diagram can accompany your explanation, while a blank axis can become a classroom activity in which learners decide where the values belong.

Number Line Maker Uses

These tasks connect a concrete input with the figure you want to explain or share.

AI teaching number line from minus two to two with nine labeled half-step ticks and arrows at both ends

Teach negative numbers

Place values on both sides of zero so learners can compare signs and order. Half-step labels can connect whole numbers with decimal values. Use the supplied half-step example to discuss how values increase from left to right, then ask learners to locate another value using the same labels.

Explore this example
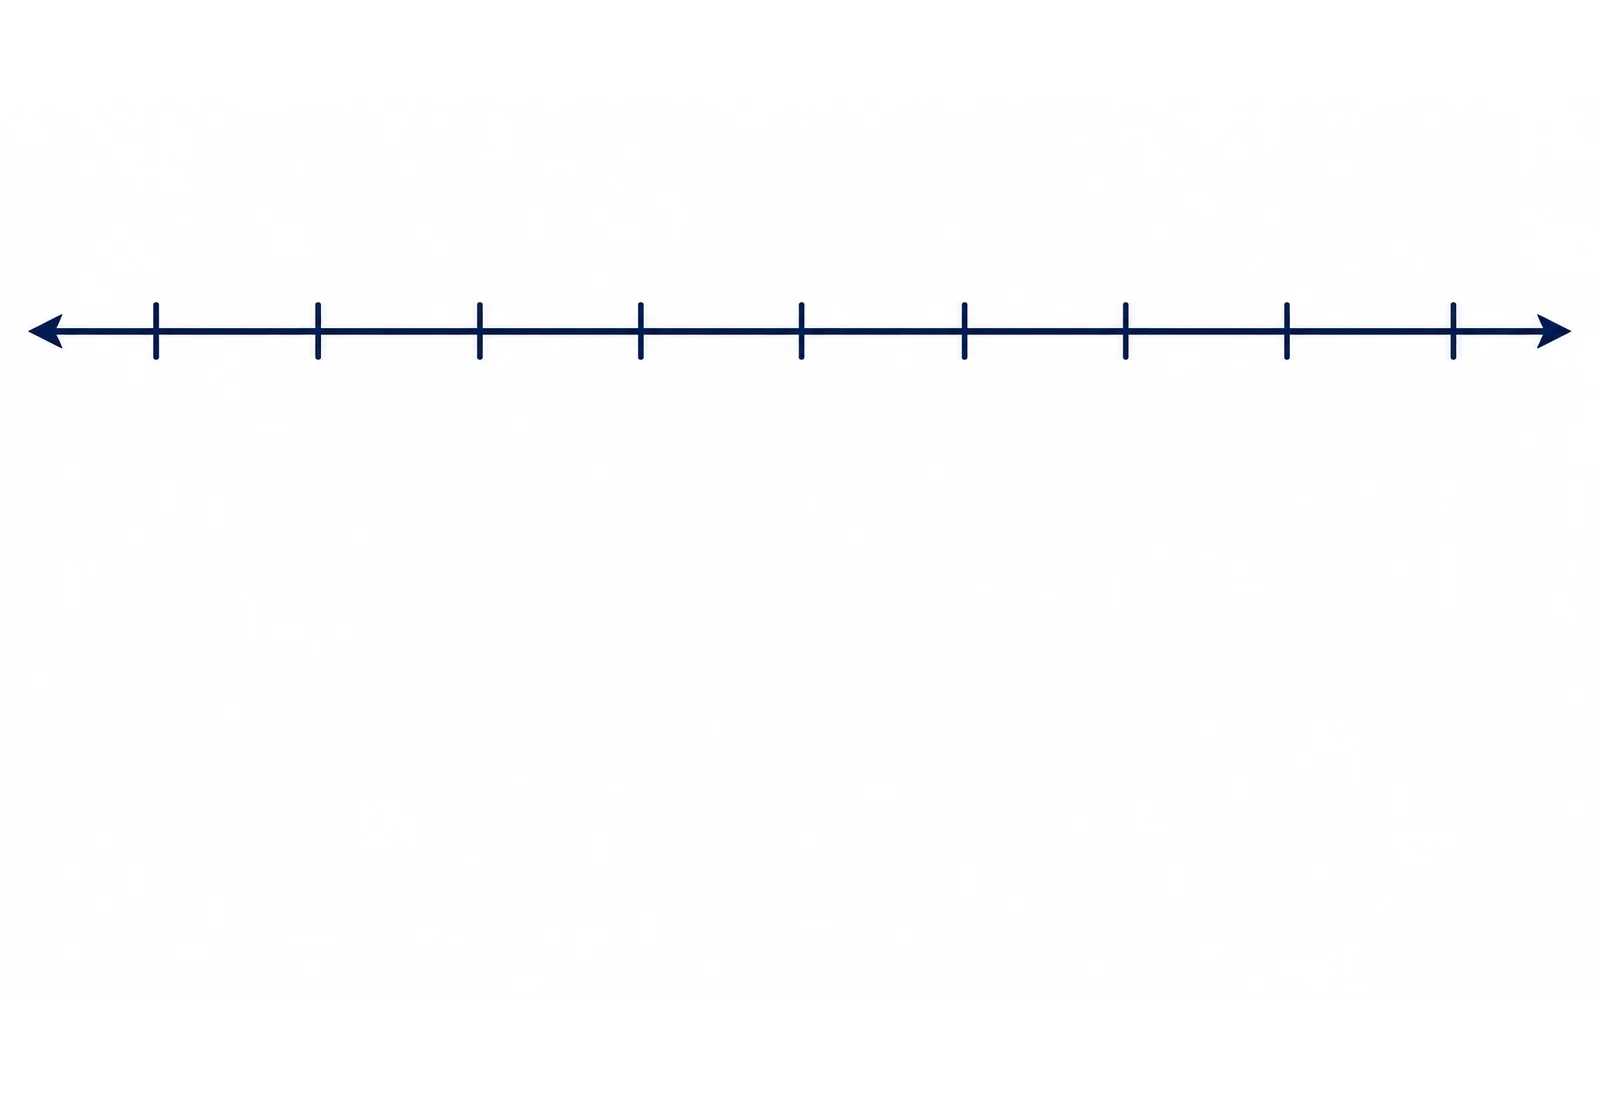
Blank teaching number line with nine tick marks and arrows at both ends

Prepare a blank worksheet

Use an unlabeled axis for an exercise in placing values or creating a scale. Learners can add their own labels during the lesson. Describe the length and placement of the axis, then use the resulting figure as a starting point for students to label values and explain their choices.

Explore this example

Number line illustrating the interval from minus one inclusive to two exclusive with filled and open endpoints

Explain interval notation

Pair a highlighted segment with filled and open endpoints. The diagram gives a visual explanation of inclusive and exclusive bounds. Specify which endpoint is included and which is excluded, then use the supplied segment to connect the visible symbols with the interval written in your notes.

Explore this example
Qualitative number line with labels zero, one third, two thirds and one and a point at one third

Introduce fractional values

Show named fractions between whole numbers and highlight the value being discussed. Keep the exact fraction text in the prompt. Use the supplied fraction-point example to locate one-third between zero and one, then ask learners to relate the marked point to the labels at one-third and two-thirds.

Explore this example
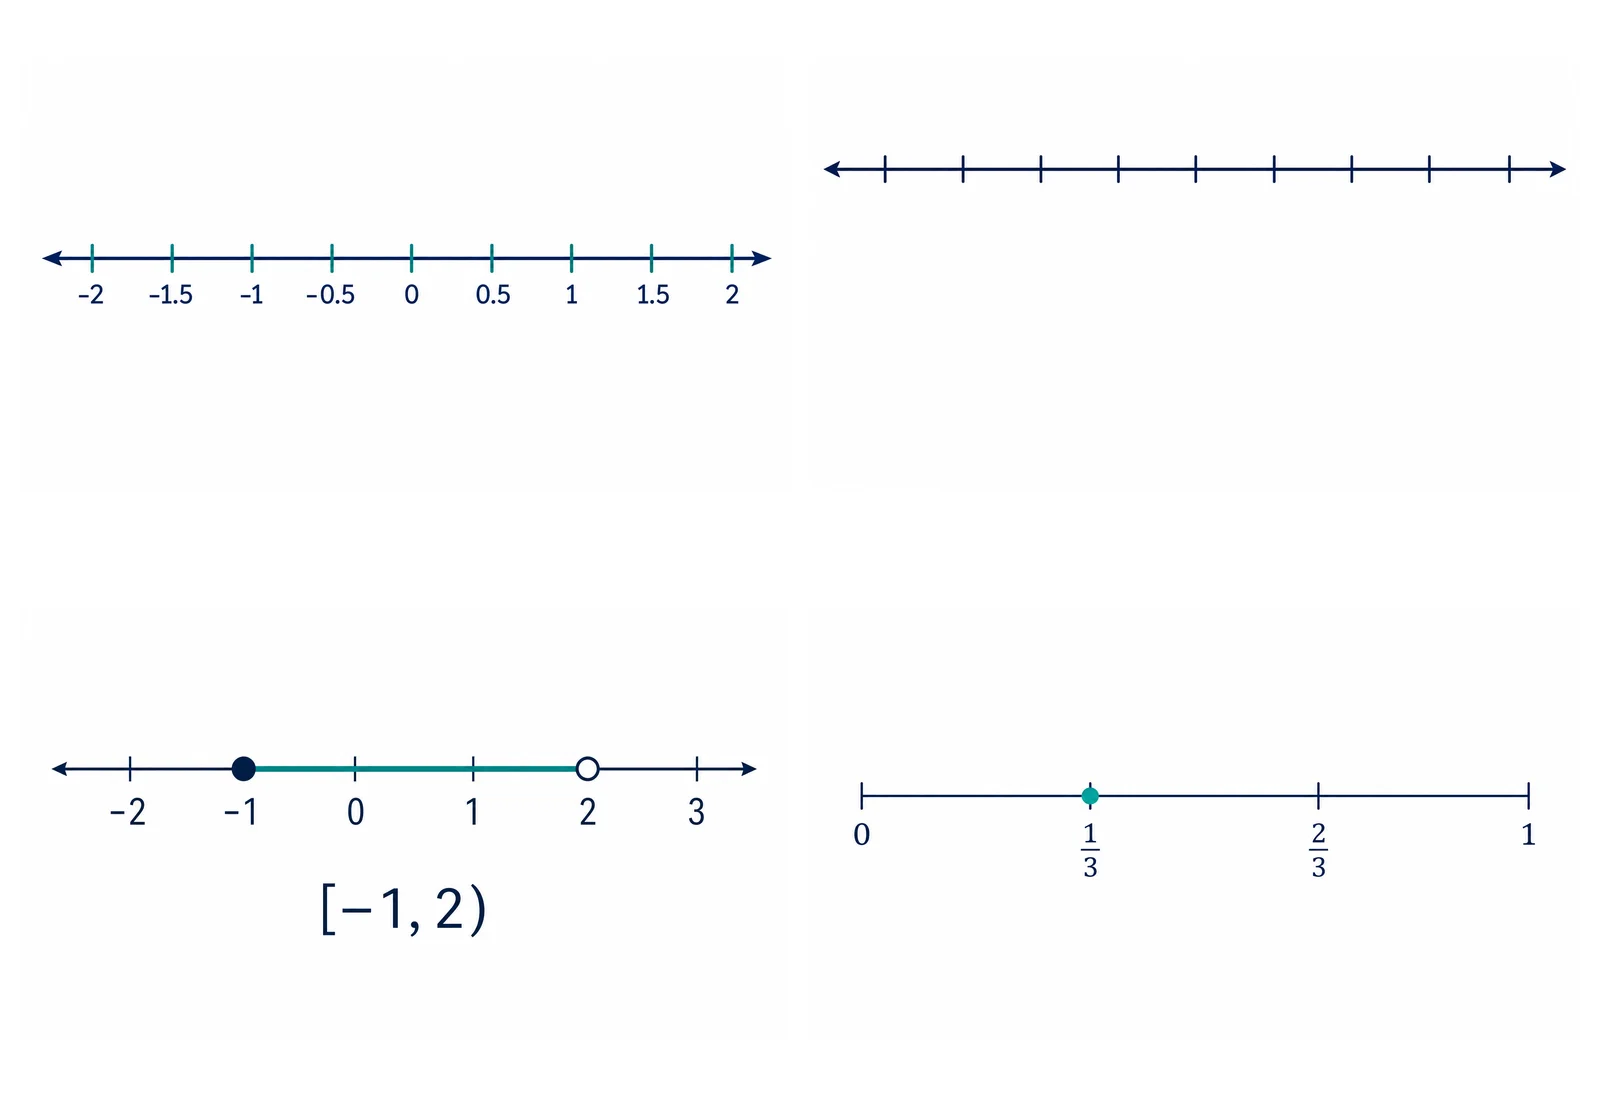
Montage of AI number line diagrams for half-step labels, blank worksheets, intervals and fractions

Build consistent lesson slides

Use a restrained palette and large labels across related diagrams. A number line maker can create a set of visual examples around the same teaching topic. Keep the same range and label placement in your input when comparing related examples, so learners can focus on the changed value or interval being discussed.

Explore this example
AI teaching number line from minus two to two with nine labeled half-step ticks and arrows at both ends

Connect one-dimensional and coordinate diagrams

Start with values on a single axis, then link to an exact coordinate plane when the lesson moves to ordered pairs and equations. The number line supports comparison and interval explanations; the coordinate plane provides a separate two-axis setting for plotting the ordered pairs supplied in the next activity.

Explore this example
Number Line Maker Scenarios

Illustrative ways to use the tool in a lesson, report or research discussion.

I would create a blank axis for students to label, then prepare an annotated example for the class discussion.

Alex R.

Primary school teacher

These are illustrative use scenarios with fictional names, not verified customer reviews.

Free tools

A tool for every scientific figure

94 focused generators for the scientific figure you need — each opens in the right workspace with a matching example.

Number Line Maker Questions

1.

2.

3.

4.

5.

6.

Call to action background

Turn your explanation into a figure

Number Line Maker: Create Your Figure

Create your figure

Free to start · No credit card required · Built for researchers